WinDbg は、最新のビジュアル、より高速なウィンドウ、本格的なスクリプト エクスペリエンスを提供する Windows デバッガーの最新バージョンです。 WinDbug は、拡張可能なデバッガー データ モデルの前面と中央を使用して構築されます。
Note
WinDbg was previously released as WinDbg Preview in the Microsoft Store. WinDbg uses the same underlying engine as WinDbg (Classic). 同じコマンド、拡張機能、ワークフローがすべてサポートされています。
目立つ機能を使用する
WinDbg で提供される多くの機能とプログラミングの利点を使用して、デバッグ エクスペリエンスを向上させます。
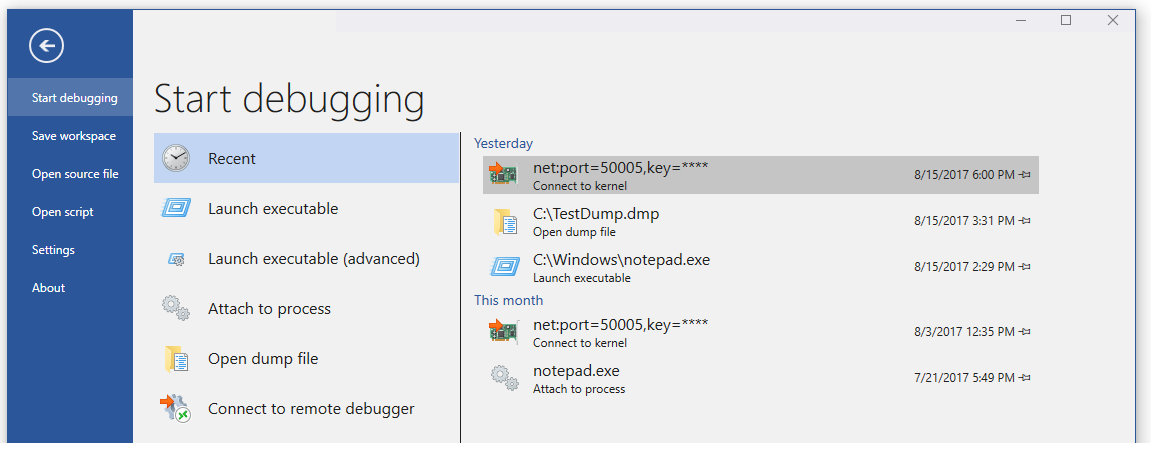
接続のセットアップと再現 - 最近のターゲットとセッション構成を保存します。 You can quickly restart saved items from the File menu.
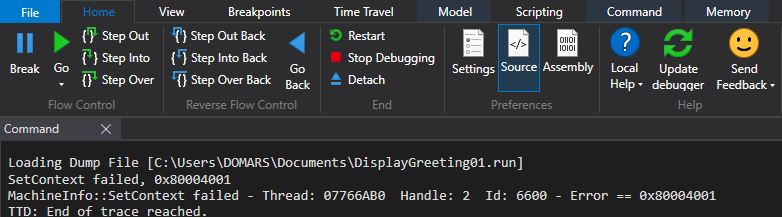
Dark theme - Enable user interface (UI) preferences like dark theme under File>Settings.
Keyboard navigation - Use keyboard shortcuts like Ctrl + Tab, which lets you easily navigate between windows.
ダンプ ファイル プロセッサ検出 - プロセッサ アーキテクチャの自動検出を利用し、マネージド デバッグをすばやく設定します。
Performance improvements - Work with tool windows that load asynchronously and cancel them as needed. コマンドを実行すると、WinDbg は、ローカル、ウォッチ、またはその他のウィンドウの読み込みを停止できます。
Start debugging
次の機能を使用して WinDbg でのデバッグを開始します。
統合タイム トラベル デバッグ (TTD) - プロセスを起動またはアタッチするときに、[ タイム トラベル デバッグを含むレコード ] オプションを選択します。 WinDbg は TTD を設定し、記録を開始し、後でトレースを開きます。
詳細については、「Time Travel Debugging - 概要」を参照してください。
![記録用にメモ帳プロセスが選択されている WinDbg の [プロセス レコード] ダイアログのスクリーンショット。](images/windbgx-ttd.png)
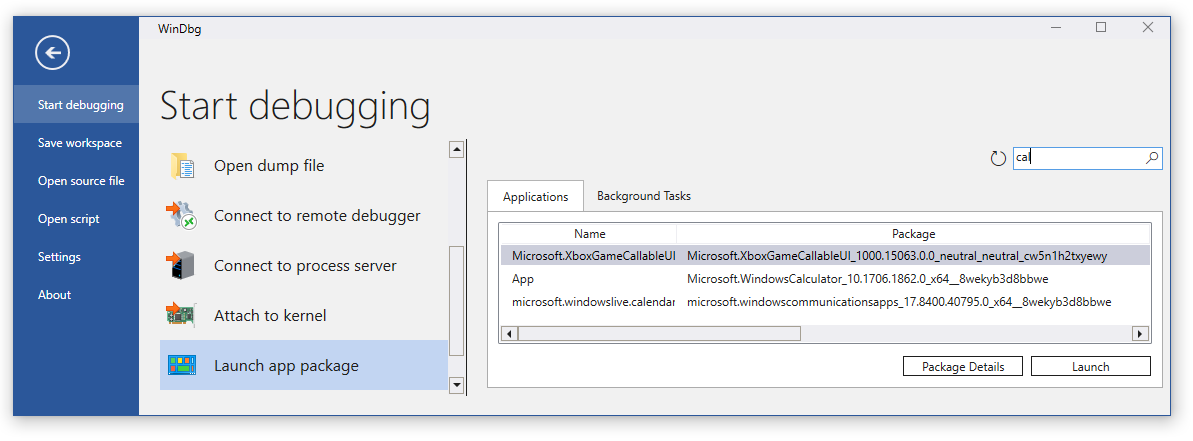
アプリ パッケージの起動 - 1 回のマウス クリックでユニバーサル アプリまたはバックグラウンド タスクをデバッグします。
詳細については、「 アプリ パッケージの起動」を参照してください。
プロセスへのアタッチ - [アタッチ] ビューを使用して、実行中のプロセスの詳細な概要を取得し、簡単な構成にアクセスし、サポートを検索します。
![WinDbg デバッガーの [プロセスにアタッチ] ダイアログのスクリーンショット。](images/windbgx-attach-to-a-process-zoomed.png)
ツール ウィンドウの操作
WinDbg のツール ウィンドウの多くの機能強化を活用します。
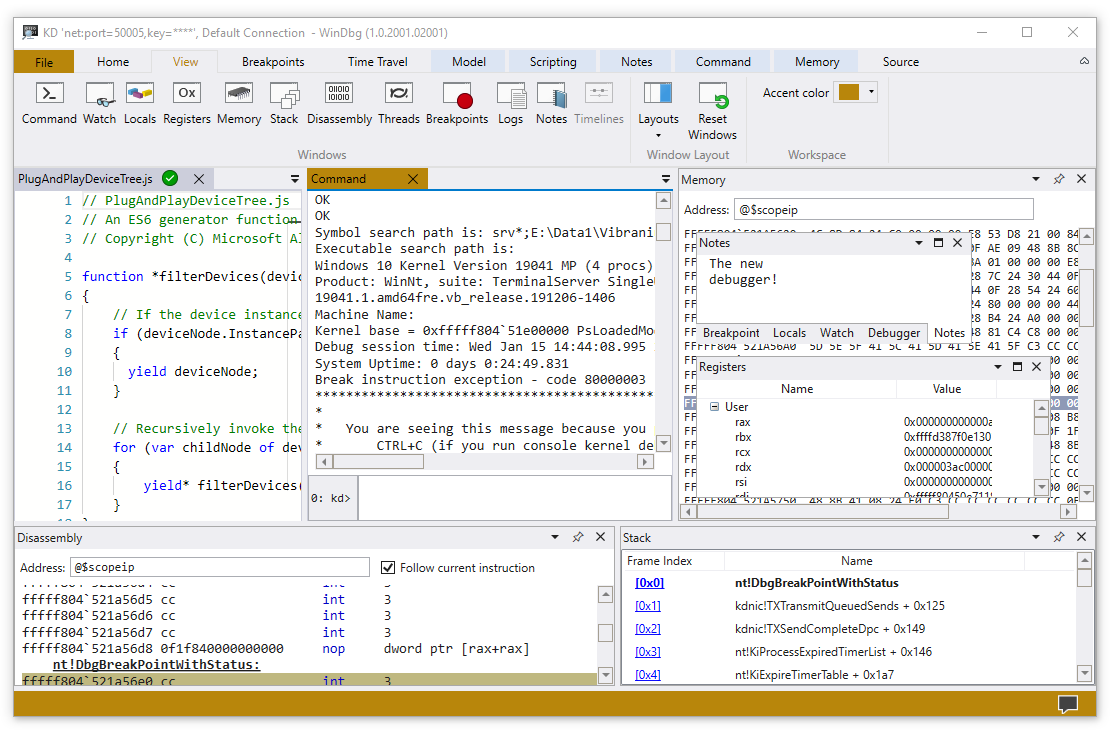
The Command window offers improved DML support, text highlighting, and search (including Regex).
The Source code window provides syntax highlighting and other general improvements similar to most modern text editors.
![構文が強調表示されている WinDbg デバッガーの [ソース コード] ウィンドウのスクリーンショット。](images/windbgx-source-window.png)
The Disassembly windows maintains the highlight on the current instruction as you scroll.
![WinDbg デバッガーの [逆アセンブル] ウィンドウのスクリーンショット。](images/windbgx-disassembly.png)
The Breakpoints window shows all your current breakpoints, a one-click toggle, and a hit count. 詳細については、「 WinDbg - ブレークポイント」を参照してください。
![現在のブレークポイントを示す WinDbg デバッガーの [ブレークポイント] ウィンドウのスクリーンショット。](images/windbgx-breakpoints-window.png)
The Scripting window makes it easier for you to develop JavaScript and NatVis extensions, and use error highlighting and IntelliSense. 詳細については、「 WinDbg - スクリプト」を参照してください。
![IntelliSense とエラーが強調表示された WinDbg デバッガーの [スクリプト] ウィンドウのスクリーンショット。](images/windbgx-scripting-intellisense.png)
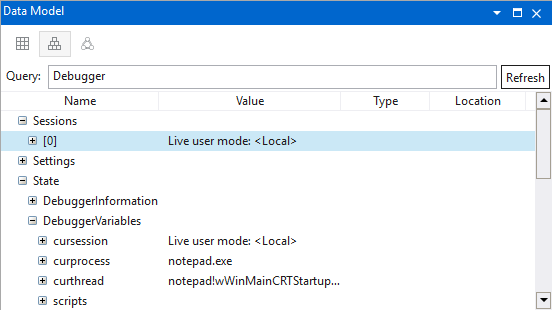
The Data model window provides an expandable and browsable version of the dx and dx -g commands. この機能は、NatVis、JavaScript、LINQ クエリの上に強力なテーブルを作成するのに役立ちます。 詳細については、「 WinDbg - データ モデル」を参照してください。
The Locals and Watch windows are both based off the data model used by the dx command. 他のデータ モデル ウィンドウと同じ機能を利用できます。
The Memory window has highlighting and improved scrolling.
The Logs feature provides an under-the-covers log of the WinDbg internals. ログを表示してトラブルシューティングを行ったり、実行時間の長いコマンドを監視したりできます。
動作中の WinDbg を探索する
Watch the following episodes of the Defrag Tools show and see WinDbg in action:
- Defrag Tools #182 - Tim、Chad、Andy では、WinDbg の基本といくつかの機能について説明します。
- Defrag Tools #183 - Nick、Tim、Chad は WinDbg を使用し、簡単なデモを実行します。
- Defrag Tools #184 - Bill と Andrew が WinDbg のスクリプト機能 (JavaScript) について説明します。
- Defrag Tools #185 - James と Ivette は、タイム トラベル デバッグの概要を提供します。
- Defrag Tools #186 - James と JCAB は、高度なタイム トラベル デバッグをカバーします。
WinDbg のインストールと構成
WinDbg のインストールと構成については、次の記事を参照してください。
Provide feedback
フィードバックは、Microsoft チームが WinDbg の開発をガイドし、機能に優先順位を付けるのに役立ちます。
To report bugs or suggest features, select Feedback in the ribbon to go to the WinDbg-Feedback page on GitHub where you can file a new issue.