Note
Access to this page requires authorization. You can try signing in or changing directories.
Access to this page requires authorization. You can try changing directories.
Debugging Tools for Windows supports kernel debugging over a network. This article describes how to set up network debugging automatically by using the KDNET (kdnet.exe) setup tool.
The computer that runs the debugger is the host computer, and the computer being debugged is the target computer. The host computer must run Windows 7 or later, and the target computer must run Windows 8 or later.
Determine the IP address of the host computer
Use these steps to find the IP address of the host computer:
Confirm the target and host PCs are connected to a network hub or switch with an appropriate network cable.
On the host computer, open a command prompt and enter IPConfig to display the IP configuration.
In the command output, locate the IPv4 address of the Ethernet adapter for the computer,
<Host-IP-Address>:... Ethernet adapter Ethernet: ... IPv4 Address. . . . . . . . . . . : <Host-IP-Address> ...Alternatively, use Settings > Network & internet > Ethernet to gather the IPv4 address information.
Make a note of the IPv4 address of the network adapter that you intend to use for debugging.
Set up the host and target computers
Use the KDNET utility to automatically configure the debugger settings on the target PC with these steps.
Note
This procedure assumes both the host and target computes are running a 64-bit version of Windows. If your configuration is different, the best approach is to run the same "bitness" of tools on the host that's running on the target. For example, if the target is running 32-bit Windows, run a 32-bit version of the debugger on the host. For more information, see Choosing the 32-bit or 64-bit Debugging Tools.
Confirm Windows Debugging Tools are installed on the host computer. For information on downloading and installing the tools, see Debugging Tools for Windows.
Locate the kdnet.exe and VerifiedNICList.xml files on the host computer. By default, the files are located in the C:\Program Files (x86)\Windows Kits\10\Debuggers\x64 folder.
Copy the two files on the host computer to a network share or thumb drive so they're available for the target computer.
On the target computer, create a C:\KDNET folder, and copy the kdnet.exe and VerifiedNICList.xml files to the folder.
Important
Before you use kdnet.exe to change boot information, you might need to temporarily suspend Windows security features on the test PC, such as BitLocker and Secure Boot. After you finish testing, reenable the security features. Be sure to appropriately manage the test PC when the security features are disabled.
On the target computer, open a command prompt as an administrator. Enter the following command to verify the target computer has a supported network adapter:
C:\KDNET>kdnet.exe
Network debugging is supported on the following NICs:
busparams=1.0.0, Broadcom NetXtreme Gigabit Ethernet, Plugged in.
This Microsoft hypervisor supports using KDNET in guest VMs.
After the output from the KDNET (kdnet.exe) command shows the network adapter supported on the target, you can proceed.
Enter the following command to set the IP address of the host system and generate a unique connection key.
- For the
<Host-Computer-IP-Address>value, use the IP address or name of the host system. - For the
<Debug-Port>value, enter a unique port address for each target/host pair that you work with, within the recommended range of 50000-50039.
C:\KDNET>kdnet.exe <Host-Computer-IP-Address> Enabling network debugging on Intel(R) 82577LM Gigabit Network Connection. Key=2steg4fzbj2sz.23418vzkd4ko3.1g34ou07z4pev.1sp3yo9yz874p- For the
Save the key value returned by the KDNET command in a notepad .txt file.
Connect WinDbg to the target for kernel debugging
Connect WinDbg to the target computer for kernel debugging by following these steps:
On the host computer, open WinDbg, and select File > Kernel Debug.
In the Kernel Debugging dialog, select the Net tab.
Paste the port number and key from the notepad.txt file into the tab fields, and select OK.
You can also start the WinDbg session from the command line by using the windbg.exe command and the values you saved in the notepad.txt file.
windbg.exe -k -d net:port=<Debug-Port>,key=<KDNET-Key>
The <Debug-Port> value is the port you selected previously. The <KDNET-Key> value is the key returned by KDNET. The optional -d parameter enables early break-in. For more information, see WinDbg command-line options.
When you start the connection, WinDbg might prompt you to allow access to the port through the firewall:
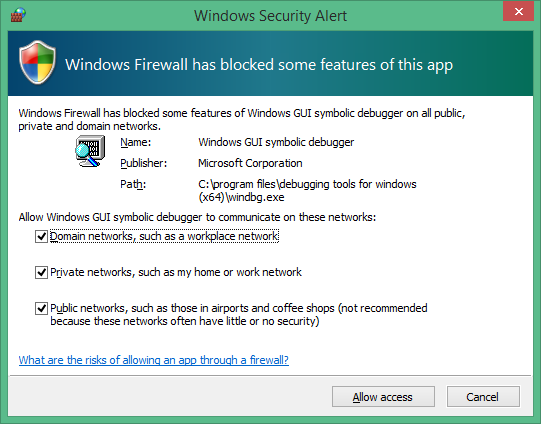
In the message dialog, select each checkbox to enable access for all three network types, and select Allow access.
At this point, the debugger waits for the target to reconnect and shows progress in the debugger command window:
Microsoft (R) Windows Debugger Version 1.0.1908.30002 AMD64
Copyright (c) Microsoft Corporation. All rights reserved.

Using NET for debugging
Opened WinSock 2.0
Waiting to reconnect...
Restart the target PC
When the debugger displays the "Waiting to reconnect..." message, reboot the target computer.
One way to restart the PC is to run the following command in a command prompt as an administrator:
shutdown -r -t 0
After the target PC restarts, the debugger should connect automatically.
Troubleshoot issues
If you have issues establishing the port connection or starting the debug session, review the following troubleshooting tips.
Allow debugging apps through the firewall
On the host side, where the debugger is running, all types of networking must be enabled to allow the debugger to communicate with the target through the firewall.
Use the Windows Control Panel to allow access through the firewall.
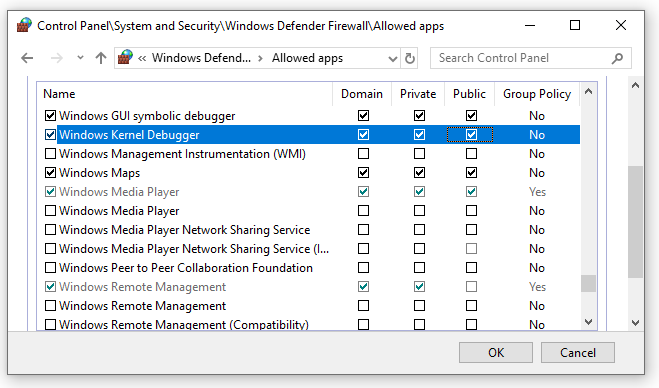
Open Control Panel > System and Security and select the appropriate Allow an app through Windows Firewall options:
WinDbg: In the list of applications, locate the WinDbg engine process (TCP) (all) option.
WinDbg (Classic): In the list of applications, locate the Windows GUI Symbolic Debugger and Windows Kernel Debugger options.
Select the checkboxes to allow all debugging applications through all three network types.
Select OK to save the firewall changes, and then restart the debugger.
Use ping to test connectivity
If the debugger times out and doesn't connect, use the ping command on the target PC to verify connectivity:
C:\>Ping <HostComputerIPAddress>
Choose a port for network debugging
If the debugger times out and doesn't connect, it might be because the default port number of 50000 is already in use or is blocked.
You can choose any port number between 49152 and 65535, inclusive. The recommended range is 50000 through 50039. The port you choose opens for exclusive access by the debugger running on the host computer.
A company network policy might limit the range of port numbers available for network debugging. To determine whether your company's policy limits the range of ports for network debugging, check with your network administrators.
Find supported network adapters
If you see the Network debugging isn't supported on any of the NICs in this machine message when you run KDNET, the network adapter isn't supported.
The host computer can use any network adapter, but the target computer must use a network adapter supported by Debugging Tools for Windows. For a list of supported network adapters, see the following articles:
- Supported Ethernet NICs for network kernel debugging in Windows 10
- Supported Ethernet NICs for network kernel debugging in Windows 8.1
Enable other debugging types
Windows 10 October 2020 Update (20H2) and later support four types of debugging:
| KDNET option | Debugging type | Equivalent set command | More information |
|---|---|---|---|
b |
Bootmgr debugging | bcdedit /bootdebug {bootmgr} on |
BCDEdit /bootdebug |
w |
Winload debugging | bcdedit /bootdebug on |
BCDEdit /bootdebug |
k |
Kernel debugging | bcdedit /debug on |
Get started with WinDbg (kernel-mode) |
h |
Hypervisor debugging | bcdedit /set hypervisordebug on |
BCDEdit /hypervisorsettings |
Here are the details about working with the debugging types:
- You can specify any combination of debug types.
- If you don't specify a debug types, the system enables kernel debugging.
- If you enable both hypervisor and kernel debugging, the hypervisor port is set to
<Debug-Port>+ 1.
Example: Enable bootmgr, kernel, and winload debugging
The following example uses the - bkw option to enable bootmgr, kernel, and winload debugging:
C:\>kdnet.exe <HostComputerIPAddress> <YourDebugPort> -bkw

Enabling network debugging on Intel(R) 82577LM Gigabit Network Connection.
Key=2steg4fzbj2sz.23418vzkd4ko3.1g34ou07z4pev.1sp3yo9yz874p
Specify bus parameters
If KDNET isn't able to automatically determine the bus parameters for your transport, you can specify the parameters on the command line with the /busparams option:
kdnet.exe /busparams [b.d.f] [host] [port] [-[b][h][k][w]]
The b.d.f portion specifies the bus parameters for the device to configure.
Use Device Manager on the target computer to determine the PCI bus number (b), the device number (d), and the function number (f) of the adapter you want to use for debugging. These values are available in the General tab under the Location setting.
For example:
C:\>kdnet.exe /busparams 0.29.7 <Host-Computer-IP-Address> <Debug-Port> -bkw