Note
Access to this page requires authorization. You can try signing in or changing directories.
Access to this page requires authorization. You can try changing directories.
Windows Debugger (WinDbg) is a kernel-mode and user-mode debugger included in the Debugging Tools for Windows. This article provides exercises to help you get started with using WinDbg as a kernel-mode debugger.
To get WinDbg, see Download and install the Windows debugger (WinDbg).
Set up a kernel-mode debugging
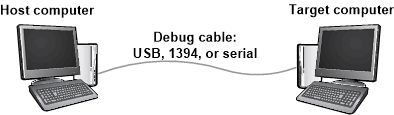
A kernel-mode debugging environment typically has two computers, the host computer and the target computer. The debugger runs on the host computer, and the code being debugged runs on the target computer. The host and target are connected by a debug cable.
The Windows debuggers support the following types of cables:
- Ethernet
- USB 3.0
- Serial (also called null modem)
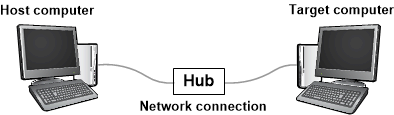
For speed and reliability, you should use an Ethernet cable with a local network hub. The following diagram illustrates a host and target computer connected for debugging with an Ethernet cable:
An option for older versions of Windows is to use a direct cable, such as a serial cable:
Start the process by following the setup procedure for your desired configuration:
To set up the host and target computers, see Set up kernel-mode debugging manually.
To connect a debugger to a Hyper-V virtual machine (VM), see Set up network debugging for a virtual machine host - Kernel debugging over network (KDNET).
Establish a kernel-mode debugging session
After you set up your host and target computer and connect them with a debug cable, you can establish a kernel-mode debugging session.
Continue with the instructions in the article you used for the setup process. For example, if you set up your host and target computers for debugging over an Ethernet cable for kernel-mode debugging, follow the instructions in Set up KDNET network kernel debugging automatically.
Start debugging with WinDbg
To get started with using WinDbg for the debugging session, follow these steps:
On the host computer, open WinDbg and establish a kernel-mode debugging session with the target computer.
Open the debugger documentation CHM (.chm) file by selecting Help > Contents.
The debugger documentation is also available online in the Debugging Tools for Windows. For more information, see Install the Windows debugger.
When you establish a kernel-mode debugging session, WinDbg might break into the target computer automatically. If WinDbg doesn't break in, select Debug > Break.
In the command line at the bottom of the WinDbg window, run the following commands:
Set the symbol path with the .sympath (Symbol Path) command.
.sympath srv*The output is similar to this example:
Symbol search path is: srv*
Expanded Symbol search path is: cache*;SRV*https://msdl.microsoft.com/download/symbols
The symbol search path tells WinDbg where to look for symbol program database (PDB) files (.pdb). The debugger needs symbol files to obtain information about code modules, such as function names and variable names.
Run the .reload command so WinDbg starts finding and loading symbols files.
.reload
View a list of loaded modules with the lm command.
lmThe output is similar to this example:
0:000>3: kd> lm
start               end                 module name
fffff800`00000000   fffff800`00088000   CI            (deferred)
...
fffff800`01143000   fffff800`01151000   BasicRender   (deferred)
fffff800`01151000   fffff800`01163000   BasicDisplay  (deferred)
...
fffff800`02a0e000   fffff800`03191000   nt  (pdb symbols) C:\...\ntkrnlmp.pdb
fffff800`03191000   fffff800`03200000   hal (deferred)
...
Start the target computer running again with the g (Go) command.
gBreak in to the target computer again by selecting Debug > Break.
Run the dt (Display Type) command and examine the
_FILE_OBJECTdata type in thentmodule:dt nt!_FILE_OBJECTThe output is similar to this example:
0:000>0: kd> dt nt!_FILE_OBJECT
   +0x000 Type                 : Int2B
   +0x002 Size                 : Int2B
   +0x008 DeviceObject         : Ptr64 _DEVICE_OBJECT
   +0x010 Vpb                  : Ptr64 _VPB
   ...
   +0x0c0 IrpList              : _LIST_ENTRY
   +0x0d0 FileObjectExtension  : Ptr64 Void
Run the x (Examine Symbols) command and look at some of the symbols in the
ntmodule:x nt!\*CreateProcess\*The output is similar to this example:
0:000>0: kd> x nt!*CreateProcess*
fffff800`030821cc   nt!ViCreateProcessCallbackInternal (<no parameter info>)
...
fffff800`02e03904   nt!MmCreateProcessAddressSpace (<no parameter info>)
fffff800`02cece00   nt!PspCreateProcessNotifyRoutine = <no type information>
...
Run the bu (Set Breakpoint) and bl (Breakpoint List) commands to set and check breakpoints:
Use the
bucommand and set a breakpoint at the Windows call into theMmCreateProcessAddressSpaceroutine. Then run theblcommand and verify the breakpoint is set.bu nt!MmCreateProcessAddressSpace blThe output is similar to this example:
0:000>0: kd> bu nt!MmCreateProcessAddressSpace
0: kd> bl
0 e fffff800`02e03904  0001 (0001) nt!MmCreateProcessAddressSpace
Enter
g(Go) to let the target computer run.gThe target computer breaks into the debugger when Windows calls the
MmCreateProcessAddressSpaceroutine.If the target computer doesn't break into the debugger immediately, perform a few actions on the target computer. For example, open Notepad and save a file.
View the stack trace with the
.reloadand k (Display Stack Backtrace) commands:.reload kThe output is similar to this example:
0:000>2: kd> k Child-SP RetAddr Call Site ffffd000`224b4c88 fffff800`02d96834 nt!MmCreateProcessAddressSpace ffffd000`224b4c90 fffff800`02dfef17 nt!PspAllocateProcess+0x5d4 ffffd000`224b5060 fffff800`02b698b3 nt!NtCreateUserProcess+0x55b ... 000000d7`4167fbb0 00007ffd`14b064ad KERNEL32!BaseThreadInitThunk+0xd 000000d7`4167fbe0 00000000`00000000 ntdll!RtlUserThreadStart+0x1dSelect View > Disassembly. Then select Debug > Step Over (or select F10).
Enter step commands a few more times as you watch the output in the Disassembly window.
Clear your breakpoint with the bc (Breakpoint Clear) command.
bc *Enter
g(Go) to let the target computer run.gTo break in again, select Debug > Break, or select CTRL-Break.
View a list of all processes with the !process command:
!process 0 0The output is similar to this example:
0:000>0: kd> !process 0 0 **** NT ACTIVE PROCESS DUMP **** PROCESS ffffe000002287c0 SessionId: none Cid: 0004 Peb: 00000000 ParentCid: 0000 DirBase: 001aa000 ObjectTable: ffffc00000003000 HandleCount: <Data Not Accessible> Image: System PROCESS ffffe00001e5a900 SessionId: none Cid: 0124 Peb: 7ff7809df000 ParentCid: 0004 DirBase: 100595000 ObjectTable: ffffc000002c5680 HandleCount: <Data Not Accessible> Image: smss.exe ... PROCESS ffffe00000d52900 SessionId: 1 Cid: 0910 Peb: 7ff669b8e000 ParentCid: 0a98 DirBase: 3fdba000 ObjectTable: ffffc00007bfd540 HandleCount: <Data Not Accessible> Image: explorer.exeCopy the address for a process, such as
ffffe00000d52900, and view the process information with the!processcommand. Replace the<process-address>portion with the process address:!process <process-address> 2The output for the
ffffe00000d52900process shows the following threads in the process:0:000>0:000>0: kd> !process ffffe00000d52900 2 PROCESS ffffe00000d52900 SessionId: 1 Cid: 0910 Peb: 7ff669b8e000 ParentCid: 0a98 DirBase: 3fdba000 ObjectTable: ffffc00007bfd540 HandleCount: Image: explorer.exe THREAD ffffe00000a0d880 Cid 0910.090c Teb: 00007ff669b8c000 ffffe00000d57700 SynchronizationEvent THREAD ffffe00000e48880 Cid 0910.0ad8 Teb: 00007ff669b8a000 ffffe00000d8e230 NotificationEvent ffffe00000cf6870 Semaphore Limit 0xffff ffffe000039c48c0 SynchronizationEvent ... THREAD ffffe00000e6d080 Cid 0910.0cc0 Teb: 00007ff669a10000 ffffe0000089a300 QueueObjectCopy the address for a thread, such as
ffffe00000e6d080, and view the thread information with the !thread command. Replace the<thread-address>portion with the thread address:!thread <thread-ddress>The output for the
ffffe00000e6d080thread shows the following summary information:0: kd> !thread ffffe00000e6d080 THREAD ffffe00000e6d080 Cid 0910.0cc0 Teb: 00007ff669a10000 Win32Thread: 0000000000000000 WAIT: ... ffffe0000089a300 QueueObject Not impersonating DeviceMap ffffc000034e7840 Owning Process ffffe00000d52900 Image: explorer.exe Attached Process N/A Image: N/A Wait Start TickCount 13777 Ticks: 2 (0:00:00:00.031) Context Switch Count 2 IdealProcessor: 1 UserTime 00:00:00.000 KernelTime 00:00:00.000 Win32 Start Address ntdll!TppWorkerThread (0x00007ffd14ab2850) Stack Init ffffd00021bf1dd0 Current ffffd00021bf1580 Base ffffd00021bf2000 Limit ffffd00021bec000 Call 0 Priority 13 BasePriority 13 UnusualBoost 0 ForegroundBoost 0 IoPriority 2 PagePriority 5 ...View all the device nodes in the Plug and Play device tree with the !devnode command:
!devnode 0 1The output is similar to this example:
0:000>0: kd> !devnode 0 1 Dumping IopRootDeviceNode (= 0xffffe000002dbd30) DevNode 0xffffe000002dbd30 for PDO 0xffffe000002dc9e0 InstancePath is "HTREE\ROOT\0" State = DeviceNodeStarted (0x308) Previous State = DeviceNodeEnumerateCompletion (0x30d) DevNode 0xffffe000002d9d30 for PDO 0xffffe000002daa40 InstancePath is "ROOT\volmgr\0000" ServiceName is "volmgr" State = DeviceNodeStarted (0x308) Previous State = DeviceNodeEnumerateCompletion (0x30d) DevNode 0xffffe00001d49290 for PDO 0xffffe000002a9a90 InstancePath is "STORAGE\Volume\{3007dfd3-df8d-11e3-824c-806e6f6e6963}#0000000000100000" ServiceName is "volsnap" TargetDeviceNotify List - f 0xffffc0000031b520 b 0xffffc0000008d0f0 State = DeviceNodeStarted (0x308) Previous State = DeviceNodeStartPostWork (0x307) ...View the device nodes and their hardware resources with the
!devnodecommand:!devnode 0 9The output is similar to this example:
0:000>... DevNode 0xffffe000010fa770 for PDO 0xffffe000010c2060 InstancePath is "PCI\VEN_8086&DEV_2937&SUBSYS_2819103C&REV_02\3&33fd14ca&0&D0" ServiceName is "usbuhci" State = DeviceNodeStarted (0x308) Previous State = DeviceNodeEnumerateCompletion (0x30d) TranslatedResourceList at 0xffffc00003c78b00 Version 1.1 Interface 0x5 Bus #0 Entry 0 - Port (0x1) Device Exclusive (0x1) Flags (0x131) - PORT_MEMORY PORT_IO 16_BIT_DECODE POSITIVE_DECODE Range starts at 0x3120 for 0x20 bytes Entry 1 - DevicePrivate (0x81) Device Exclusive (0x1) Flags (0000) - Data - {0x00000001, 0x00000004, 0000000000} Entry 2 - Interrupt (0x2) Shared (0x3) Flags (0000) - LEVEL_SENSITIVE Level 0x8, Vector 0x81, Group 0, Affinity 0xf ...View a device node that has a service name of "disk" with the
!devnodecommand:!devnode 0 1 diskThe output is similar to this example:
0: kd> !devnode 0 1 disk Dumping IopRootDeviceNode (= 0xffffe000002dbd30) DevNode 0xffffe0000114fd30 for PDO 0xffffe00001159610 InstancePath is "IDE\DiskST3250820AS_____________________________3.CHL___\5&14544e82&0&0.0.0" ServiceName is "disk" State = DeviceNodeStarted (0x308) Previous State = DeviceNodeEnumerateCompletion (0x30d) ...The output of the
!devnode 0 1command shows the address of the physical device object (PDO) for the node.Copy the address of a PDO, such as
0xffffe00001159610, and view the PDO details with the !devstack command. Replace the<PDO-address>portion with the PDO information:!devstack <PDO-address>The output for the PDO
0xffffe00001159610thread shows the following device stack:0:000>0: kd> !devstack 0xffffe00001159610 !DevObj !DrvObj !DevExt ObjectName ffffe00001d50040 \Driver\partmgr ffffe00001d50190 ffffe00001d51450 \Driver\disk ffffe00001d515a0 DR0 ffffe00001156e50 \Driver\ACPI ffffe000010d8bf0Get information about the disk.sys driver object with the !drvobj command and the driver name "disk":
!drvobj disk 2The output shows detailed information about the driver object:
0:000>0: kd> !drvobj disk 2 Driver object (ffffe00001d52680) is for: \Driver\disk DriverEntry: fffff800006b1270 disk!GsDriverEntry DriverStartIo: 00000000 DriverUnload: fffff800010b0b5c CLASSPNP!ClassUnload AddDevice: fffff800010aa110 CLASSPNP!ClassAddDevice Dispatch routines: [00] IRP_MJ_CREATE fffff8000106d160 CLASSPNP!ClassGlobalDispatch [01] IRP_MJ_CREATE_NAMED_PIPE fffff80002b0ab24 nt!IopInvalidDeviceRequest [02] IRP_MJ_CLOSE fffff8000106d160 CLASSPNP!ClassGlobalDispatch [03] IRP_MJ_READ fffff8000106d160 CLASSPNP!ClassGlobalDispatch ... [1b] IRP_MJ_PNP fffff8000106d160 CLASSPNP!ClassGlobalDispatchThe output of the
!drvobjcommand shows addresses of dispatch routines, such asCLASSPNP!ClassGlobalDispatch. Set and verify a breakpoint at theClassGlobalDispatchroutine with the following commands:bu CLASSPNP!ClassGlobalDispatch blEnter
g(Go) to let the target computer run.gThe target computer breaks into the debugger when Windows calls the
ClassGlobalDispatchroutine.If the target computer doesn't break into the debugger immediately, perform a few actions on the target computer.or example, open Notepad and save a file.
View the stack trace with the following commands:
.reload
k
The output is similar to this example:
2: kd> k
Child-SP          RetAddr           Call Site
ffffd000`21d06cf8 fffff800`0056c14e CLASSPNP!ClassGlobalDispatch
ffffd000`21d06d00 fffff800`00f2c31d volmgr!VmReadWrite+0x13e
ffffd000`21d06d40 fffff800`0064515d fvevol!FveFilterRundownReadWrite+0x28d
ffffd000`21d06e20 fffff800`0064578b rdyboost!SmdProcessReadWrite+0x14d
ffffd000`21d06ef0 fffff800`00fb06ad rdyboost!SmdDispatchReadWrite+0x8b
ffffd000`21d06f20 fffff800`0085cef5 volsnap!VolSnapReadFilter+0x5d
ffffd000`21d06f50 fffff800`02b619f7 Ntfs!NtfsStorageDriverCallout+0x16
...
Use the qd (Quit and Detach) command to end your debugging session.
qd
Summary of commands
The following links provide more information about the commands described in this article.
- .sympath (Set symbol path)
- .reload (Reload module)
- x (Examine symbols)
- g (Go)
- dt (Display type)
- lm (List loaded modules)
- k (Display stack backtrace)
- bu (Set breakpoint)
- bl (Breakpoint list)
- bc (Breakpoint clear)
- !process
- !thread
- !devnode
- !devstack
- !drvobj
- qd (Quit and Detach)
For more information about menu commands like Debug > Break and Help > Contents, see the Get started with WinDbg (user-mode) article.