Note
Access to this page requires authorization. You can try signing in or changing directories.
Access to this page requires authorization. You can try changing directories.
The Network tool has the following features, to inspect network activity for a webpage. For a step-by-step walkthrough and introduction to the Network tool, see Inspect network activity.
Detailed contents:
- Record network requests
- Change loading behavior
- Set user agent client hints
- Search requests
- Filter requests
- Sort requests
- Analyze requests
- Display a log of requests
- Group requests by inline frames
- Display the timing relationship of requests
- Analyze the messages of a WebSocket connection
- Analyze events in a stream
- Display a preview of a response body
- Display a response body
- Display HTTP headers
- View request payload (query string parameters and form data)
- Display cookies
- Display the timing breakdown of a request
- Display initiators and dependencies
- Display load events
- Display the total number of requests
- Display the total download size
- Display the stack trace that caused a request
- Display the uncompressed size of a resource
- Export requests data
- Change the layout of the Network tool
- See also
Record network requests
By default, DevTools records all network requests in the Network tool, so long as DevTools is open.
For example:
Go to a webpage, such as the Inspect Network Activity demo page, in a new window or tab.
Right-click the webpage, and then select Inspect.
DevTools opens.
In DevTools, select the Network tool.
Refresh the webpage.
The Stop recording network log button is red and is available:
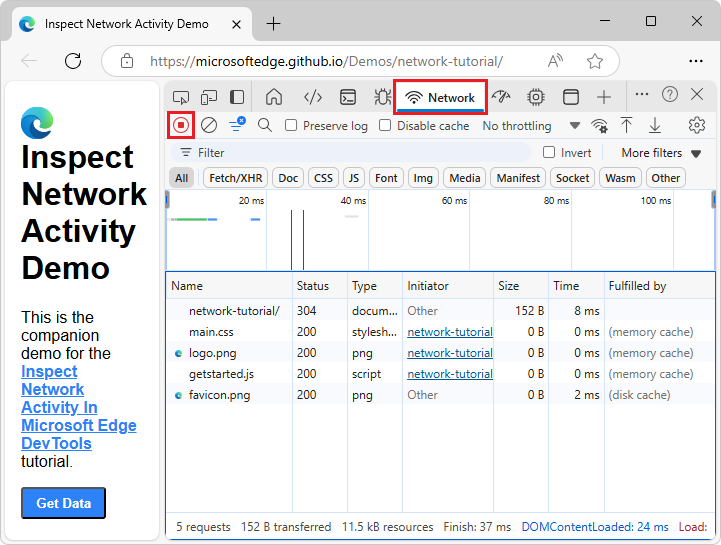
Stop recording network requests
To stop recording requests:
On the Network tool, click Stop recording network log (
 ). It turns grey to indicate that DevTools is no longer recording requests.
Press Ctrl+E (Windows, Linux) or Command+E (macOS) while the Network tool is in focus.
Clear requests
To clear all requests from the Requests table, in the Network tool, click the Clear network log (![]() ) button:
) button:
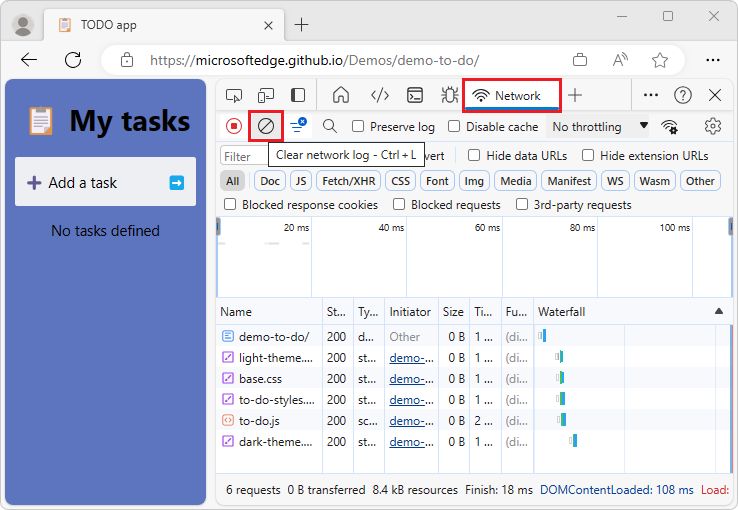
Or, press Ctrl+L (Windows, Linux, macOS) or Command+K (macOS) while the Network tool has focus.
See also:
Save requests across page loads
To save requests across page loads, on the Network tool, select the Preserve log checkbox:
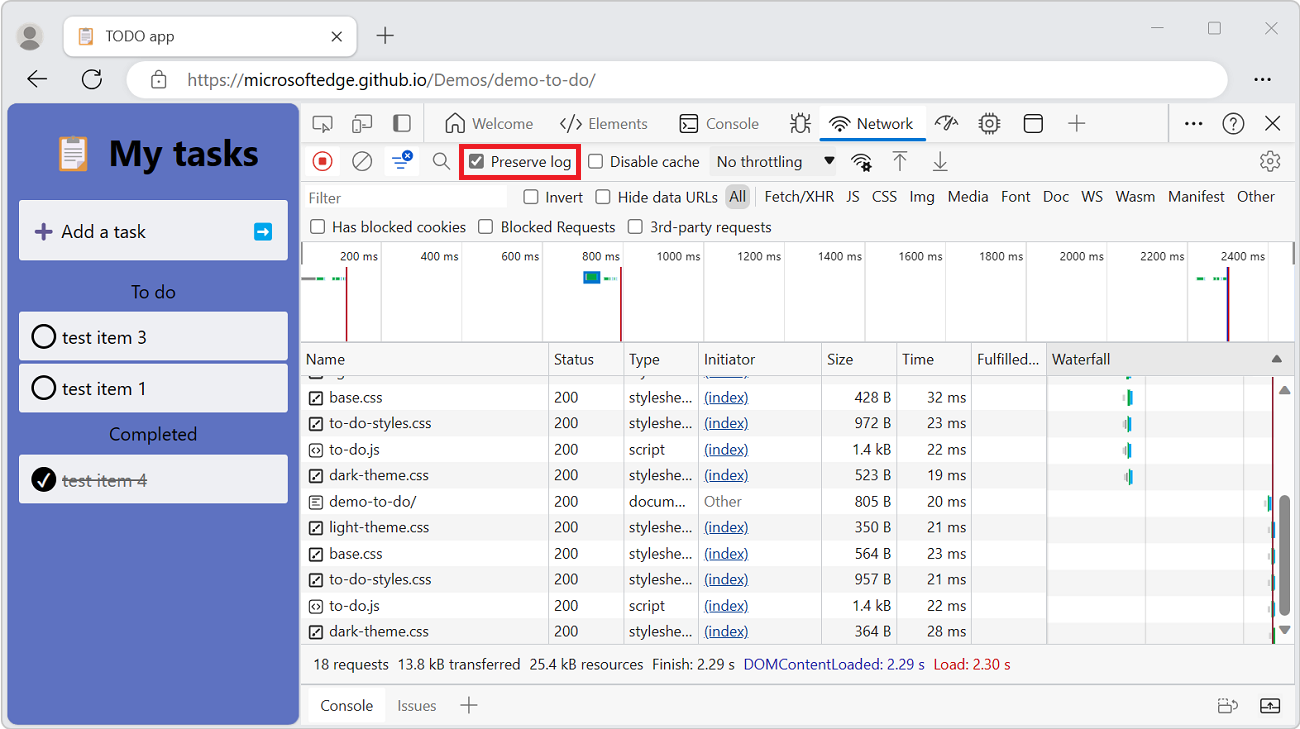
DevTools saves all requests until you disable Preserve log.
See also:
Capture screenshots during page load
You can capture screenshots to analyze what's displayed for users while waiting for your page to load.
To enable screenshots:
Go to a webpage, such as TODO app, in a new window or tab.
Right-click the webpage, and then select Inspect.
DevTools opens.
In DevTools, open the Network tool.
In the upper right within the Network tool, click the Network settings (gear) icon. A row of checkboxes appears.
Select the Capture screenshots checkbox:
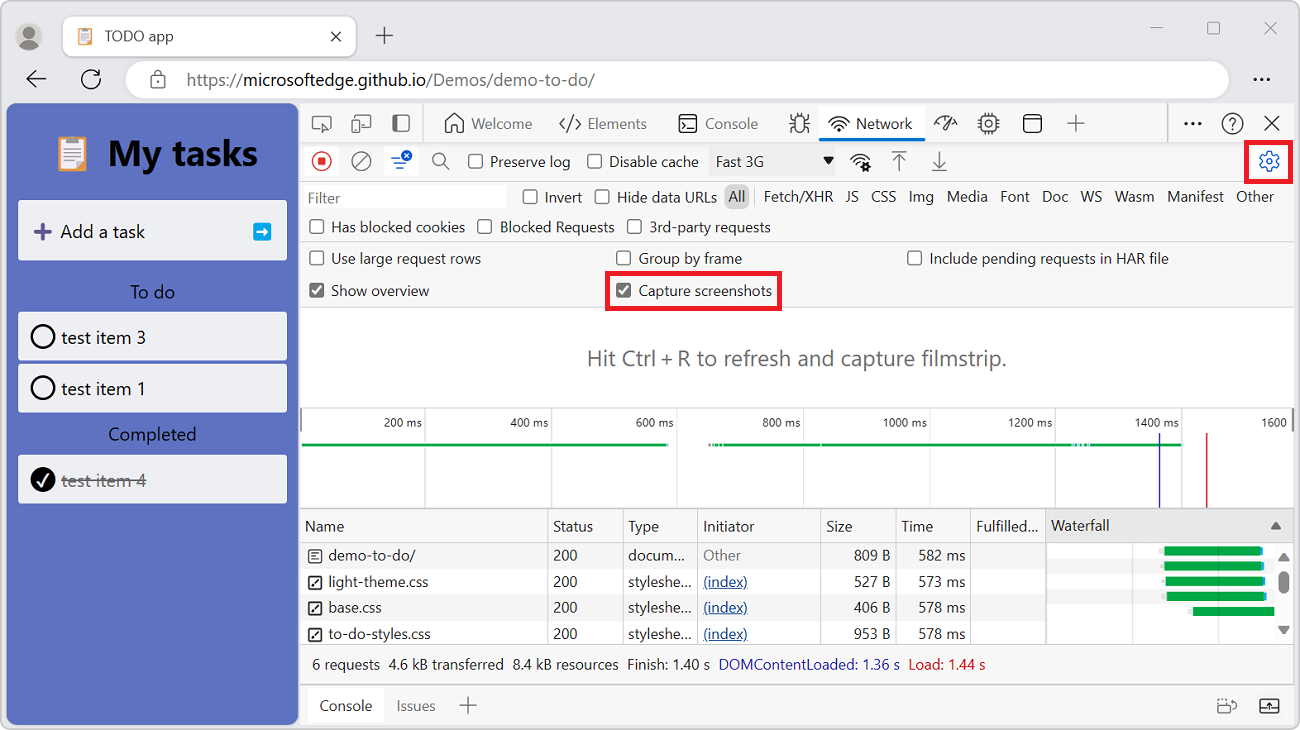
To capture a screenshot:
While the Network tool has focus, press Ctrl+F5 to refresh the page. Screenshots are captured during the page load and thumbnails are shown below the row of checkboxes.
You can interact with the screenshots as follows.
Hover over a screenshot to display the point at which that screenshot was captured. A yellow vertical line is displayed on the Overview chart pane.
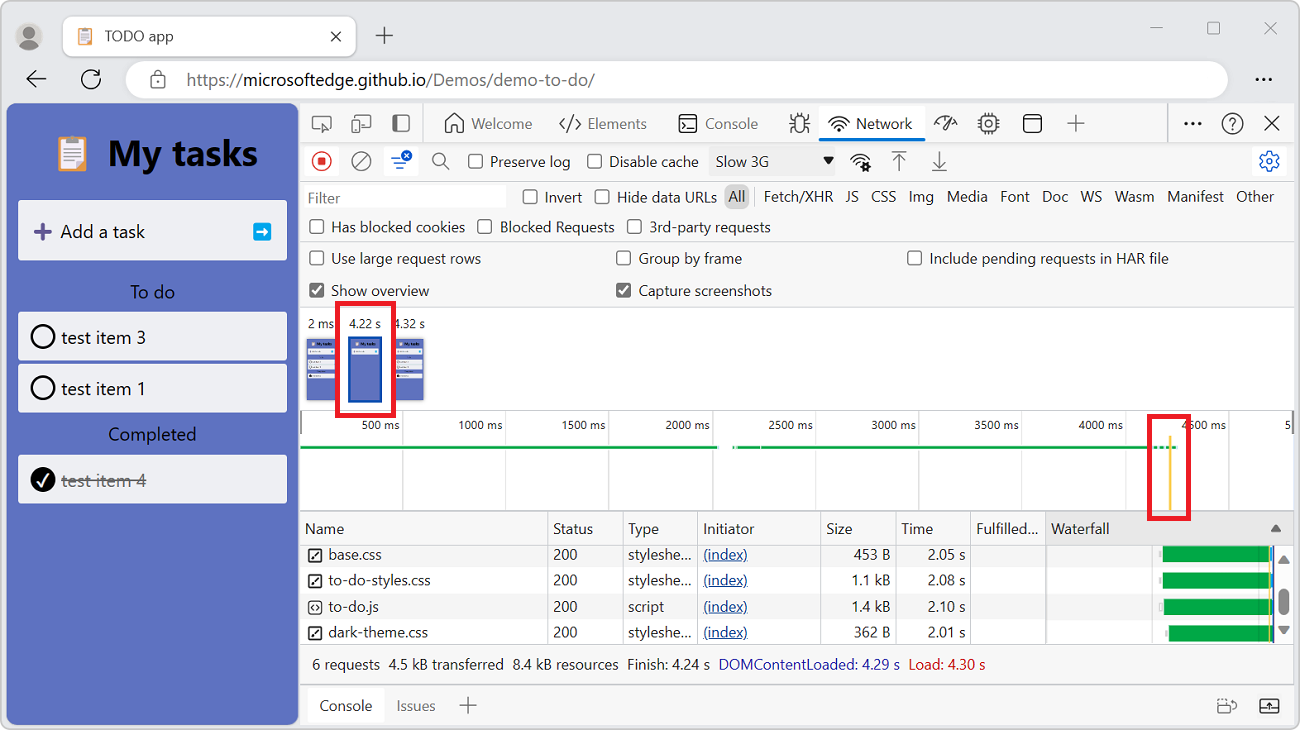
Click the thumbnail of a screenshot to filter out any requests that occurred after the screenshot was captured.
Double-click a screenshot thumbnail to zoom-in and view the screenshot.
Press Esc to close the screenshot viewer.
Replay XHR request
To replay an XHR request:
Go to a webpage, such as the Network tool reference Demo, in a new window or tab.
Right-click the webpage, and then select Inspect.
DevTools opens.
In DevTools, select the Network tool.
Refresh the webpage.
In the Network tool's Requests table, rows appear for:
devtools-network-reference/(index.html)style.cssscript.js
In the demo webpage, click the Send an XHR request button.
In the Network tool's Requests table, a
data.jsonrow is added. The Initiator column readsscript.js:20.In the Requests table, right-click the
data.jsonrequest, and then select Replay XHR.Or, select the request, and then press R.
In the Network tool's Requests table, a second
data.jsonrow is added. The Initiator column reads Other: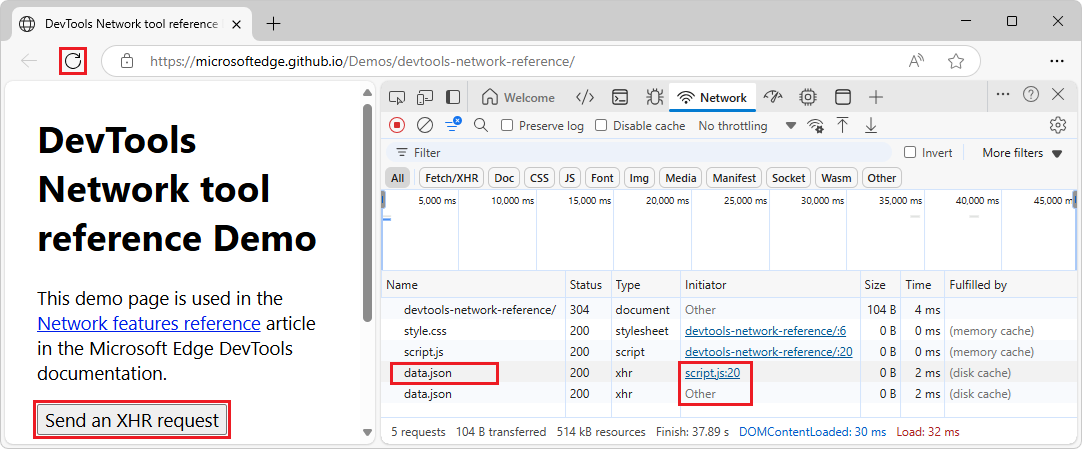
For information about initiators, see:
- Display initiators and dependencies, below.
- Log network activity in Inspect network activity.
After you click the demo's Send an XHR request button (which causes JavaScript to send a request), the Copy stack trace menuitem appears in the right-click > Copy menu for requests. See Copy network requests to the clipboard, below.
Change loading behavior
Emulate a first-time visitor by disabling the browser cache
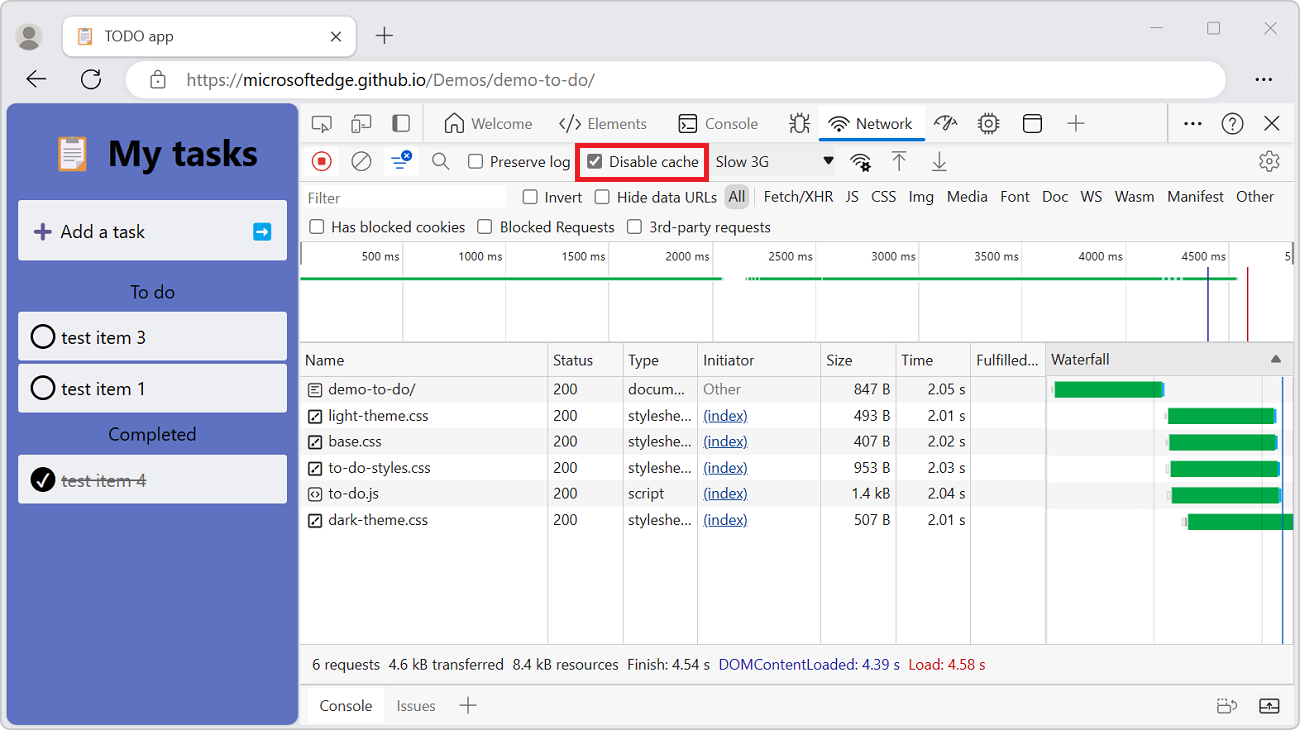
To emulate how a first-time user experiences your site, turn on the Disable cache checkbox. DevTools disables the browser cache. This feature more accurately emulates a first-time user's experience, because requests are served from the browser cache on repeat visits.
The Disable Cache checkbox:
Disable the browser cache from the Network conditions tool
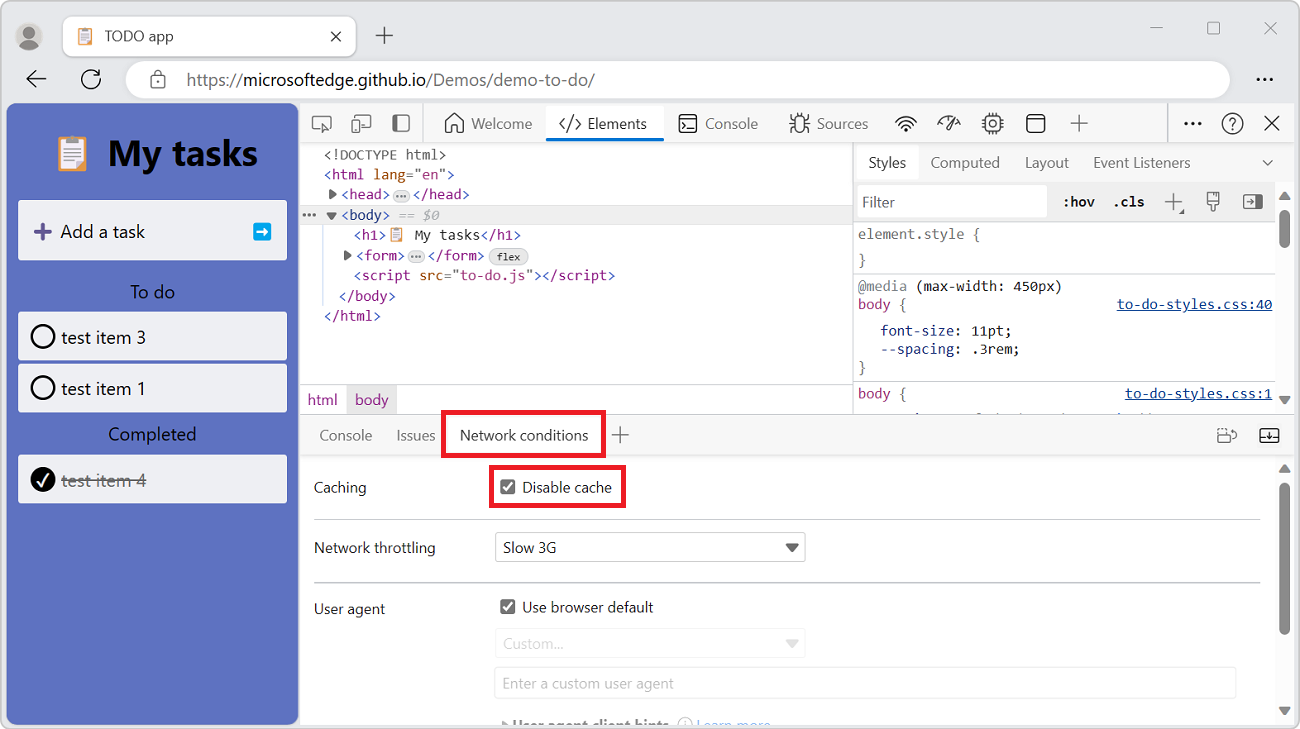
From the Network tool, you can open the Network conditions tool in the Quick View panel at the bottom of DevTools, and then disable the browser cache from there:
In the Network tool, click the More network conditions (
 button. The Network conditions tool opens in the Quick View panel at the bottom of DevTools.
In the Network conditions tool, select the Disable cache checkbox:
See also:
Manually clear the browser cache
To manually clear the browser cache at any time, right-click anywhere in the Requests table, and then select Clear browser cache:
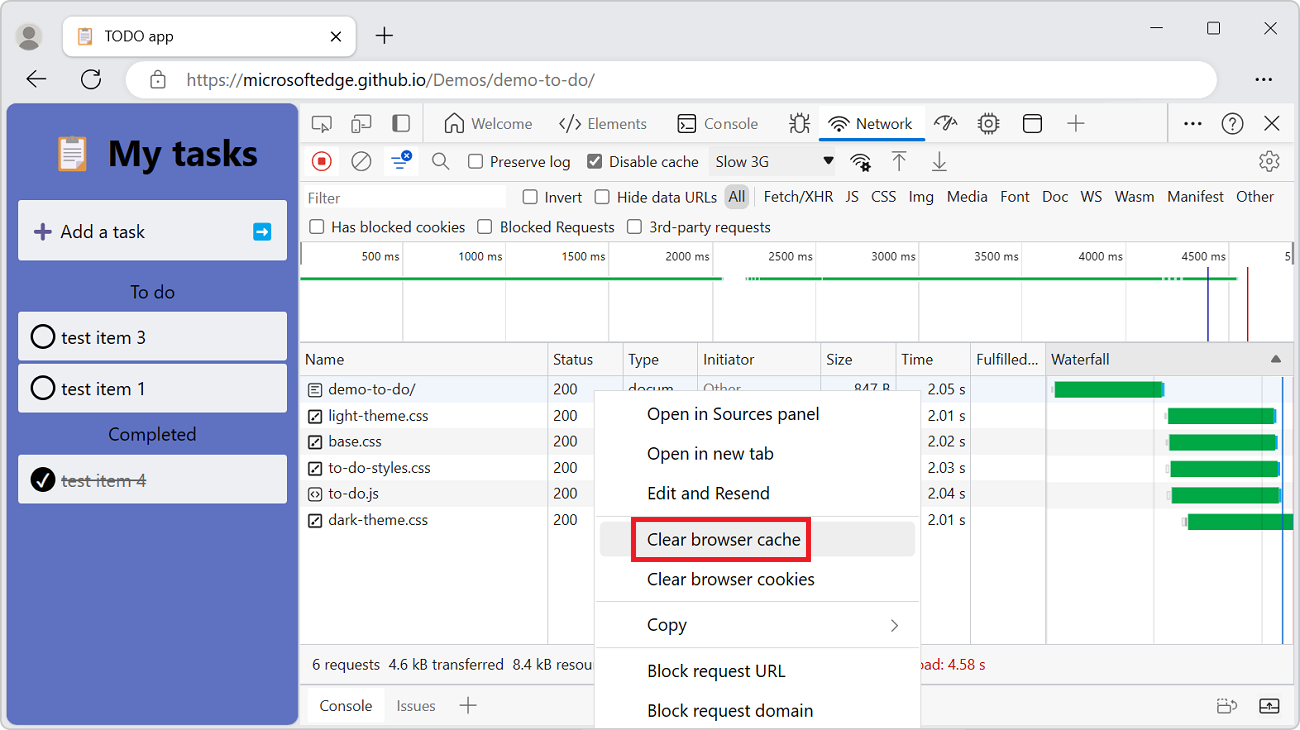
See also:
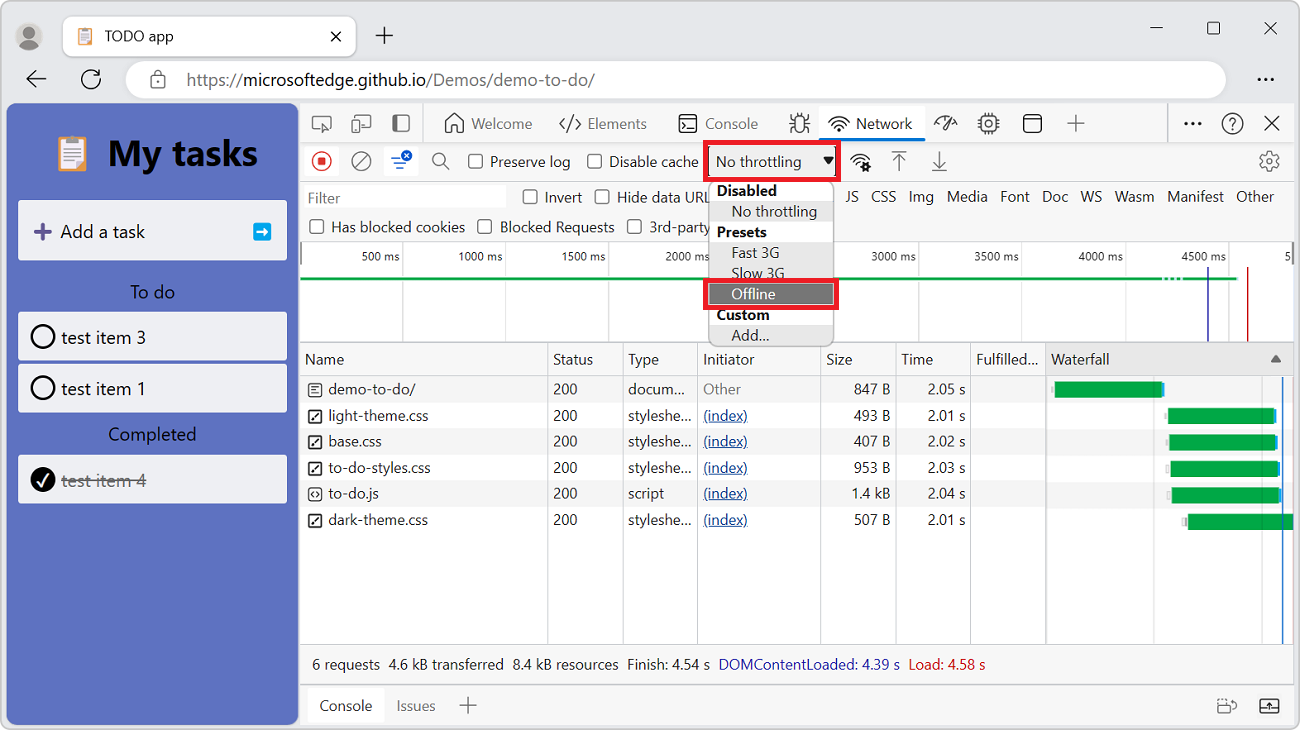
Emulate offline
A class of web apps, named Progressive Web Apps (PWA), are able to function offline with the help of service workers. You may find it useful to quickly simulate a device that has no data connection, when you are building this type of app.
To simulate an offline network experience, select the No throttling dropdown menu > Presets > Offline.
The Offline dropdown menu:
Emulate slow network connections
To emulate fast 4G, slow 4G, or 3G, select the corresponding preset from the Throttling dropdown menu in the action bar at the top:
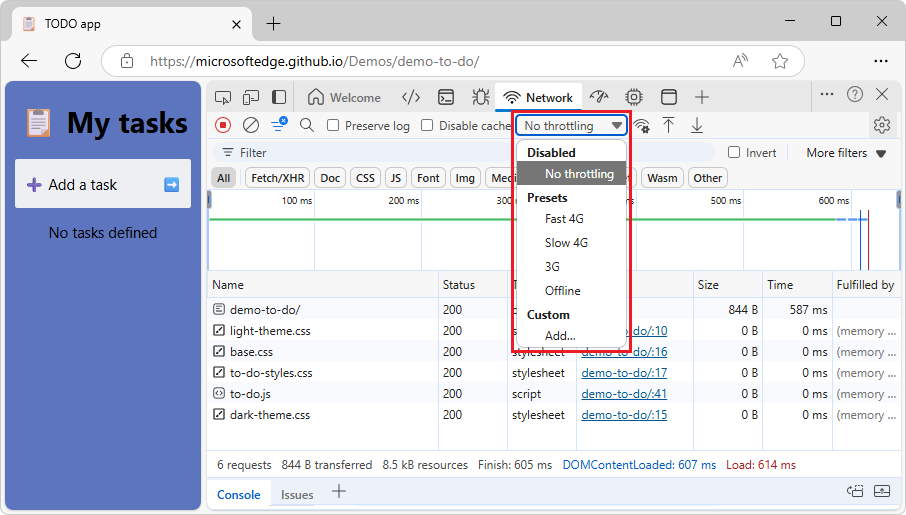
You can choose from different presets, such as:
- Fast 4G
- Slow 4G
- 3G
- Offline
To add your own custom presets, click the Throttling menu, and then select Custom > Add.
A warning icon is displayed on the Network tool's tab, to remind you that throttling is enabled:
![]()
See also:
- Simulate a slower network connection in Inspect network activity.
- TODO app
Create a custom throttling profile
In addition to presets, such as slow or fast 4G, you can also add your own custom throttling profiles.
To create a custom throttling profile:
Go to a webpage, such as the Inspect Network Activity demo page, in a new window or tab.
Right-click the webpage and then select Inspect.
DevTools opens.
Select the Network tool.
In the Throttling menu, in the Custom section, select Add.
Or, select Customize and control DevTools > Settings > Throttling.
The DevTools Settings page opens, with the Throttling page selected.
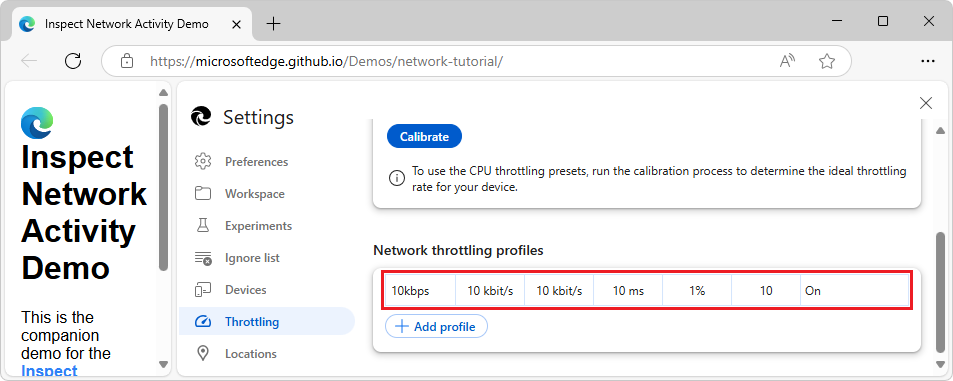
In the Network throttling profiles section, click the Add profile button.
Example values are shown below, and are used in the next section.
In the Profile Name text box, enter 10kbps.
In the Download text box, enter 10 (for 10 kbit/s).
In the Upload text box, enter 10 (for 10 kbit/s).
In the Latency text box, enter 10 (for 10 ms).
In the Packet Loss text box, enter 1 (for 1%).
In the Packet Queue Length text box, enter 10.
Select the Packet Reordering checkbox:
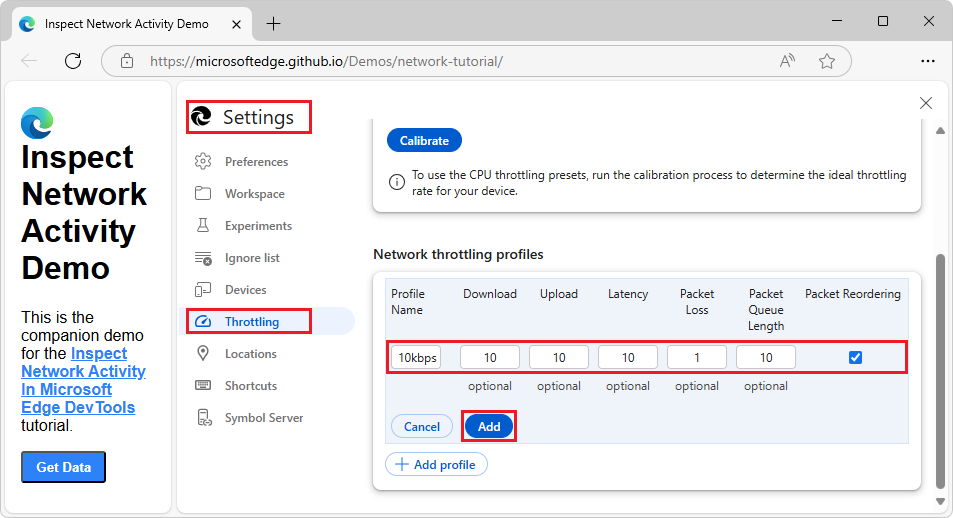
Click the Add button.
The custom throttling profile is displayed:
In the Settings pane, click the Close (X) button.
Select the Network tool.
In the Throttling dropdown menu, in the Custom section, select your custom throttling profile, such as 10kbps:
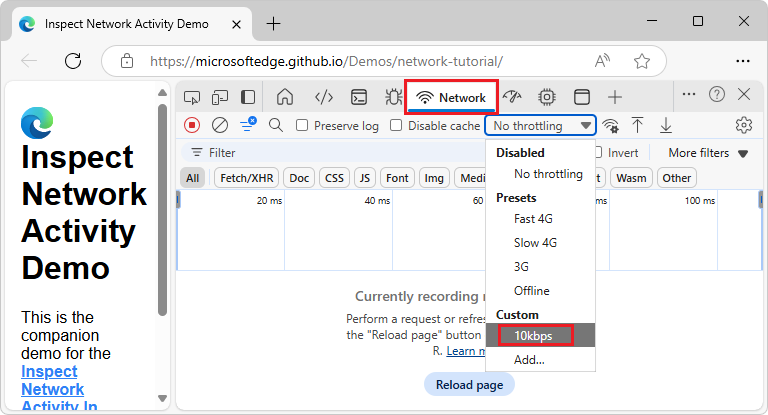
A warning (
 ) icon is displayed in the Network tab, to remind you that throttling is enabled.
See also:
- Set up custom network throttling profile in Throttling.
Throttle WebSocket connections
In addition to HTTP requests, DevTools can throttle WebSocket connections. We'll use the slow custom throttling profile that's created in the previous section, to show the effect of a throttled WebSocket connection on your webpage.
To observe WebSocket throttling:
Do the steps in the previous section, Create a custom throttling profile.
Go to a page that uses WebSockets, such as Online WebSocket Tester, in a new window or tab.
On the page, establish the WebSocket connection.
If you use the Online WebSocket Tester webpage, click the Connect button.
If you don't create a PieSocket account to get an API Token, the webpage displays "Connection Established - {"error":"Unknown api key"}".
If you create a PieSocket account to get an API Token, the webpage simply displays "Connection Established".
Right-click the webpage and then select Inspect.
DevTools opens.
In DevTools, in the Network tool, in the Throttling dropdown menu, select Custom > 10kbps.
That option was created in the previous section, Create a custom throttling profile.
In the Online WebSocket Tester webpage, in the message text box, delete DevTools no throttling, and enter DevTools with throttling.
In the Online WebSocket Tester webpage, click the Send button.
The console within the Online WebSocket Tester webpage displays DevTools with throttling.
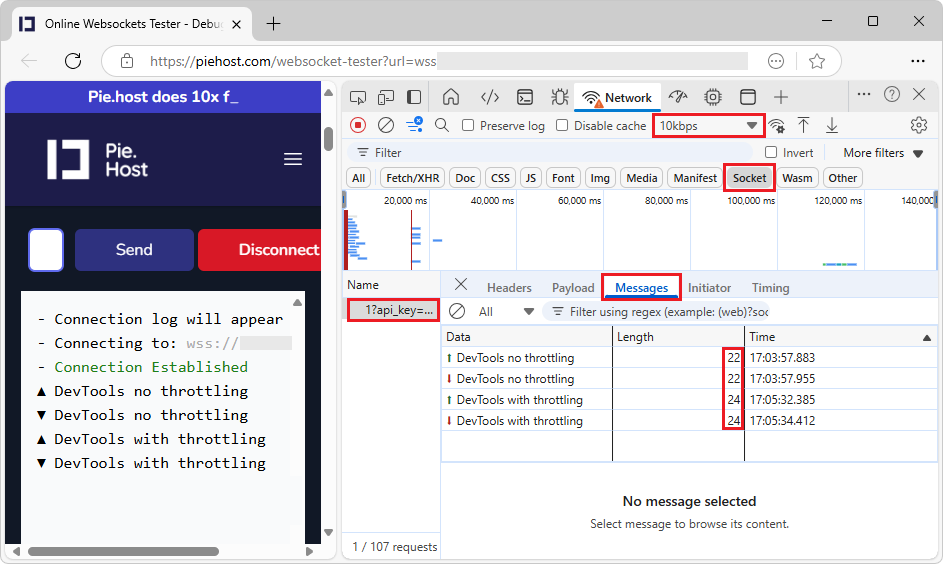
At the top of the Network tool, select the Socket filter button (shown below).
In the table, click your connection name, such as channel_123?api_key=....
Tabs appear.
Select the Messages tab (shown below).
The WebSocket messages that were sent between the client and server appear.
The Time column shows when messages were received or sent. These time values reflect the throttled network connection.
Emulate slow network connections from the Network Conditions tool
From the Network tool, you can open the Network conditions tool in the Quick View panel at the bottom of DevTools, and then throttle the network connection from there:
In the Network tool, click the More network conditions (
) button. The Network conditions tool opens in the Quick View panel at the bottom of DevTools.In the Network conditions tool, in the Network throttling menu, select a connection speed.
See also:
Manually clear browser cookies
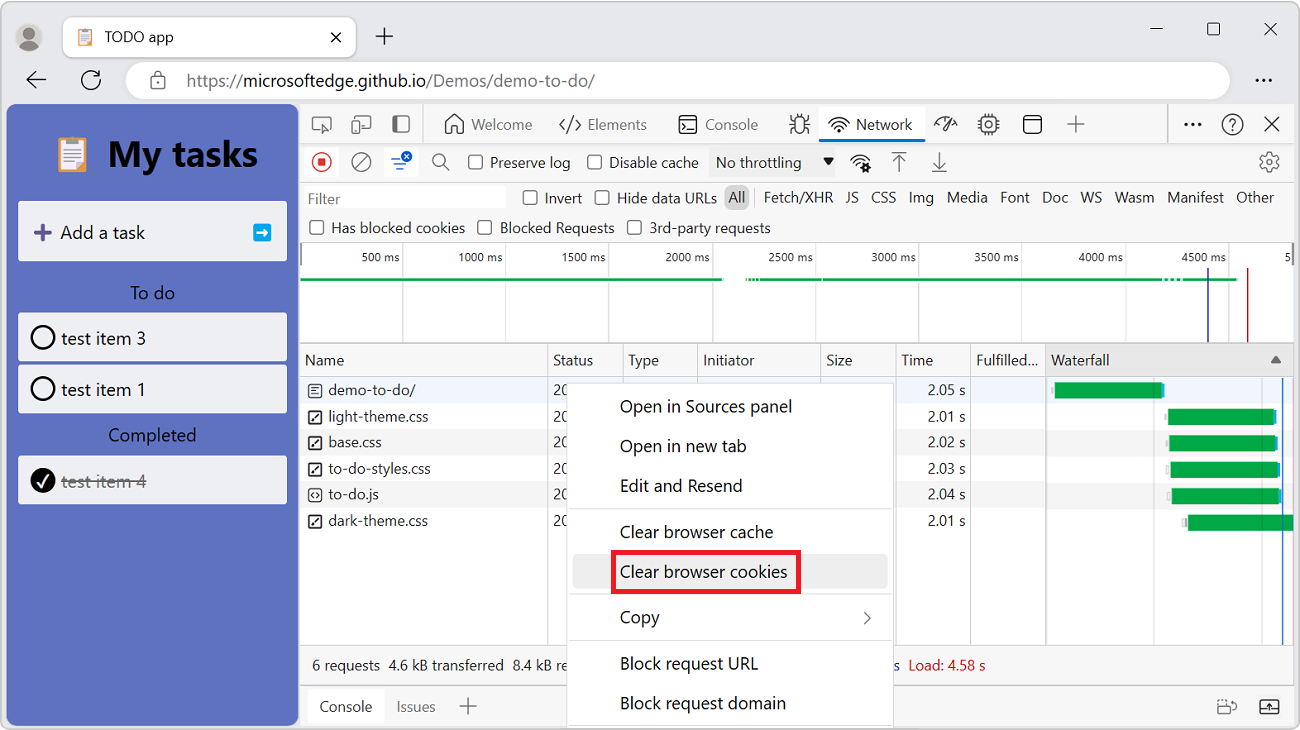
To manually clear browser cookies at any time, right-click anywhere in the Requests table, and then select Clear browser cookies.
Override HTTP response headers
See also:
- Override webpage resources with local copies (Overrides tab)
- Override files and HTTP response headers in Override web content and HTTP response headers locally.
Override the user agent
To manually override the user agent:
In the Network tool, click the More network conditions (
button. The Network conditions tool opens in the Quick View panel at the bottom of DevTools.In the Network conditions tool, clear the Use browser default checkbox. The other controls become available.
Select a user agent option from the menu, or enter a custom user agent in the text box.
Set user agent client hints
If your site employs user agent client hints and you want to test them, you can set them either in the Network conditions tool or in Emulate mobile devices (Device Emulation).
To set user agent client hints in the Network conditions tool:
In the Network tool, click the More network conditions (
button. The Network conditions tool opens in the Quick View panel at the bottom of DevTools.In the User agent section, clear the Use browser default checkbox, and then expand User agent client hints:
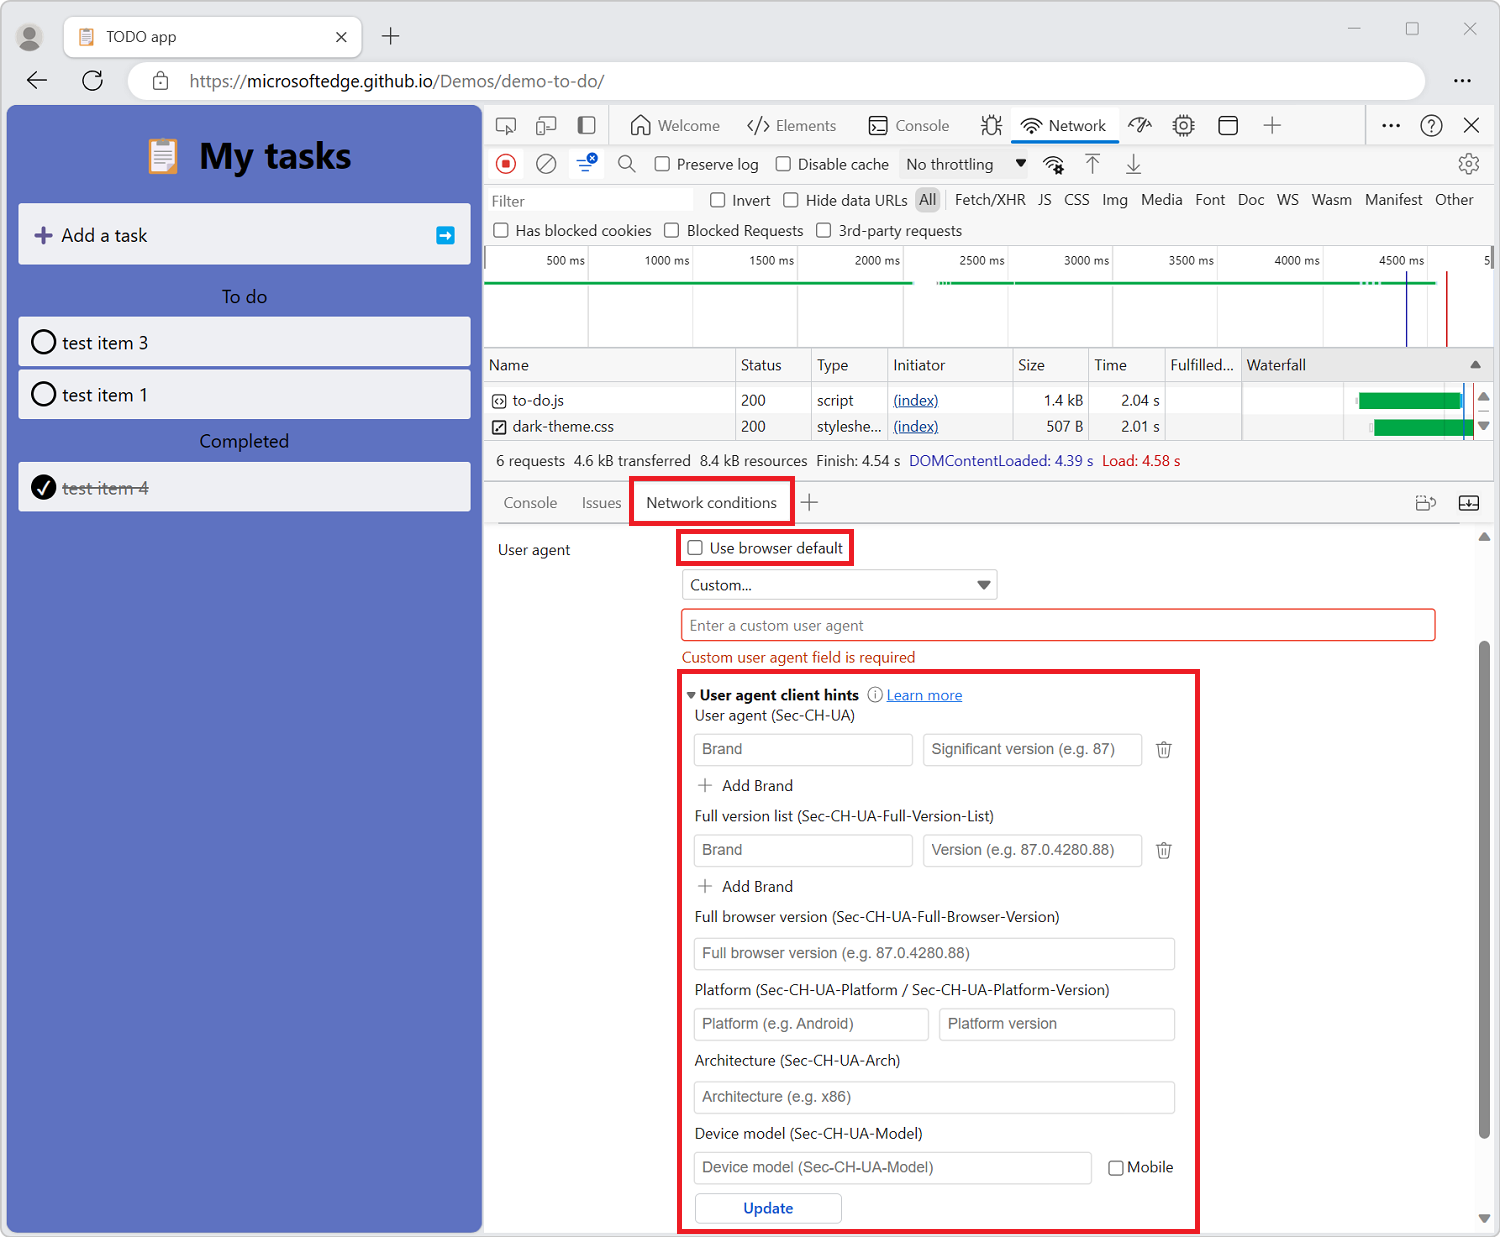
In the User agent dropdown list, select a predefined browser and device. Or, accept the default value of Custom..., and enter information in the Enter a custom user agent text box.
For either choice (predefined or custom), specify user agent client hints as follows:
- Brand and Version such as Edge and 92. To add multiple brand/version pairs, click + Add Brand.
- Full Browser Version such as 92.0.1111.0.
- Platform and Version such as Windows and 10.0.
- Architecture such as x86.
- Device model such as Galaxy Nexus.
You can set or change any of the user agent client hints; there are no required values.
Select Update.
To verify changes, click Console and type
navigator.userAgentData. Expand the results as needed to view changes to user agent data.
See also:
- User-Agent Client Hints in Detecting Microsoft Edge from your website.
Search requests
To search across request headers, payloads, and responses:
In the Network tool, click the Search (
 ) button. Or, press Ctrl+F (Windows, Linux) or Command+F (macOS).
The Search tab opens on the left side of the Network tool.
In the Find text box, enter your query string, and then press Enter.
Optionally click the Match case button to turn on case sensitivity. Optionally click the Regular expression button to turn on regular expressions.
Click one of the search results. The Network tool highlights in yellow the request that matched. The Network tool also opens the Headers or Response tab and highlights the string that matched there, if any.
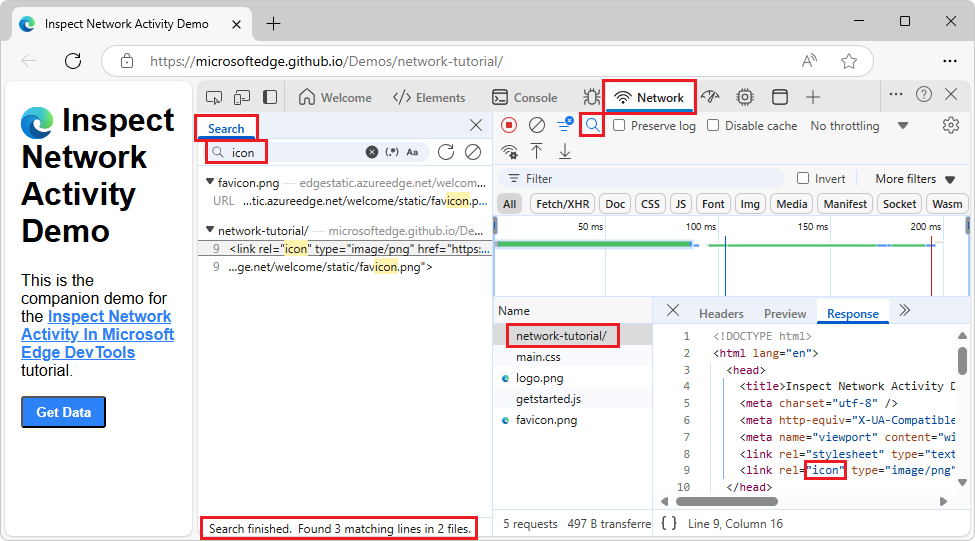
To refresh search results, in the Search tab, click the Refresh (![]() ) button.
) button.
To clear search results, in the Search tab, click the Clear search (![]() ) button.
) button.
For more information on all the ways you can search in DevTools, see Find source files for a page using the Search tool
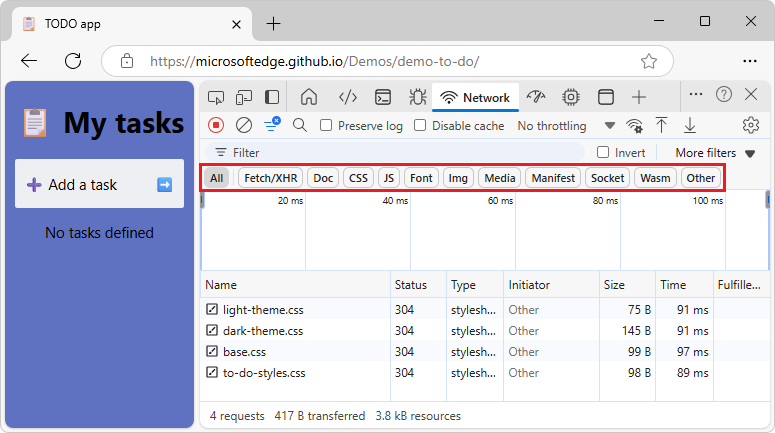
Filter requests
You can filter requests by properties, by type, or by time, and you can hide data URLs. The More filters dropdown list contains the following options and status checkmarks:
- Hide data URLs
- Hide extension URLs
- Blocked response cookies
- Blocked requests
- 3rd-party requests
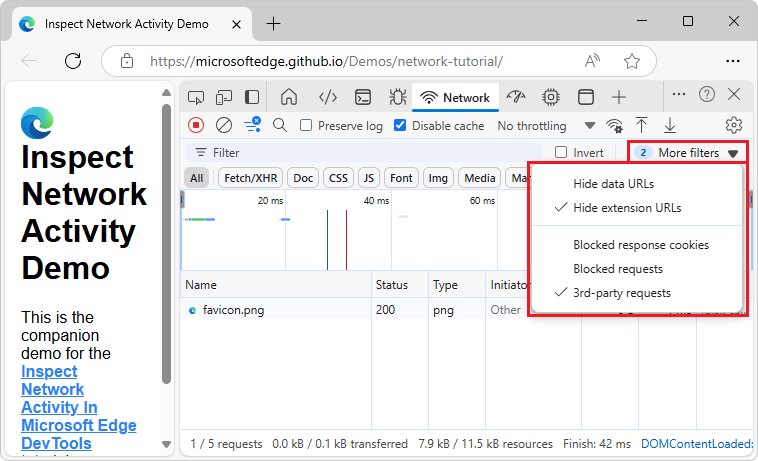
The dropdown list has a number on the left that tells you how many filters are selected within the dropdown list.
Filter requests by properties
Use the Filter text box to filter requests by properties, such as the domain or size of the request.
If the text box isn't displayed, the Filters pane is probably hidden; see Hide the Filters pane, below.
The Filter text box:
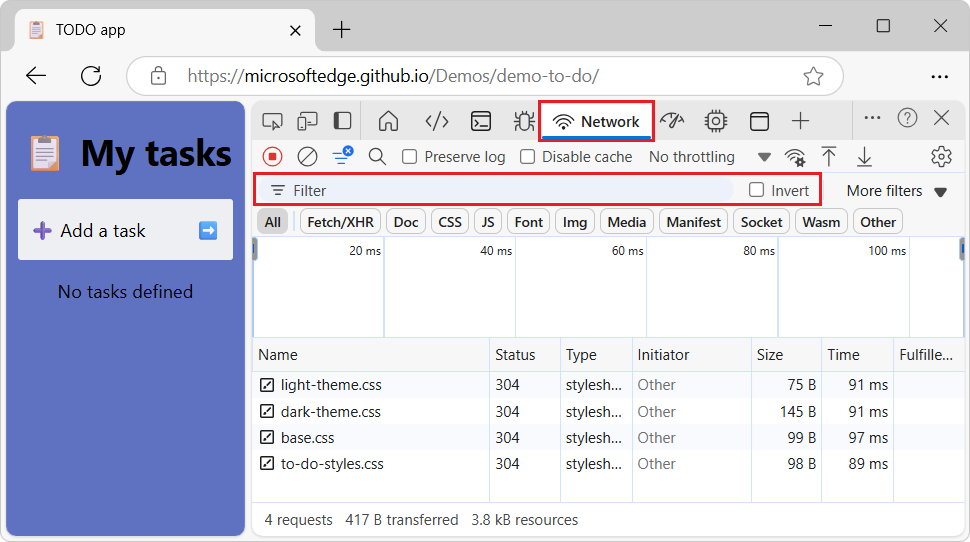
To invert your filter, select the Invert checkbox next to the Filter box.
You can use multiple properties simultaneously by separating each property with a space. For example, mime-type:image/png larger-than:1K displays all PNGs that are larger than 1 kilobyte. The multi-property filters are equivalent to AND operations. OR operations aren't supported.
The complete list of supported properties:
| Property | Details |
|---|---|
cookie-domain |
Show the resources that set a specific cookie domain. |
cookie-name |
Show the resources that set a specific cookie name. |
cookie-path |
Show the resources that set a specific cookie path. |
cookie-value |
Show the resources that set a specific cookie value. |
domain |
Only display resources from the specified domain. You can use a wildcard character (*) to include multiple domains. For example, *.com displays resources from all domain names ending in .com. DevTools populates the autocomplete dropdown menu with all of the domains that are found. |
has-overrides |
Show requests that have overridden content, headers, any overrides (yes), or no overrides (no). You can add the corresponding Has overrides column to the request table. |
has-response-header |
Displays the resources that contain the specified HTTP response header. DevTools populates the autocomplete dropdown menu with all of the response headers that are found. |
is |
Use is:running to find WebSocket resources. |
larger-than |
Displays resources that are larger than the specified size, in bytes. Setting a value of 1000 is equivalent to setting a value of 1k. |
method |
Displays resources that were retrieved over a specified HTTP method type. DevTools populates the dropdown menu with all of the HTTP methods that are found. |
mime-type |
Displays resources of a specified MIME type. DevTools populates the dropdown menu with all MIME types that are found. |
mixed-content |
Show all mixed content resources (mixed-content:all) or just the ones that are currently displayed (mixed-content:displayed). |
priority |
Show resources whose priority level matches the specified value. |
resource-type |
Show resources of a resource type, for example, image. DevTools populates the autocomplete drop-down with all resource types it has encountered. |
response-header-set-cookie |
Show raw Set-Cookie headers in the Issues tab. Malformed cookies with incorrect Set-Cookie headers will be flagged in the Network tool. |
scheme |
Displays resources retrieved over unprotected HTTP (scheme:http) or protected HTTPS (scheme:https). |
set-cookie-domain |
Displays resources that have a Set-Cookie header with a Domain attribute that matches the specified value. DevTools populates the autocomplete with all of the cookie domains that are found. |
set-cookie-name |
Displays resources that have a Set-Cookie header with a name that matches the specified value. DevTools populates the autocomplete with all of the cookie names that are found. |
set-cookie-value |
Displays resources that have a Set-Cookie header with a value that matches the specified value. DevTools populates the autocomplete with all of the cookie values that are found. |
status-code |
Displays resources that match the specific HTTP status code. DevTools populates the autocomplete dropdown menu with all of the status codes that are found. |
url |
Show the resources that have a url matching the specified value. |
Filter requests by type
To filter requests by request type, click the buttons on the Network tool: All, Fetch/XHR, Doc, CSS, JS, Font, Img, Media, Manifest, WS (WebSocket), Wasm (WebAssembly), or Other (any other type not listed here).
If the buttons don't appear, the Filters pane might be hidden. See Hide the Filters pane, below.
To enable multiple type filters simultaneously, press and hold Ctrl (Windows, Linux) or Command (macOS) and then click the filters.
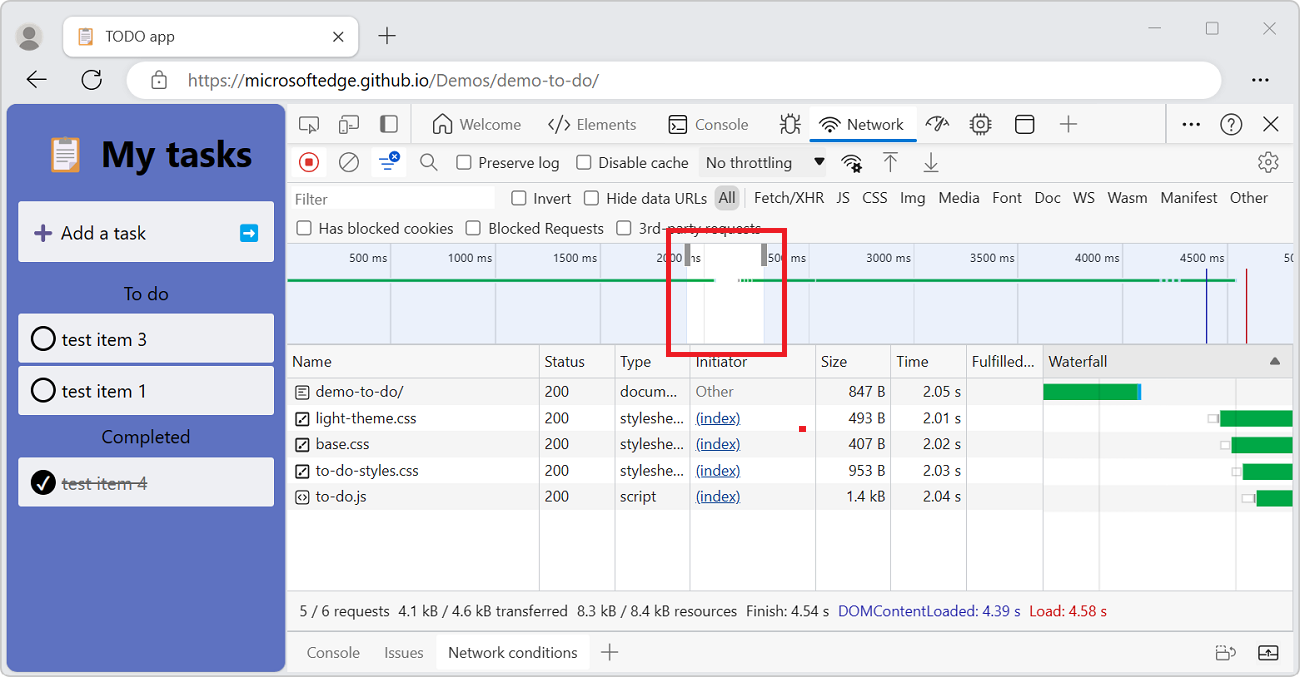
Filter requests by time
Click and drag left or right on the Overview pane to only display requests that were active during that time frame. The filter is inclusive. Any request that was active during the highlighted time is shown.
Filtering out any requests that were inactive around 300 ms:
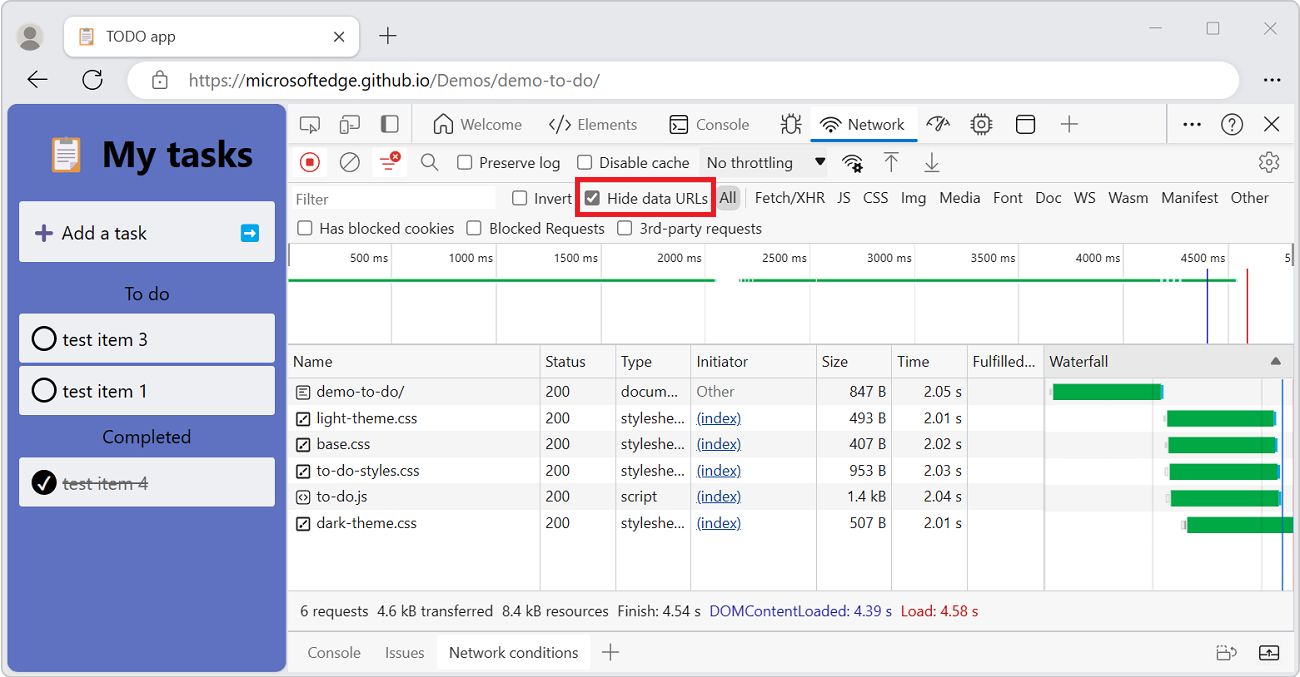
Hide data URLs
Data URLs are small files embedded into other documents. Any request that displays in the Requests table that starts with data: is a data URL.
To hide the requests, turn off the Hide data URLs checkbox:
Hide extension URLs
To focus on the code you author, you can filter out irrelevant requests sent by extensions you may have installed in Microsoft Edge. Extension requests have URLs that start with chrome-extension://.
To hide extension requests, in the Filters action bar, select the More filters dropdown menu, and then select Hide extension URLs so that a checkmark appears next to it:
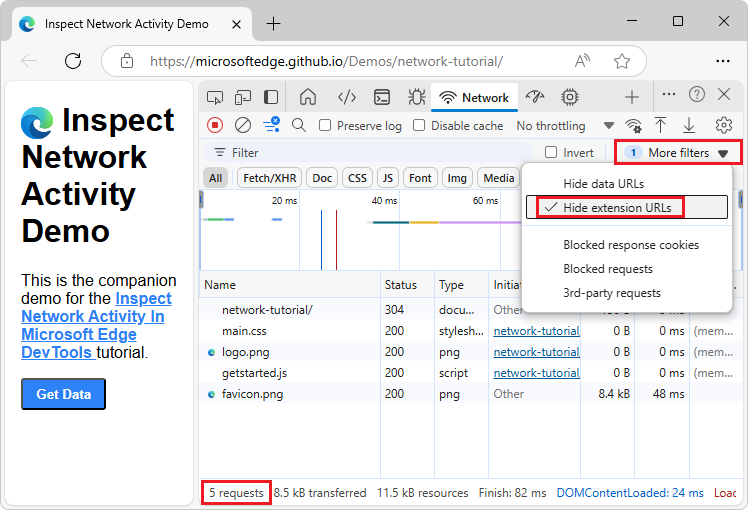
The status bar at the bottom displays the number of the shown requests out of the total, such as 5 / 10 requests.
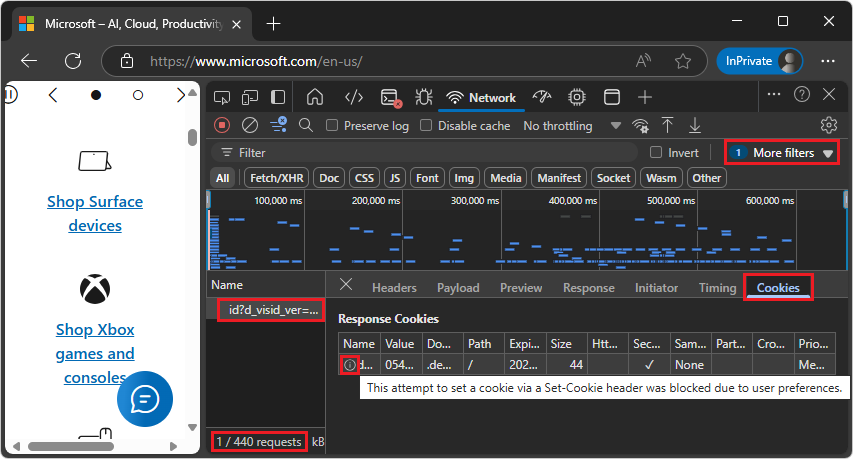
Show only the requests with blocked response cookies
To filter out everything except the requests with response cookies blocked for any reason, in the Filters action bar, select the More filters dropdown list, and then select Blocked response cookies so that a checkmark appears next to it.
Then, to find out why a response cookie was blocked, select the request (under Name), open its Cookies tab (to the right), and then hover over the information (![]() ) icon.
) icon.
For example:
In Microsoft Edge, select Settings and more > New InPrivate window.
In the Address bar, enter Microsoft.com.
Right-click the webpage, and then select Inspect.
DevTools opens.
Select the Network tool.
Make sure the All filter button is selected.
Refresh the webpage.
Many messages are listed in the Network tool.
In the Filters action bar, select the More filters dropdown list, and then select Blocked response cookies.
In the menu, a checkmark appears next to Blocked response cookies.
Click outside the dropdown list to close it.
Requests that have blocked response cookies are displayed, such as id?d_visid_ver=....
Select a request, such as id?d_visid_ver=....
The sidebar opens, with tabs.
Select the Cookies tab.
Hover over the info (
 ) icon.
The tooltip reads, for example: "This attempt to set a cookie via a Set-Cookie header was blocked due to user preferences."
The status bar at the bottom displays the number of the shown requests out of the total.
Additionally, the Network tool shows a warning icon (![]() ) next to a request with cookies blocked either because of Edge flags or configuration. Hover over the icon to see a tooltip with a clue and click it to go to the Issues tool for more information.
) next to a request with cookies blocked either because of Edge flags or configuration. Hover over the icon to see a tooltip with a clue and click it to go to the Issues tool for more information.
Show only blocked requests
To filter out everything except blocked requests, in the Filters action bar, select More filters > Blocked requests, so that a checkmark appears. To test this, you can use the Network request blocking tool in the Quick View panel at the bottom of DevTools; see Block requests in Inspect network activity.
For example:
Go to a webpage, such as the Inspect Network Activity demo page, in a new window or tab.
Right-click the webpage, and then select Inspect.
DevTools opens.
In DevTools, select the Network tool.
Refresh the webpage.
The Requests table lists
.html,.css,.png, and.jsfiles.In the More filters dropdown list (with tooltip of Show only/hide requests), select Blocked requests.
In the dropdown list, a checkmark is displayed next to Blocked requests.
Click outside of the dropdown list, to close it.
The Requests table is empty, because DevTools is not blocking any requests, and requests are now filtered to only show blocked requests.
Press Esc once or twice, so that the Quick View panel is open at the bottom of DevTools.
In the Quick View toolbar, click the More tools (
 ) button, and then select Network request blocking.
The Network request blocking tool opens in the Quick view panel.
In the Network request blocking tool, click the Add network request blocking pattern (
 ) button.
In the Text pattern to block matching requests text box, enter *.png, and then click the Add button.
*.png is listed, with a checkmark.
In the Network tool, the Requests table is still empty, because no requests have been actively blocked yet.
Refresh the webpage.
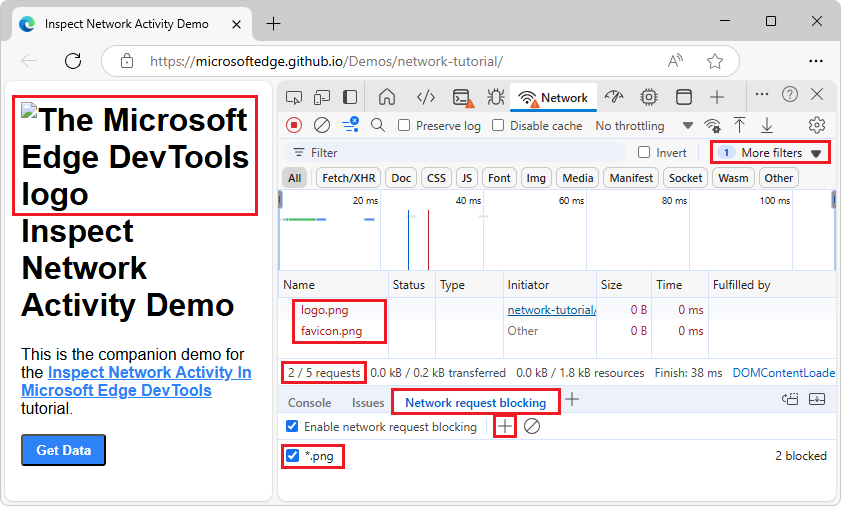
In the demo webpage, instead of an Edge logo next to the heading, a broken-image icon is shown, along with the image's alt-text (The Microsoft Edge DevTools logo).
In the Network tool, the Requests table lists
.pngfiles, only. The Requests table highlights blocked requests as red text.In the Network tool, the status bar at the bottom displays the number of the shown requests out of the total, such as 2 / 5 requests.
Show only third-party requests
To filter out everything except the requests with origin that differs from page origin, in the Filters action bar, select More filters > 3rd-party requests, so that a checkmark appears. Try it on the Inspect Network Activity demo page.
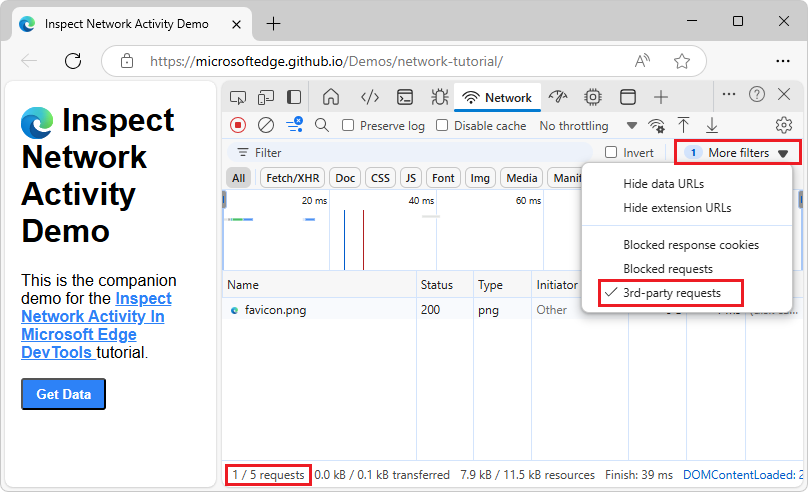
The status bar at the bottom displays the number of the shown requests out of the total.
Sort requests
By default, the requests in the Requests table are sorted by initiation time, but you can sort the table using other criteria.
Sort by column
Click the header of any column in the Requests to sort requests by that column.
Sort by activity phase
The Waterfall column is off by default. To turn on the Waterfall column: right-click a Requests table header, and then select the plain Waterfall menuitem that doesn't have a submenu.
To change how the Waterfall column sorts requests:
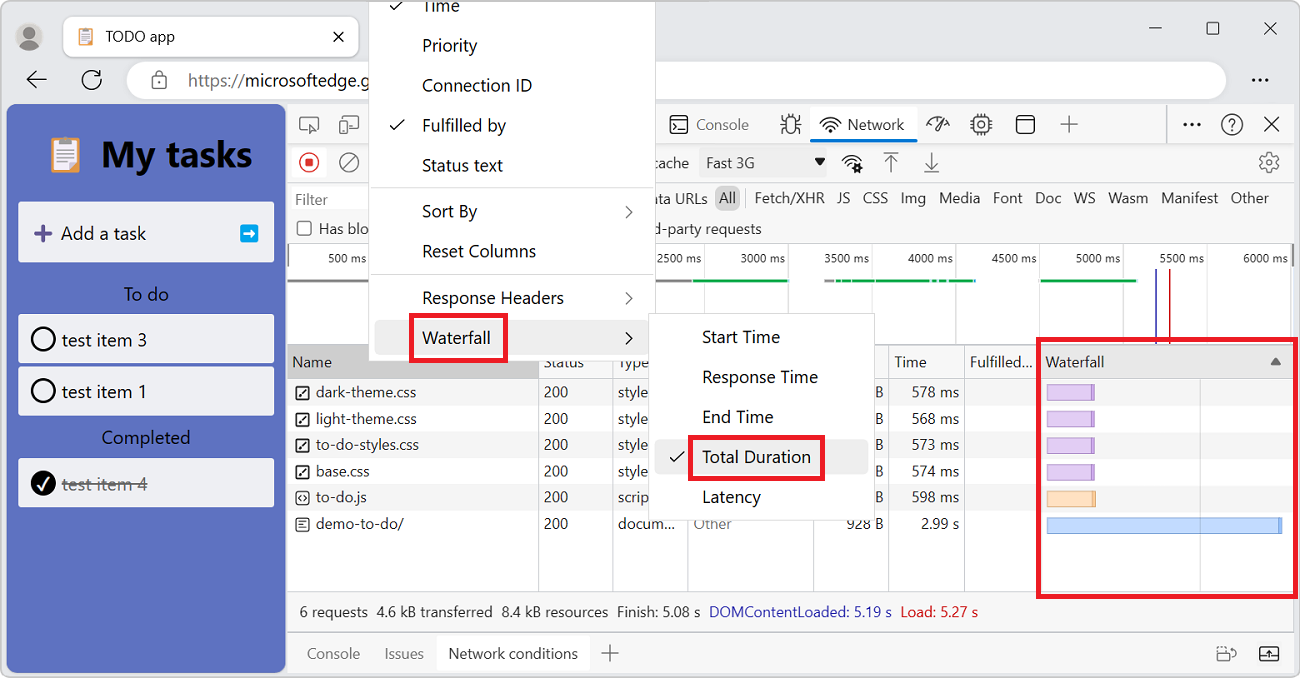
Right-click the header of the Requests table, click Waterfall, and then select one of the following options:
Start Time - The first request that was initiated is placed at the top.
Response Time - The first request that started downloading is placed at the top.
End Time - The first request that finished is placed at the top.
Total Duration - The request with the shortest connection settings and request or response is placed at the top.
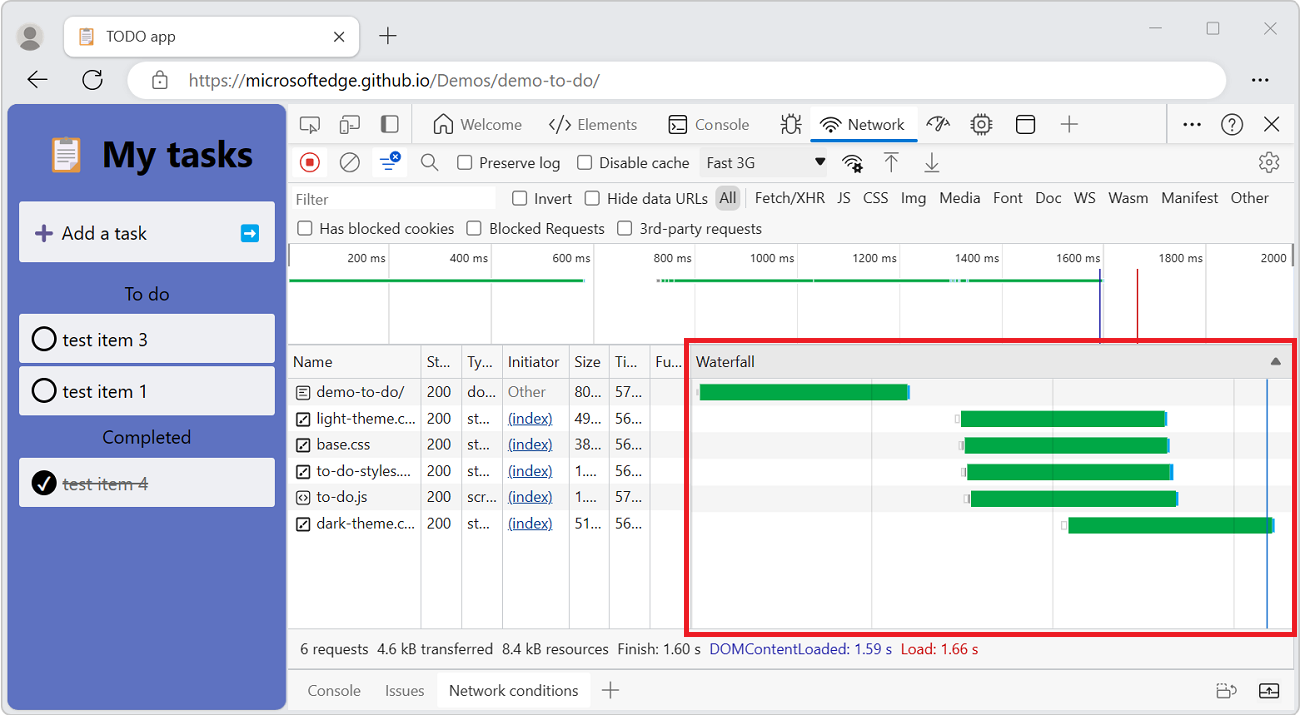
Latency - The request that waited the shortest time for a response is placed at the top.
These descriptions assume that each respective option is ranked from shortest to longest. Click the header of the Waterfall column to reverse the order.
The following shows sorting the Waterfall by total duration. The lighter portion of each bar is time spent waiting and the darker portion is time spent downloading bytes:
Analyze requests
So long as DevTools is open, it logs all requests in the Network tool. Use the Network tool to analyze requests.
Display a log of requests
Use the Requests table to display a log of all requests made while DevTools has been open. To reveal more information about each item, click or hover on requests.
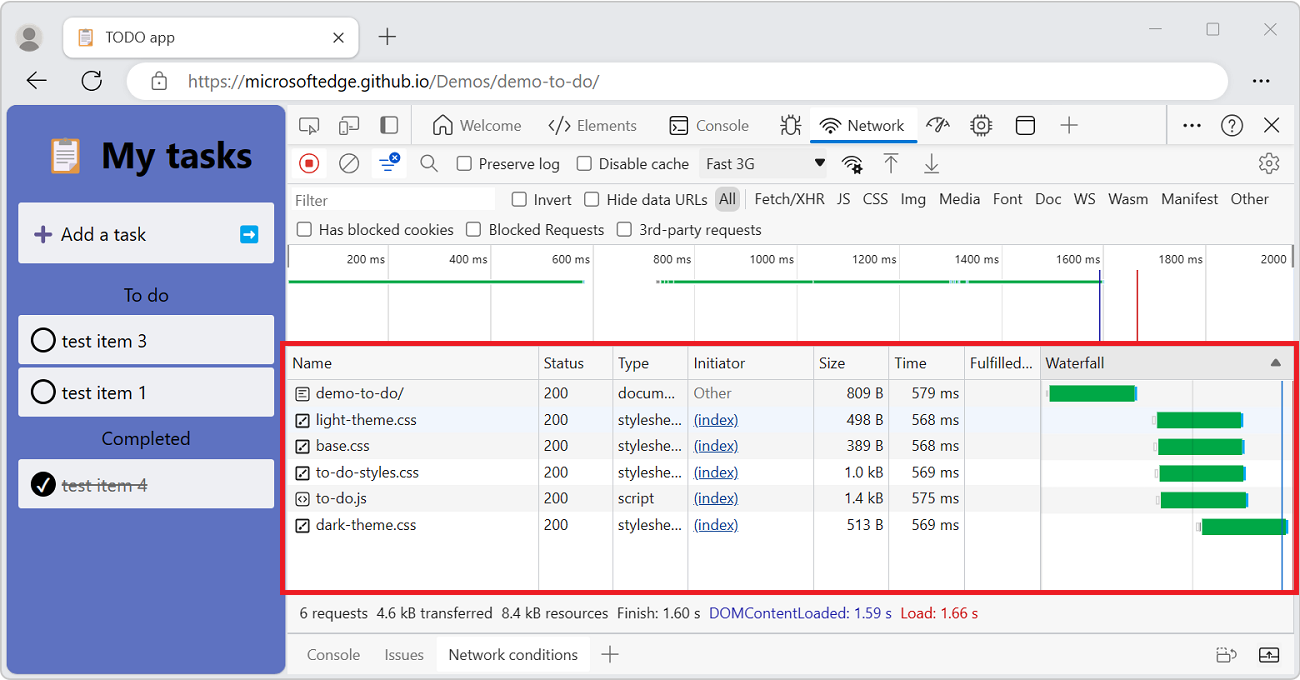
The Requests table displays the following columns by default:
- Name. The file name of the resource, or an identifier for the resource.
- Status. The HTTP status code.
- Type. The MIME type of the requested resource.
- Initiator. The following objects or processes can initiate requests:
- Parser. The HTML parser.
- Redirect. An HTTP redirect.
- Script. A JavaScript function.
- Other. Some other process or action, such as navigating to a page via a link or entering a URL in the Address bar.
- Size. The combined size of the response headers plus the response body, as delivered by the server.
- Time. The total duration, from the start of the request to the receipt of the final byte in the response.
- Fulfilled by. Whether the request was fulfilled by the HTTP cache or the app's service worker.
The Waterfall column is off by default. To turn on the The Waterfall column, right-click a Requests table header, and then select the plain Waterfall menuitem that doesn't have a submenu.
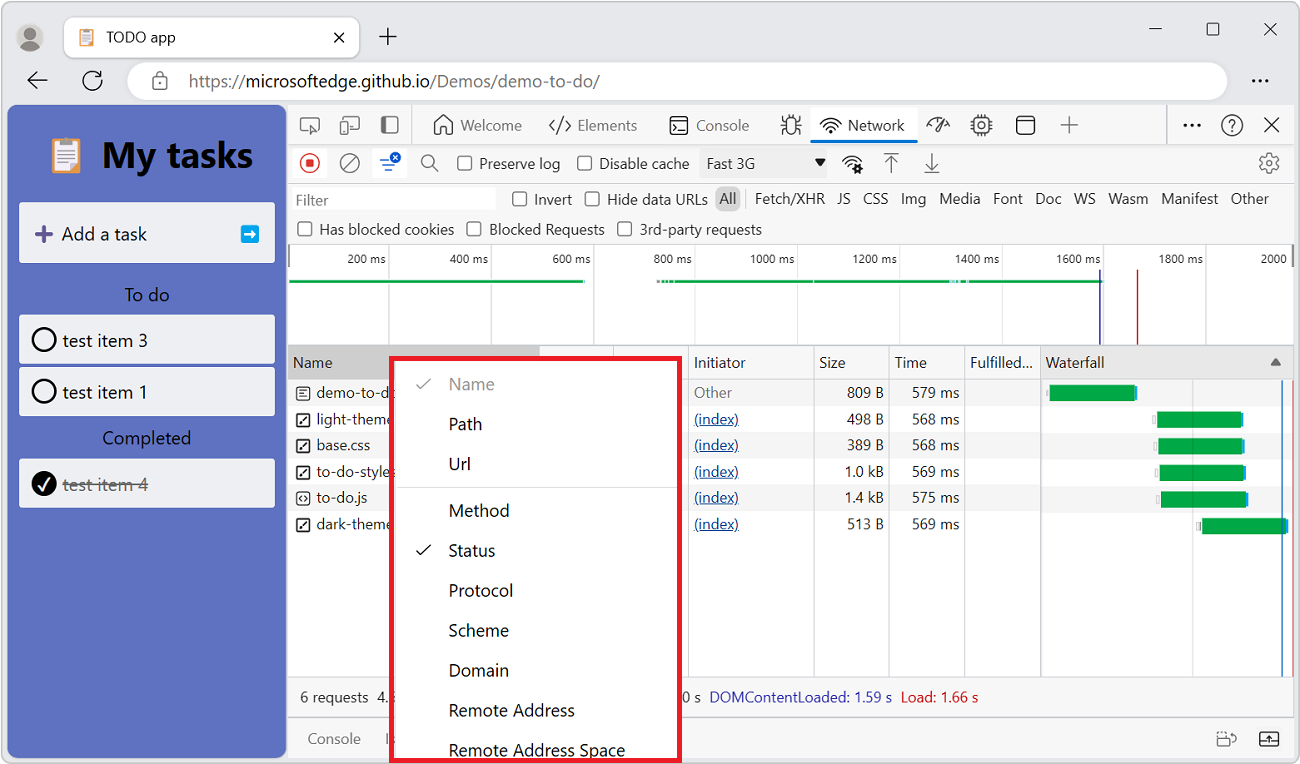
Add or remove columns
Right-click the header of the Requests table and select a column name to hide or show it. The currently displayed columns have checkmarks next to them.
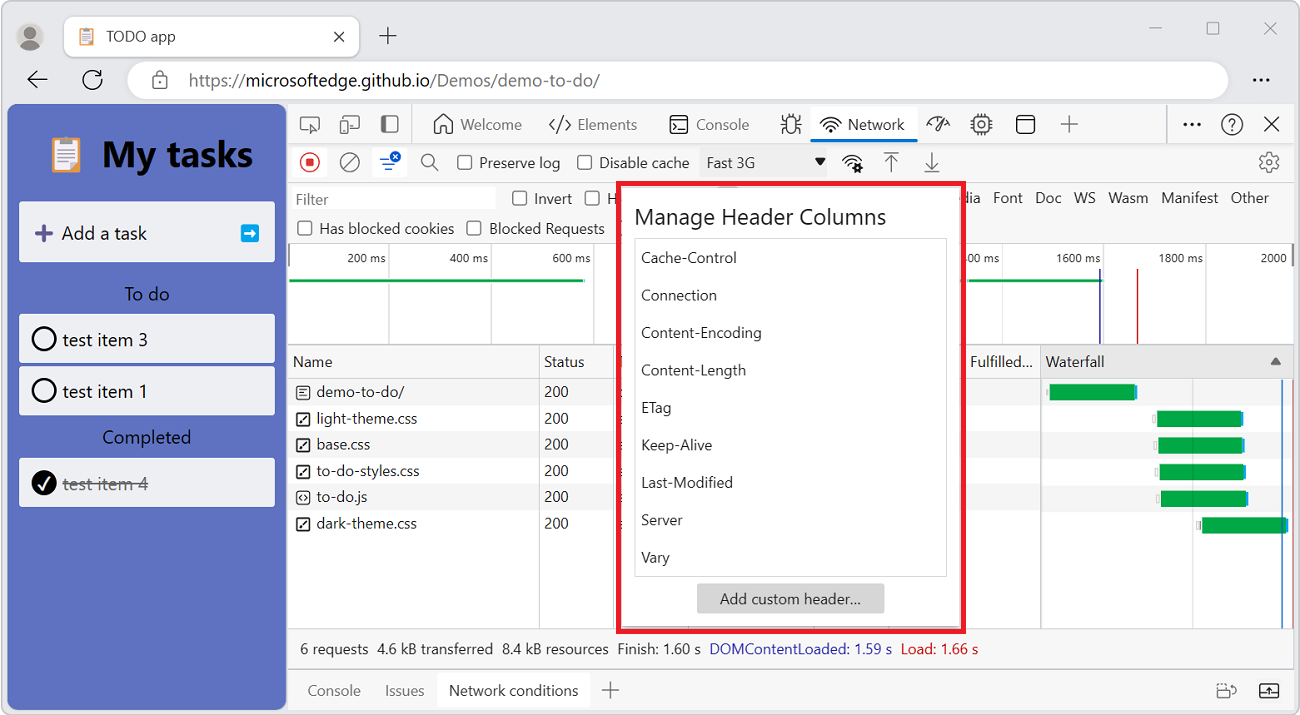
Add custom columns for response headers
To add a custom column to the Requests table:
Right-click the header of the Requests table and then select Response Headers > Manage Header Columns.
The Manage Header Columns popup window opens.
Click the Add custom header button, enter the custom header name, and then click Add.
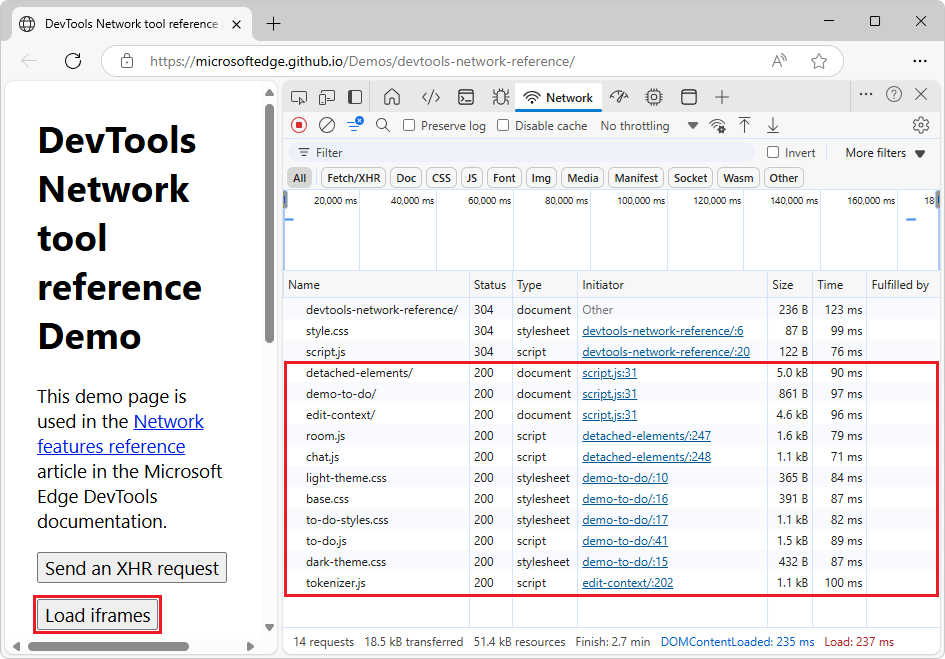
Group requests by inline frames
If inline frames on a page initiate a lot of requests, you can make the request log friendlier by grouping them.
To group requests by iframes:
Go to a webpage, such as the Network tool reference Demo, in a new window or tab.
Right-click the webpage, and then select Inspect.
DevTools opens.
In DevTools, select the Network tool.
Refresh the webpage.
In the Network tool's Requests table, rows appear for:
devtools-network-reference/(index.html)style.cssscript.js
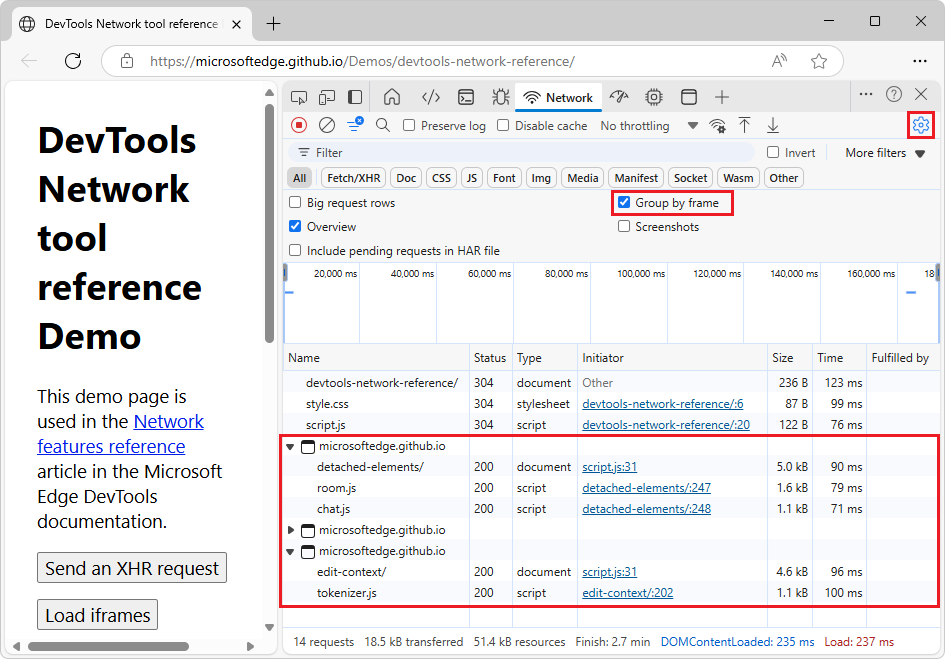
In the demo webpage, click the Load iframes button.
Many rows are added in the Requests table:
In the Network tool, click the Network settings (
 ) button, and then select the Group by frame checkbox.
In the Requests table, expandable frame names are displayed.
In the Requests table, click an expander triangle on a frame.
The requests that were initiated by the inline frame are displayed:
Display the timing relationship of requests
Use the Waterfall column of the Requests pane to view the timing relationships of requests. The default organization of the Waterfall column uses the start time of the requests. So, requests that are farther to the left started earlier than the requests that are farther to the right.
The Waterfall column is off by default. To turn on the The Waterfall column, right-click a Requests table header, and then select the plain Waterfall menuitem that doesn't have a submenu.
To see the different ways that you can sort the Waterfall, see Sort by activity phase, above.
The Waterfall column of the Requests pane:
Analyze the messages of a WebSocket connection
To view the messages of a WebSocket connection:
Go to a webpage, such as the Online Websocket Tester.
Right-click the webpage, and then select Inspect.
DevTools opens.
Select the Network tool.
The All filter button is selected by default. The Network panel is empty, displaying no messages.
Refresh the webpage.
In the Network tool's Requests table, many requests are listed.
At the top of the Network tool, select the Socket filter button, with tooltip: WebSocket | Web Transport | DirectSocket.
The filtered list of requests is empty.
In the Online Websocket Tester webpage, click the Connect button.
If you haven't set up an account and API Token, the page displays:
- Connection Established
- {"error":"Unknown api key"} with a triangle pointing down; sent from the server to the browser.
In the Network tool, in the Messages tab, the request is displayed:
- channel_123?api_key=...
In the list of requests, select the WebSocket connection, such as channel_123?api_key=....
The sidebar opens, with tabs.
Select the Messages tab.
If you didn't register for an API Token, the Messages tab lists the message:
- {"error":"Unknown api key"} with a red down-arrow; sent from the server to the browser.
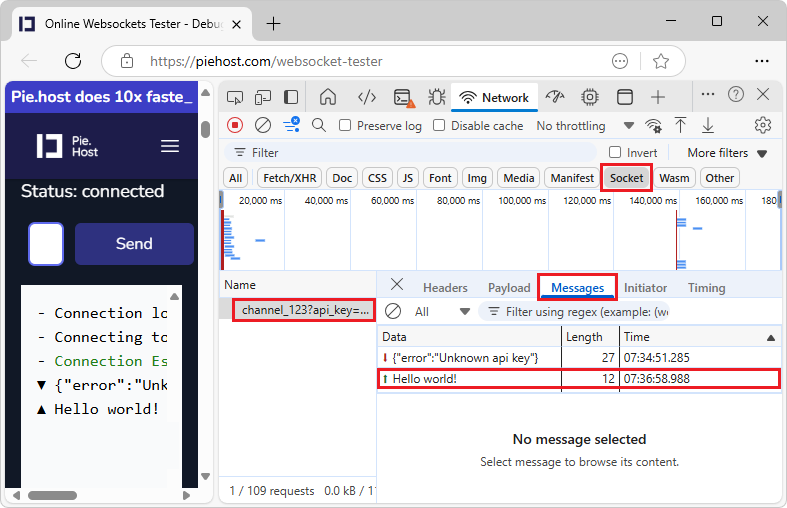
In the Online Websocket Tester webpage, in the text box, change Hello PieSocket! to Hello world!, and then click the Send button.
In the webpage, the console shows the message Hello world! with a triangle pointing up; sent from the browser to the server.
In the Network tool, in the Messages tab, the table shows the last 100 messages; in this case, the message is added:
- Hello world! with a green up-arrow; sent from the browser to the server:
Note: To get red down-arrow messages (echoed from the server), as well as green up-arrow messages, you would need to:
Create an account at the PieSocket site. This creates an API Token.
Create a cluster at the PieSocket site.
In the PieSocket dashboard page, click the Test online button.
The Online WebSocket Tester page opens, with your query parameters.
Click the Connect button.
To refresh the Requests table, in the Name pane, click the name of the WebSocket connection again.
The Requests table contains the following three columns:
Data. The message payload. If the message is plain text, it is displayed here. For binary opcodes, this column displays the name and code of the opcode. The following opcodes are supported:
- Continuation Frame
- Binary Frame
- Connection Close Frame
- Ping Frame
- Pong Frame
Length. The length of the message payload, in bytes.
Time. The time when the message was received or sent.
Analyze events in a stream
To view the events that servers stream through the Fetch API, the EventSource API, and XHR:
Go to a webpage that streams events, such as the Network tool reference Demo, in a new window or tab.
Right-click the webpage, and then select Inspect.
DevTools opens.
In DevTools, select the Network tool.
Refresh the webpage.
In the Network tool's Requests table, rows appear for:
devtools-network-reference/(index.html)style.cssscript.js
In the demo webpage, click the Stream server-sent events button.
In the Requests table, an
sse(server-sent event) row is added.Select the
sse(server-sent event) request.The sidebar opens, including an EventStream tab.
Select the EventStream tab:
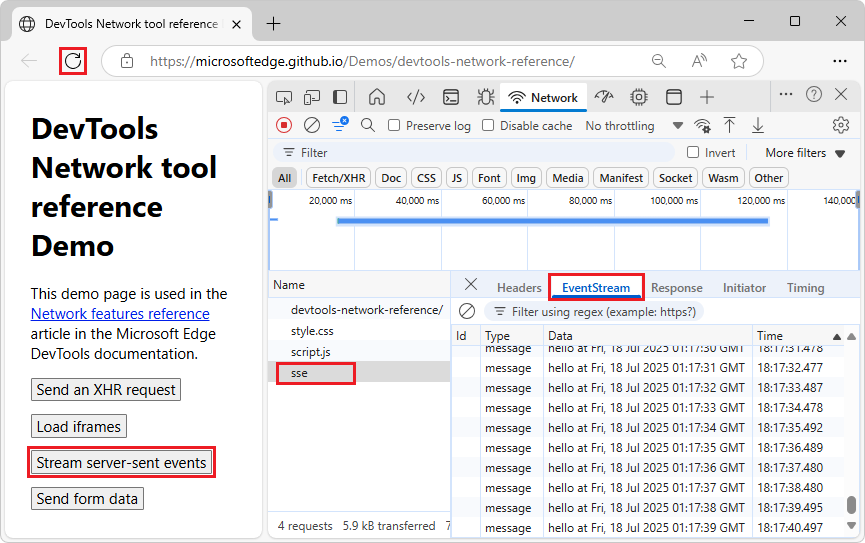
A new "hello" message is received and displayed once per second.
To filter events, specify a regular expression in the filter bar at the top of the EventStream tab.
To clear the list of captured events, click the Clear (![]() ) button.
) button.
See also:
- Using the Fetch API
- Server-sent events - EventSource API.
- XMLHttpRequest - XHR.
Display a preview of a response body
To preview the contents of an HTTP response body:
In the Network tool, In the Requests table, in the Name column, click the name of a request.
In the sidebar, select the Preview tab:
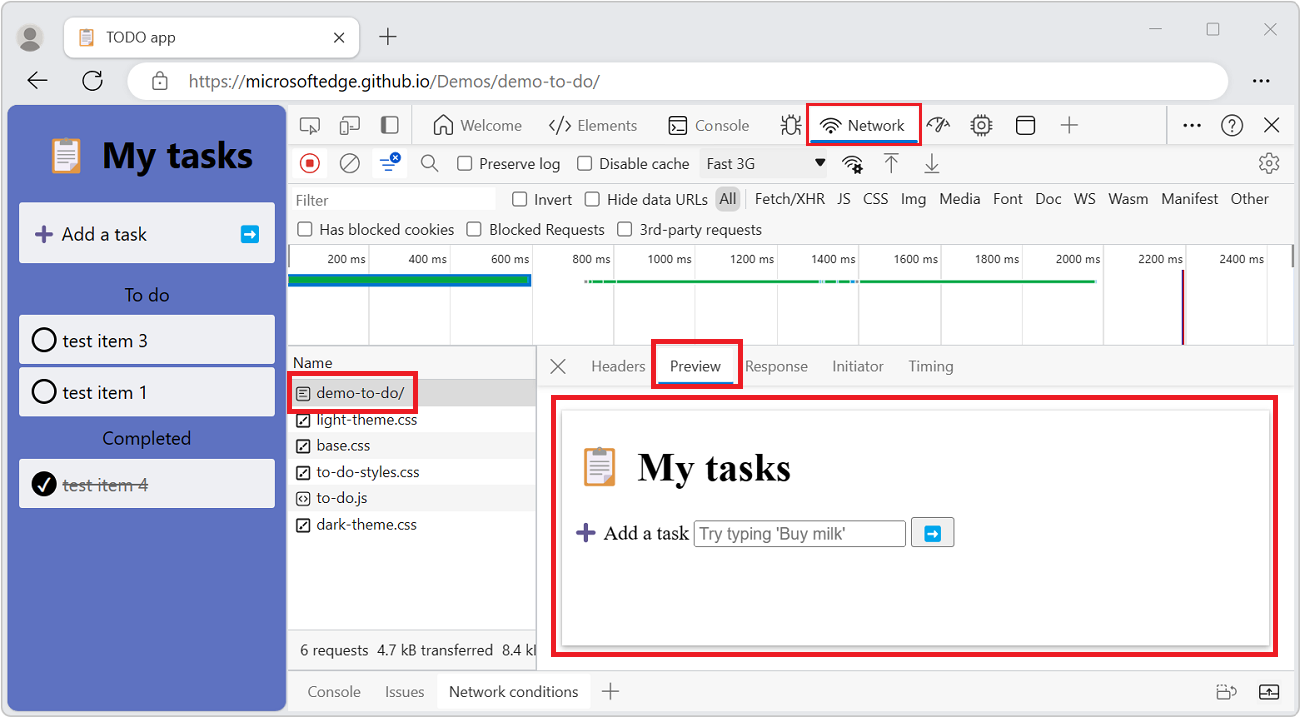
The Preview tab is mostly useful for viewing images.
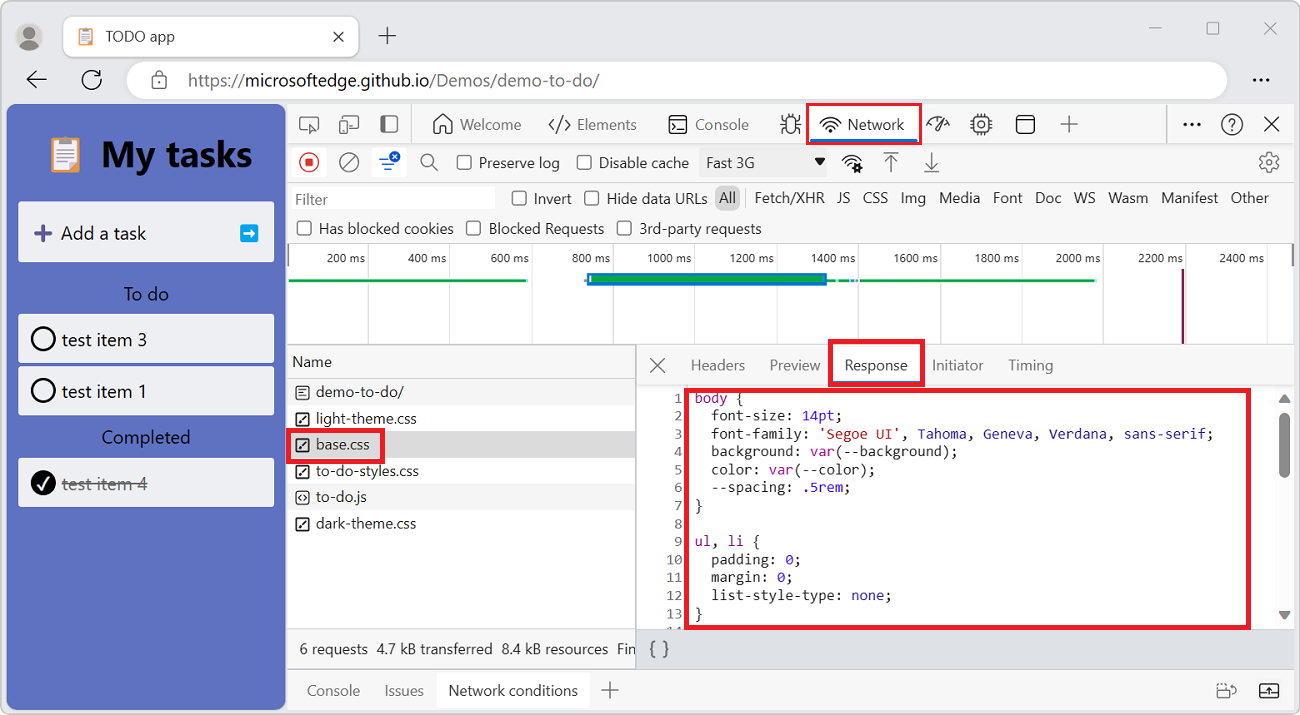
Display a response body
To display the response body to a request:
In the Requests table, in the Name column, click the name of the request.
In the sidebar, select the Response tab:
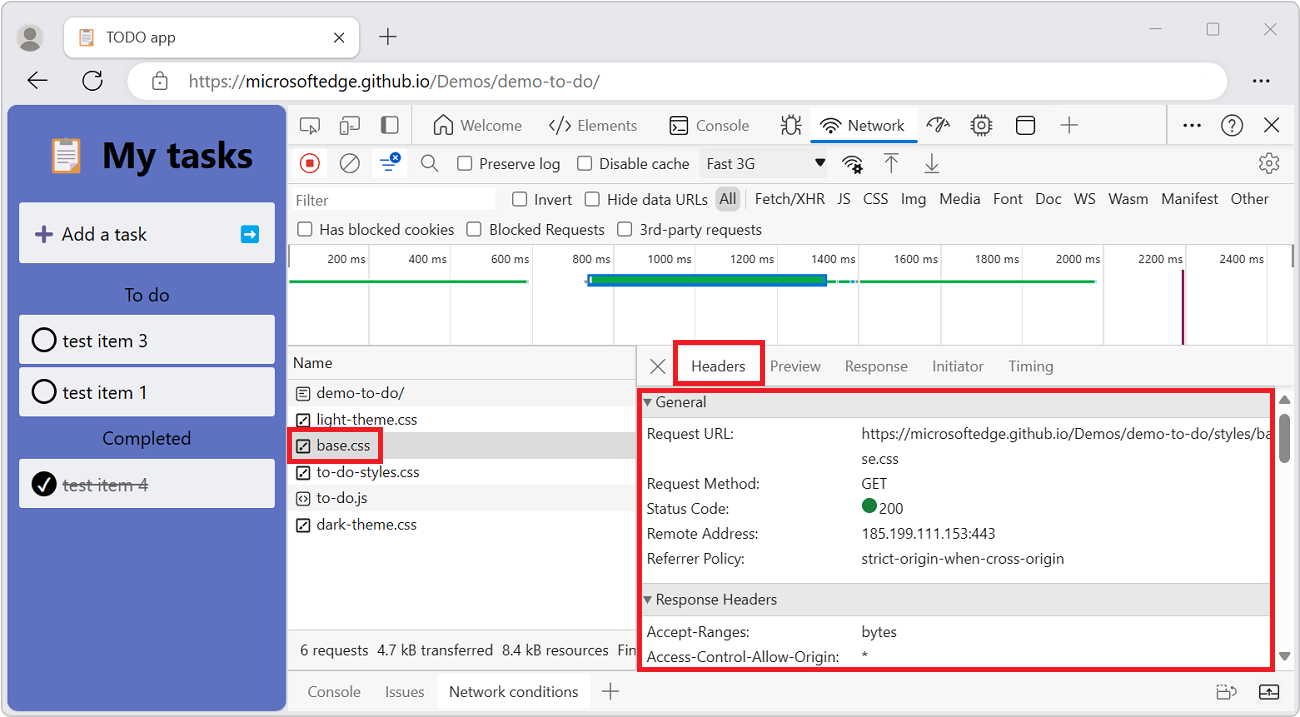
Display HTTP headers
To display HTTP header data about a request:
In the Requests table, click the name of the request.
In the sidebar, select the Headers tab, and then scroll down to the various sections:
- General
- Early Hints Headers (optional)
- Response Headers
- Request Headers
View HTTP header source
By default, the Headers tab shows header names alphabetically. To display the HTTP header names in the order they were received:
Go to a webpage that uses XHR, such as Removing -ms-high-contrast and embracing standards-based forced colors in Microsoft Edge, in a new window or tab.
Accept cookies in the banner prompt, if it appears.
In regions where General Data Protection Regulation (GDPR) is enforced, this site shows a cookie banner, and won't send a
collectrequest (below) unless you accept cookies in the banner.Right-click the webpage, and then select Inspect.
DevTools opens.
Select the Network tool.
Refresh the webpage.
In the Requests table, many requests are listed.
Click the red Stop recording network log (
 ) button at the top.
In the Requests table, click the Name column to sort requests alphabetically, and then select a collect request.
The sidebar opens, with tabs.
Select the Headers tab:
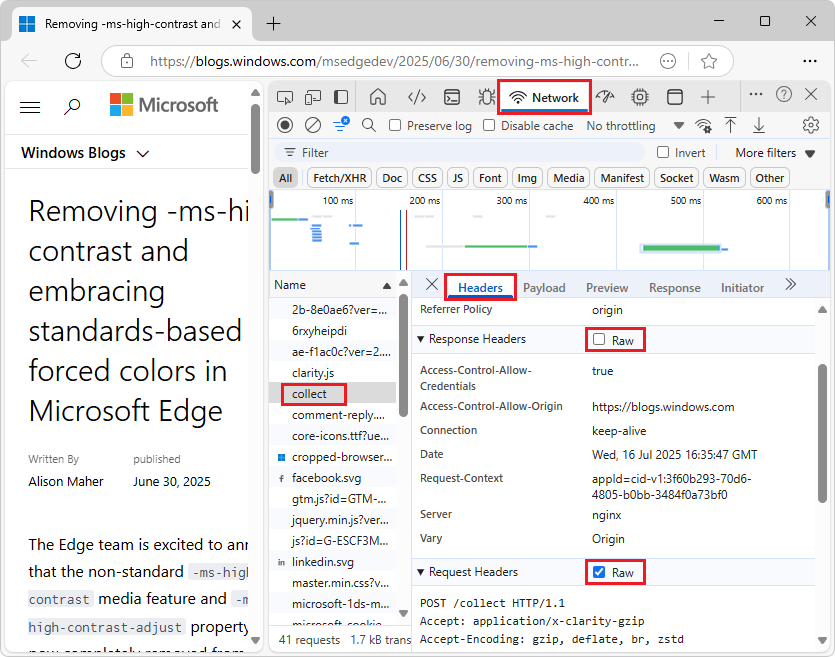
Select the Raw checkbox next to the Response Headers or Request Headers section.
See also:
- Display HTTP headers, above.
Provisional headers warning
Sometimes the Headers tab shows the warning message Provisional headers are shown. This may be due to the following reasons:
- The request wasn't sent over the network, but was served from a local cache, which doesn't store the original request headers.
- The network resource isn't valid.
- Due to security reasons.
Suppose the request wasn't sent over the network but was served from a local cache, which doesn't store the original request headers. In this case, you can select the Disable cache checkbox at the top of the Network tool, to see the full request headers. For example:
Go to the Inspect Network Activity demo page.
Right-click the webpage and then select Inspect.
DevTools opens.
Select the Network tool.
Refresh the webpage.
Select the getstarted.js network request.
The Request Headers section displays the message: Provisional headers are shown. Disable cache to see full headers.
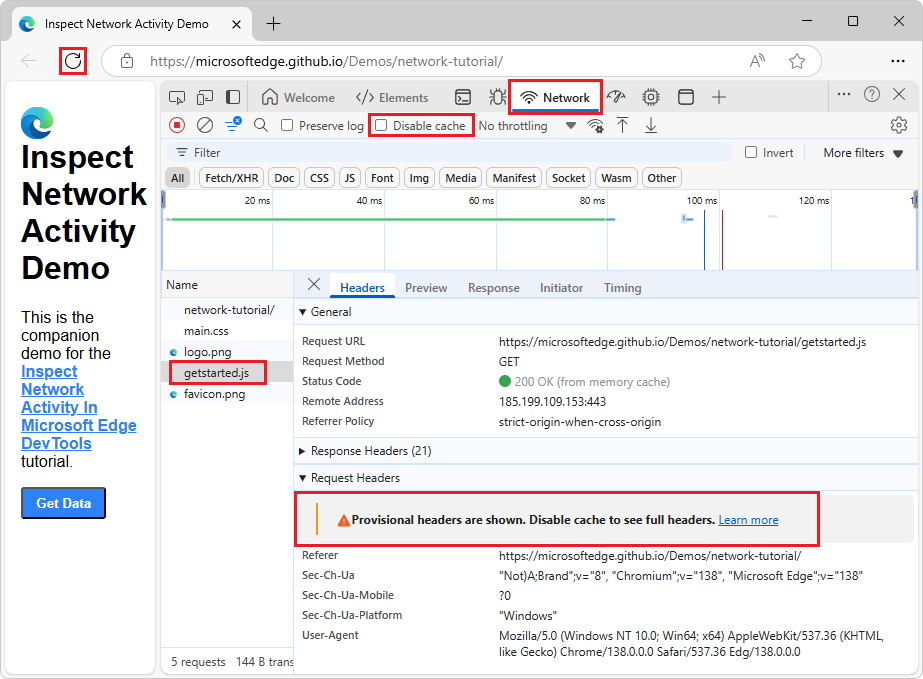
Select the Disable cache checkbox at the top of the Network tool.
Refresh the webpage.
Select the getstarted.js network request.
The Request Headers section no longer displays the message; the full request headers are shown.
See also:
View request payload (query string parameters and form data)
To view an HTTP request's payload (query string parameters and form data), select a request from the Requests table and then select the Payload tab in the sidebar, as follows:
Go to a webpage, such as the Network tool reference Demo, in a new window or tab.
Right-click the webpage, and then select Inspect.
DevTools opens.
In DevTools, select the Network tool.
Refresh the webpage.
In the Network tool's Requests table, rows appear for:
devtools-network-reference/(index.html)style.cssscript.jsfavicon.png
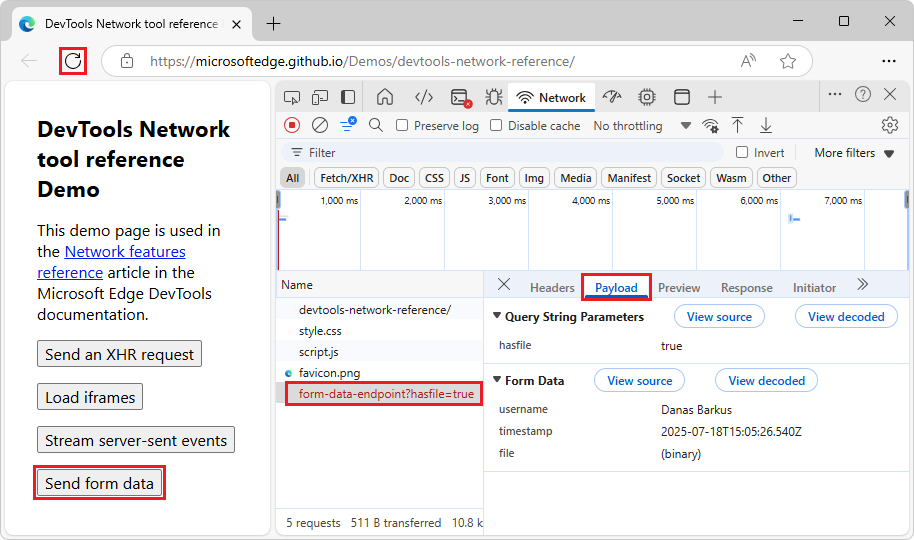
In the demo webpage, click the Send form data button.
In the Network tool's Requests table, a row is added:
form-data-endpoint?hasfile=true
Select the row
form-data-endpoint?hasfile=true.The sidebar opens, including a Payload tab.
Select the Payload tab.
The request's payload is displayed, including a Query String Parameters section and a Form Data section:
In the Console tab of DevTools is the error:
POST https://microsoftedge.github.io/Demos/devtools-network-reference/form-data-endpoint?hasfile=true 405 (Method Not Allowed) (anonymous) @ script.js:49
This harmless Method Not Allowed error appears in the Console, because there's no form-data-endpoint POST handler on the demo server. The error is expected, because github.io hosting doesn't run application servers, only static files.
View payload source
By default, the Network tool shows the payload in a human-readable form.
To instead view the sources of query string parameters or form data:
Do the steps in the previous section, above.
In the Payload tab, the Query String Parameters section shows the payload in a human-readable form, for
hasfile. The Form Data section show the payload in a human-readable form, forusername,timestamp, andfile: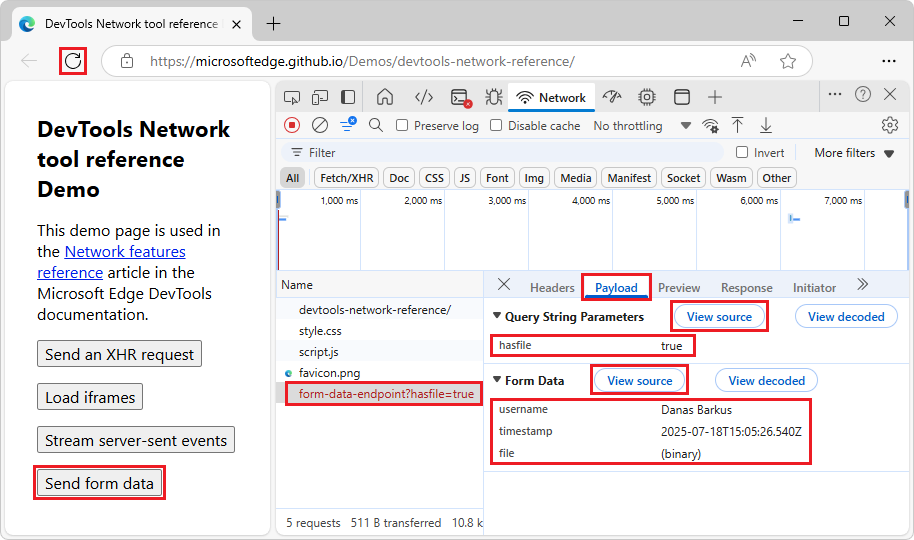
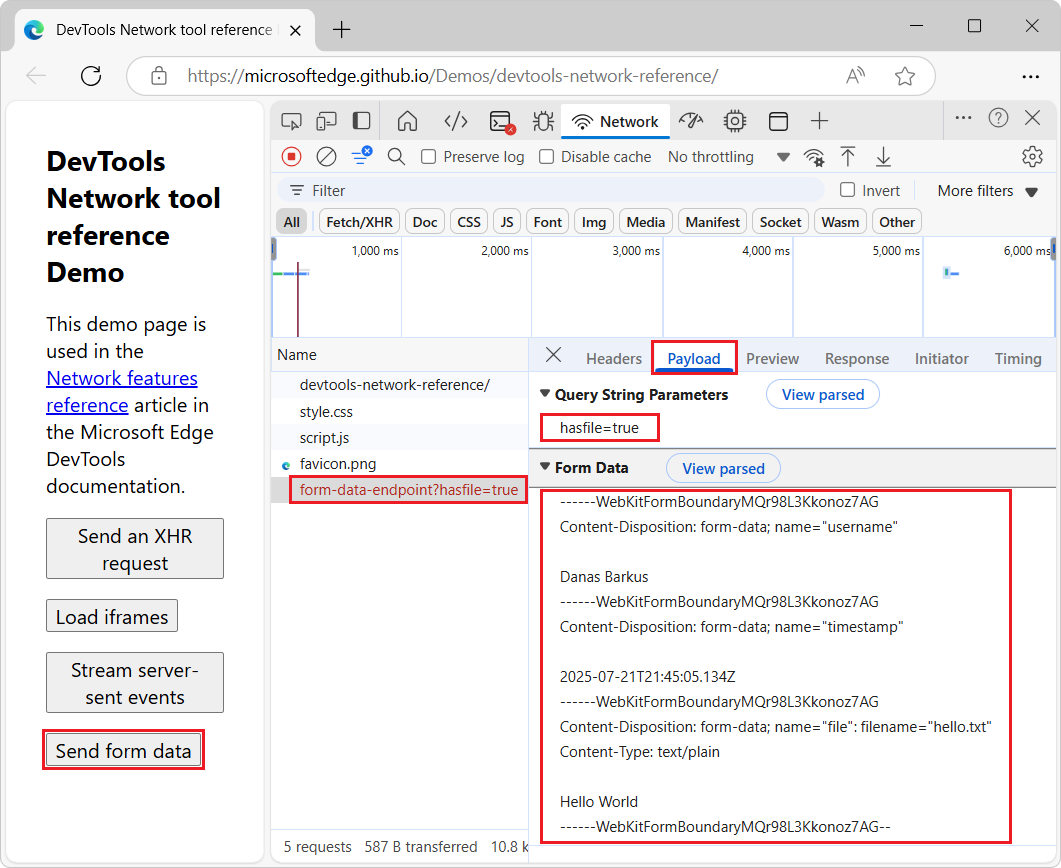
Next to the Query String Parameters section heading, click the View source button.
Next to the Form Data section heading, click the View source button.
The source information for the payload is displayed:
Display URL-encoded query string parameters
To display query string parameters in a human-readable format, but with encodings preserved:
Go to a webpage that uses query string parameters, such as the Network tool reference Demo, in a new window or tab.
Right-click the webpage, and then select Inspect.
DevTools opens.
In DevTools, select the Network tool.
Refresh the webpage.
The Requests table lists
.html,.css,.js, and.pngfiles.In the demo webpage, click the Send encoded query parameters button.
The Requests table adds a row:
encoded-query-params-endpoint?name=Danas+Barkus&url=https%3A%2F%2Fcontoso.com%2F%C3%A0%C3%A9%C3%A8%C3%B4%C3%A7%D0%BBSelect the
encoded-query-params-endpointrow.The sidebar opens, with tabs.
In the sidebar, select the Payload tab.
The Query String Parameters section displays the URL decoded, as:
https://contoso.com/àéèôçл: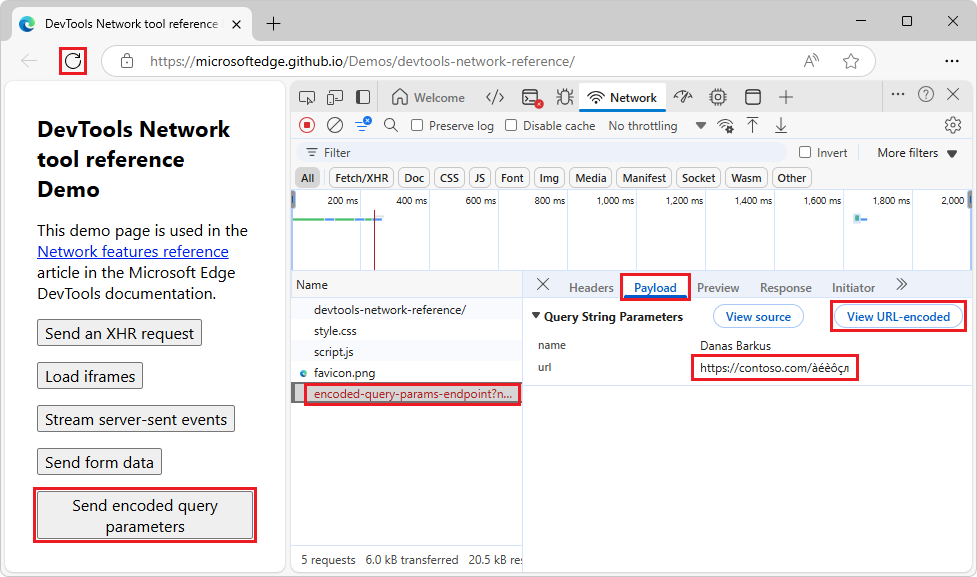
In the Query String Parameters section, click the View URL-encoded button.
The url is now displayed with encoded characters (such as
%3Aand%2F); and the button label changes to View decoded: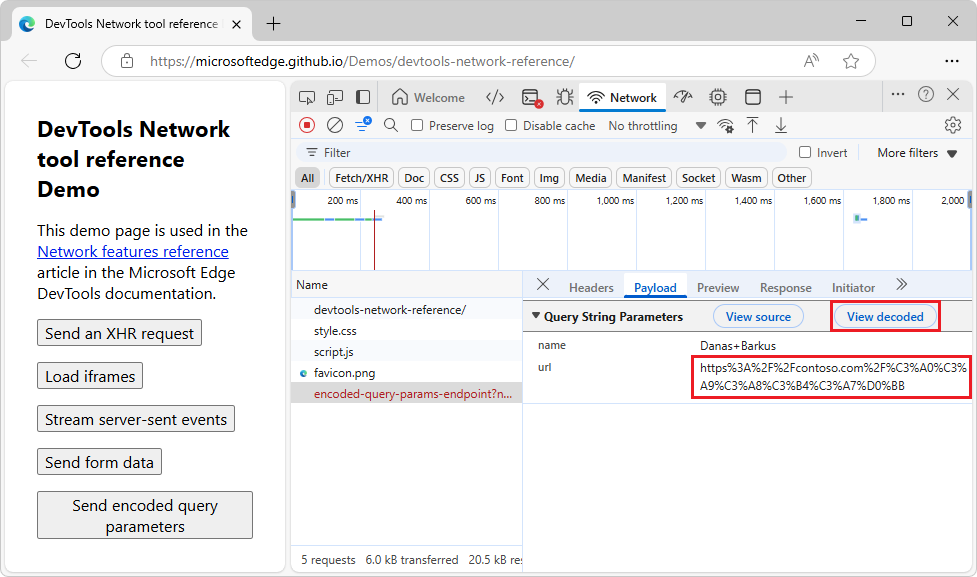
Click the View decoded button.
The url is again displayed with decoded characters, as:
https://contoso.com/àéèôçл, and the button label changes back to View URL-encoded.
Display cookies
To display the cookies sent in the HTTP header of a request:
In the Requests table, click the name of the request.
In the sidebar, select the Cookies tab:
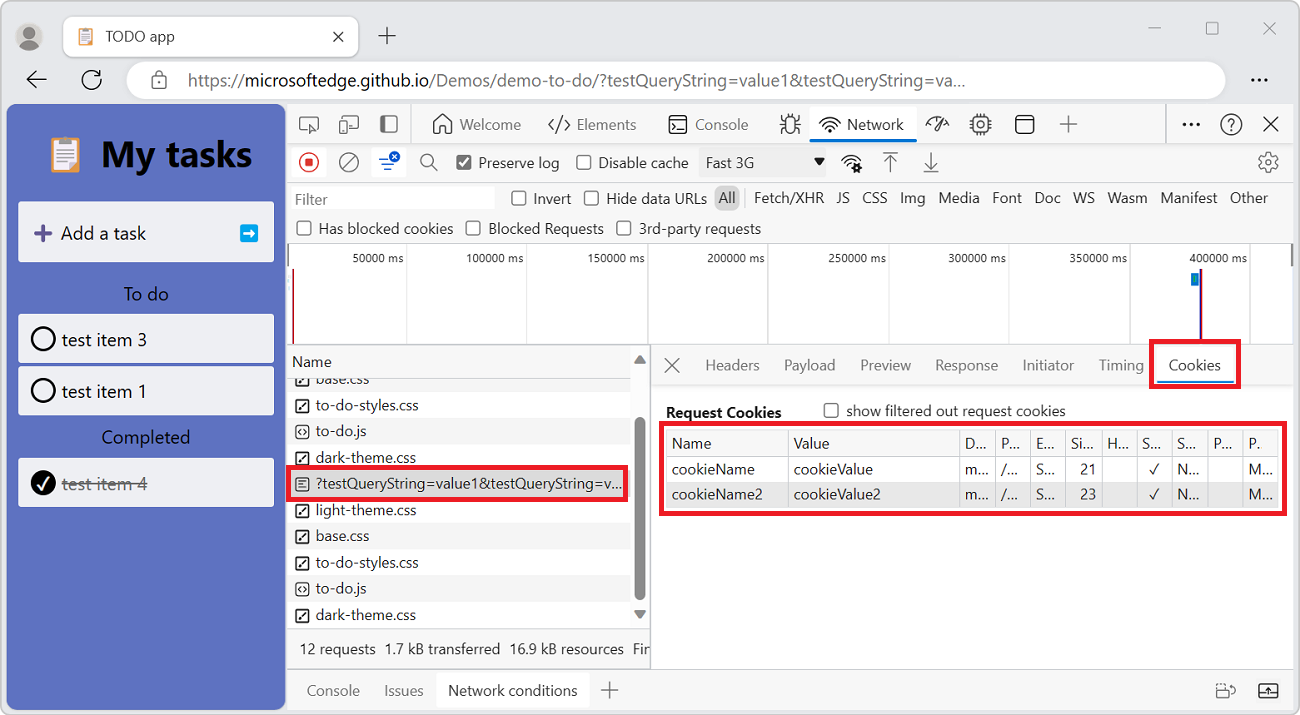
For more information about each of the columns, see Fields in View, edit, and delete cookies.
To modify cookies, see View, edit, and delete cookies.
Display the timing breakdown of a request
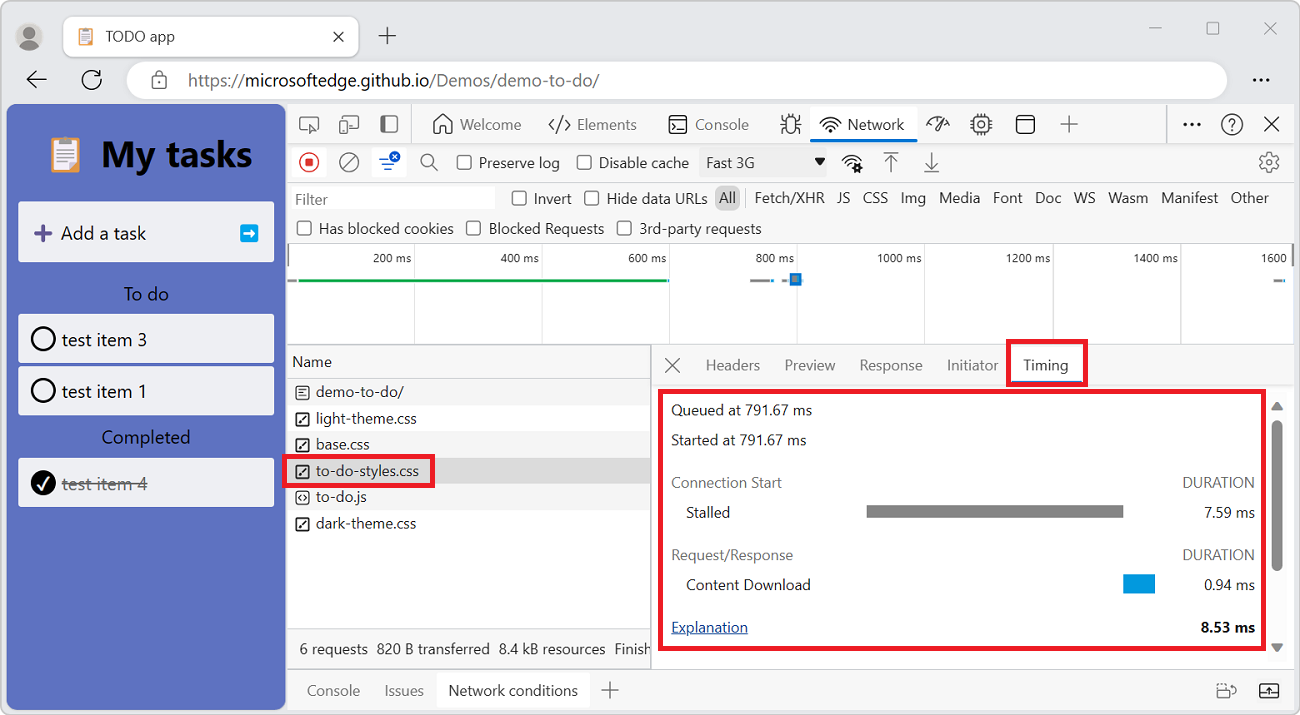
To display the timing breakdown of a request:
In the Request table, click the name of the request.
In the sidebar, select the Timing tab.
For a faster way to access the data, see Preview a timing breakdown.
For more information about each of the phases that may be displayed in the Timing panel, see Timing breakdown phases explained.
Preview a timing breakdown
To display a preview of the timing breakdown of a request, in the Waterfall column of the Requests table, hover on the entry for the request.
The Waterfall column is off by default. To turn on the The Waterfall column, right-click a Requests table header, and then select the plain Waterfall menuitem that doesn't have a submenu.
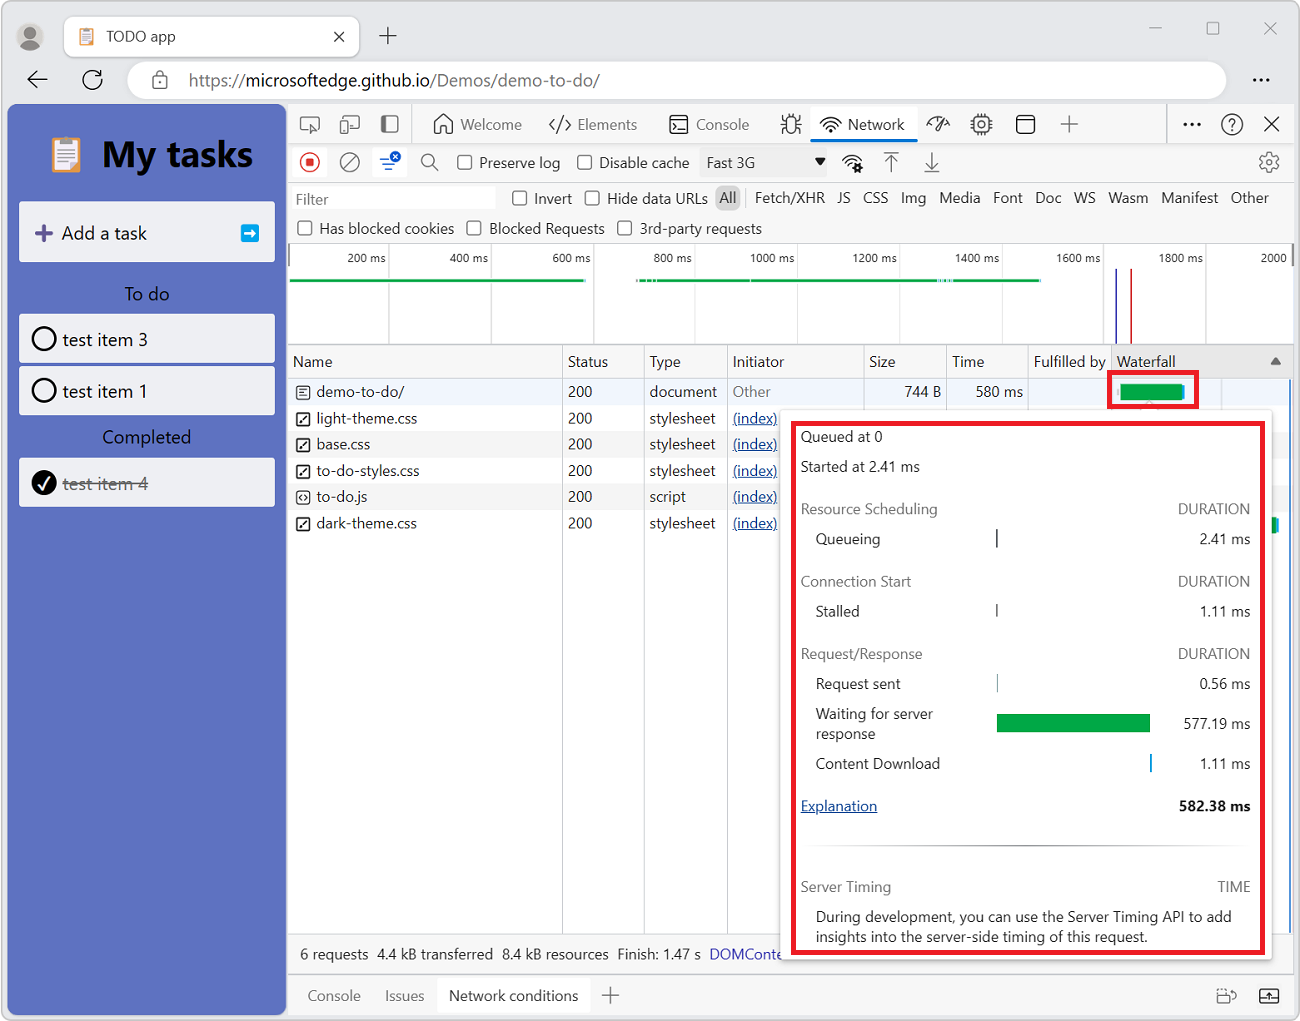
To view the data without hovering, see the top of the present section, Display the timing breakdown of a request.
Timing breakdown phases explained
Each of these phases may appear in the Timing tab:
Queueing. The browser queues requests when any of the following are true
- There are higher priority requests.
- There are already six TCP connections open for this origin, which is the limit. Applies to HTTP/1.0 and HTTP/1.1 only.
- The browser is briefly allocating space in the disk cache.
Stalled. The request could be stalled for any of the reasons described in Queueing.
DNS Lookup. The browser is resolving the IP address for the request.
Initial connection. The browser is establishing a connection, including TCP handshakes and retries and negotiating a Secure Socket Layer (SSL).
Proxy negotiation. The browser is negotiating the request with a proxy server.
Request sent. The request is being sent.
ServiceWorker Preparation. The browser is starting up the service worker.
Request to ServiceWorker. The request is being sent to the service worker.
Waiting (TTFB). The browser is waiting for the first byte of a response. TTFB stands for Time To First Byte. This timing includes one round trip of latency and the time the server took to prepare the response.
Content Download. The browser is receiving the response.
Receiving Push. The browser is receiving data for this response via HTTP/2 Server Push.
Reading Push. The browser is reading the local data that was previously received.
Display initiators and dependencies
To display the initiators and dependencies of a request, hold Shift and hover on the request in the Requests table.
- The requests that initiated the hovered request are shown in green.
- The dependencies of the hovered requests are shown in red.
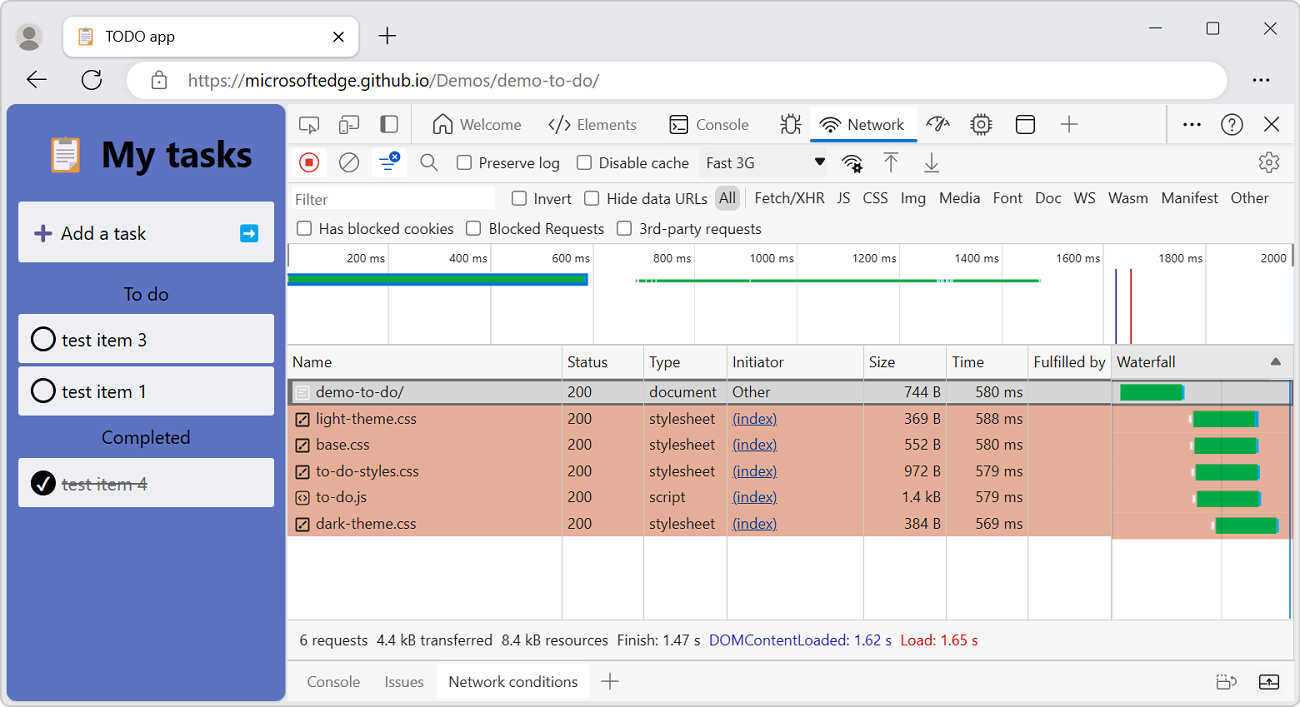
When the Requests table is ordered chronologically, if you hover on a line, the line preceding it displays a green request. The green request is the initiator of the dependency. If another green request is displayed on the line before that, that higher request is the initiator of the initiator. And so on.
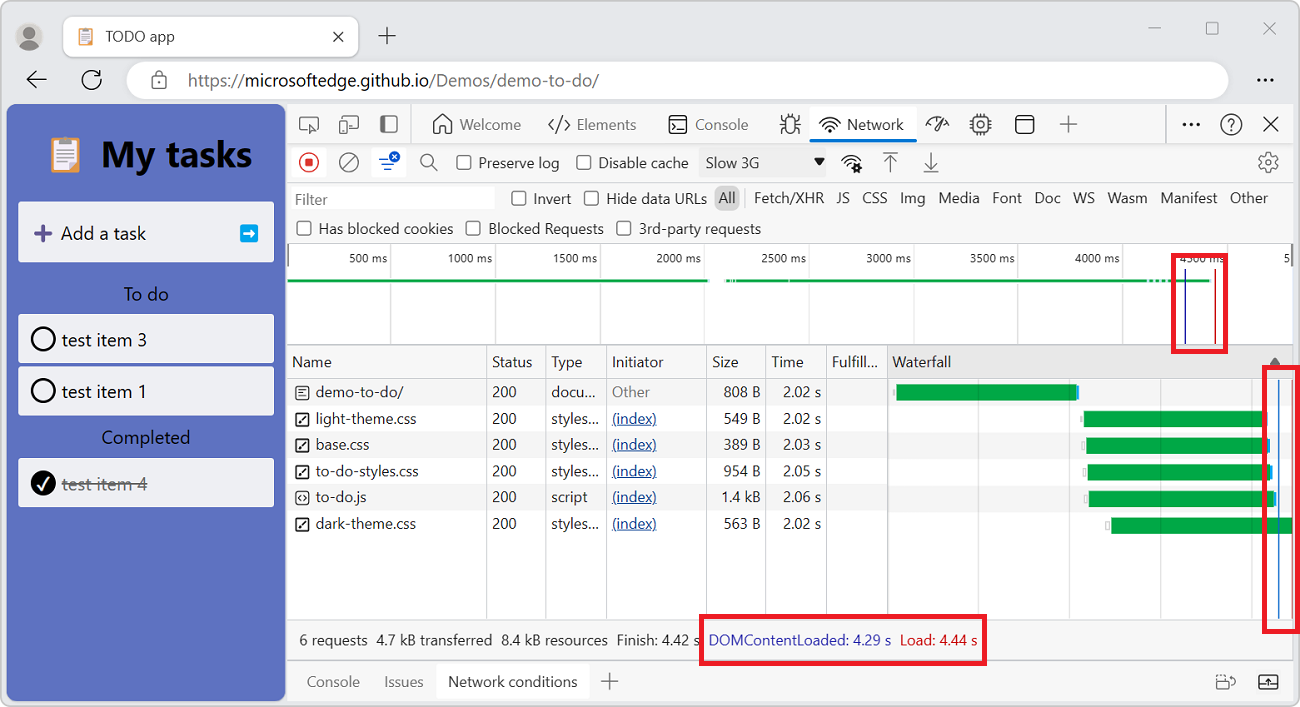
Display load events
DevTools displays the timing of the DOMContentLoaded and load events in multiple places on the Network tool:
In the Overview pane with vertical lines.
In the Waterfall column of the Request table with vertical lines. The Waterfall column is off by default. To turn on the The Waterfall column, right-click a Requests table header, and then select the plain Waterfall menuitem that doesn't have a submenu.
In the Summary pane, at the bottom of the Network tool, with timing labels.
The DOMContentLoaded event is colored blue, and the load event is red.
Display the total number of requests
The total number of requests is listed in the Summary pane, at the bottom of the Network tool.
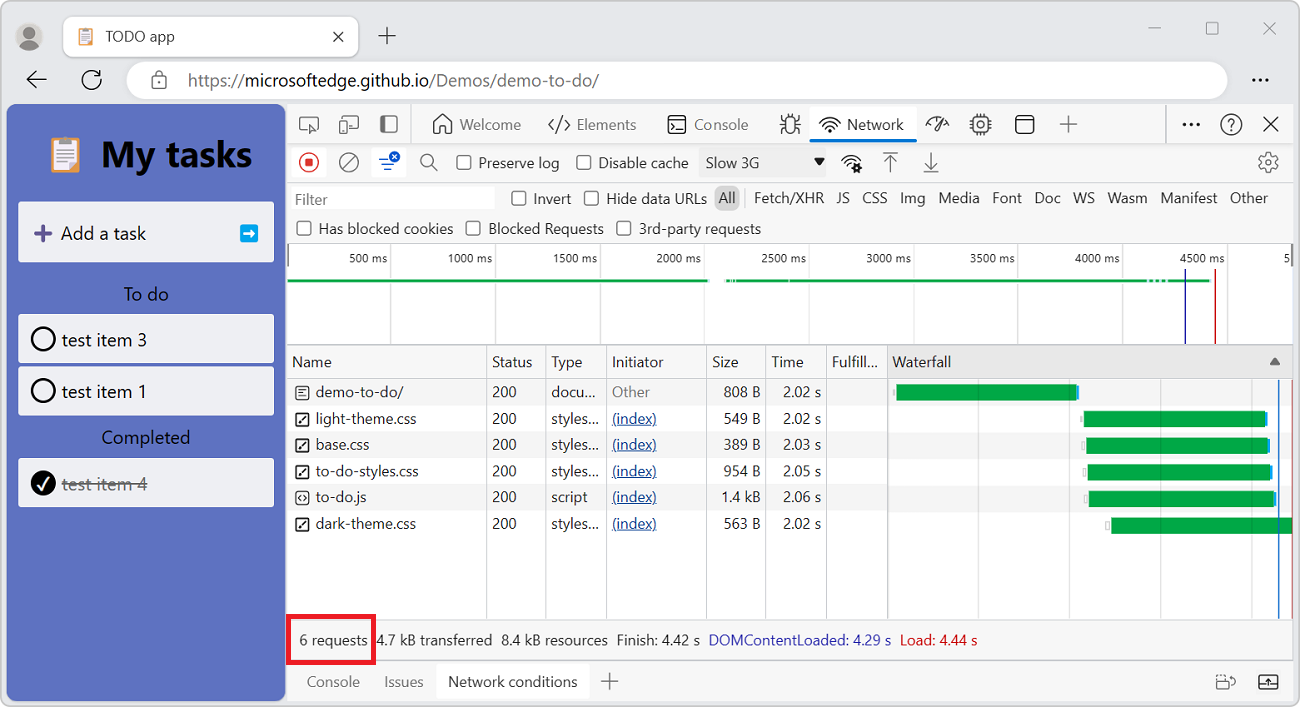
Caution: This number only tracks requests that have been logged since DevTools was opened. If other requests occurred before DevTools was opened, those requests aren't counted.
Display the total download size
The total download size of requests is listed in the Summary pane, at the bottom of the Network tool.

Caution: This number only tracks requests that have been logged since DevTools was opened. If other requests occurred before DevTools was opened, the previous requests aren't counted.
To verify how large resources are after the browser uncompresses each item, see display the uncompressed size of a resource.
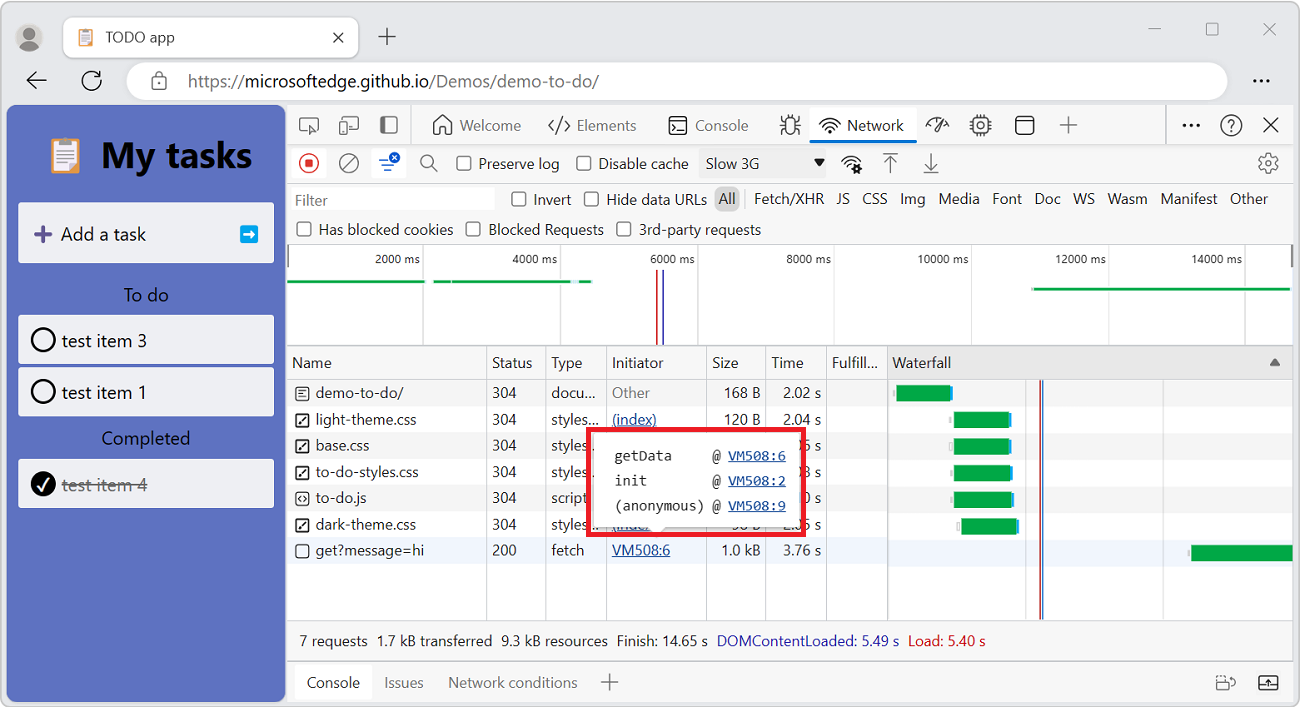
Display the stack trace that caused a request
After a JavaScript statement requests a resource, hover on the Initiator column to display the stack trace leading up to the request.
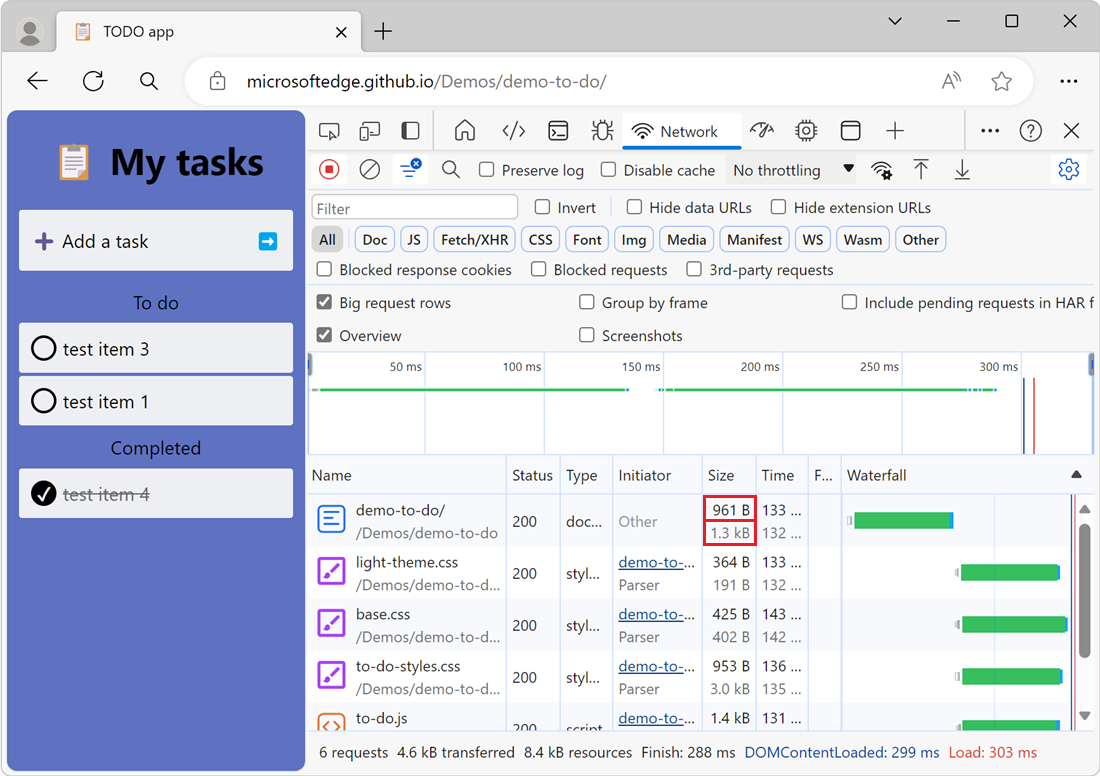
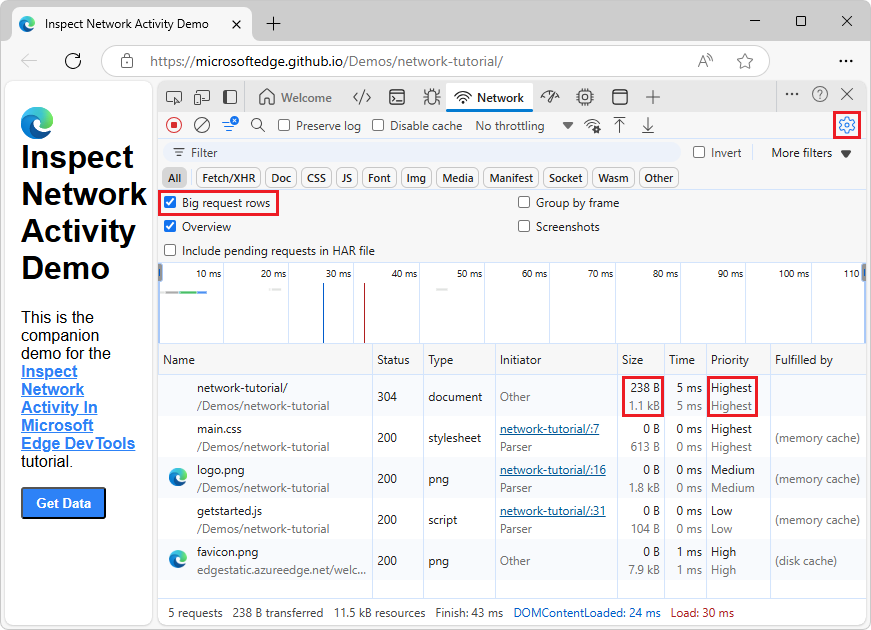
Display the uncompressed size of a resource
To see both the transferred size and the uncompressed size of a resource at the same time:
In the upper right within the Network tool, click the Network settings (gear) icon. A row of checkboxes appears.
Turn on the Big request rows checkbox.
Examine the Size column in the Request table. The top value is the transferred size, and the bottom value is the size of the resource after the browser uncompresses it:
Export requests data
You can export or copy the list of requests, with filters applied, in several ways described next.
Save all network requests to a HAR file
HAR (HTTP Archive) is a file format used by several HTTP session tools to export the captured data. The format is a JSON object with a particular set of fields. See HAR Analyzer.
To reduce the chances of accidental leaks of sensitive information, by default you can export the "sanitized" network log in HAR format that excludes sensitive information such as Cookie, Set-Cookie, and Authorization headers. If required, you can also export the log with sensitive data.
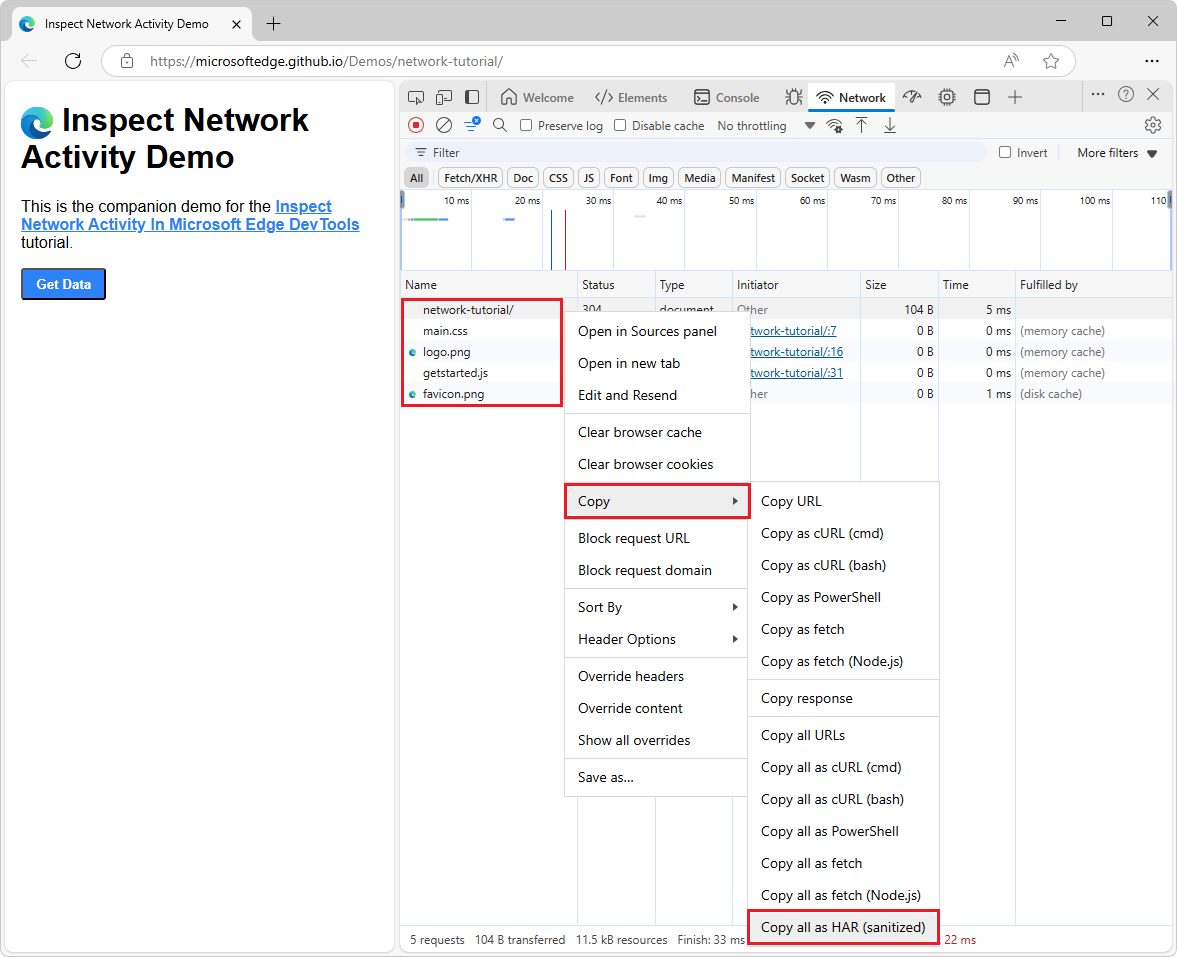
To save all network requests to a HAR file, without sensitive data:
Go to a webpage, such as the Inspect Network Activity demo page, in a new window or tab.
Right-click the webpage, and then select Inspect.
DevTools opens.
In DevTools, select the Network tool.
Refresh the webpage.
Right-click any request in the Requests table, and then select Copy > Copy all as HAR (sanitized):
Or, in the action bar at the top of the Network tool, click the Export HAR (sanitized) (
 ) button.
DevTools saves all requests that have occurred since you opened DevTools to the HAR file.
You can't filter requests, and you can't save a single request.
To save all network requests to a HAR file, including sensitive data:
In DevTools, select Customized and control DevTools > Settings.
The Settings > Preferences page opens.
Scroll down to the Network section.
Select the checkbox Allow to generate HAR with sensitive data.
Click the Close (
 ) button.
In the Network tool, right-click any request in the Requests table, and then select Copy > Copy all as HAR (with sensitive data).
Or, in the action bar at the top, click the Export HAR (either sanitized or with sensitive data) (
) button, and then select Export HAR (with sensitive data):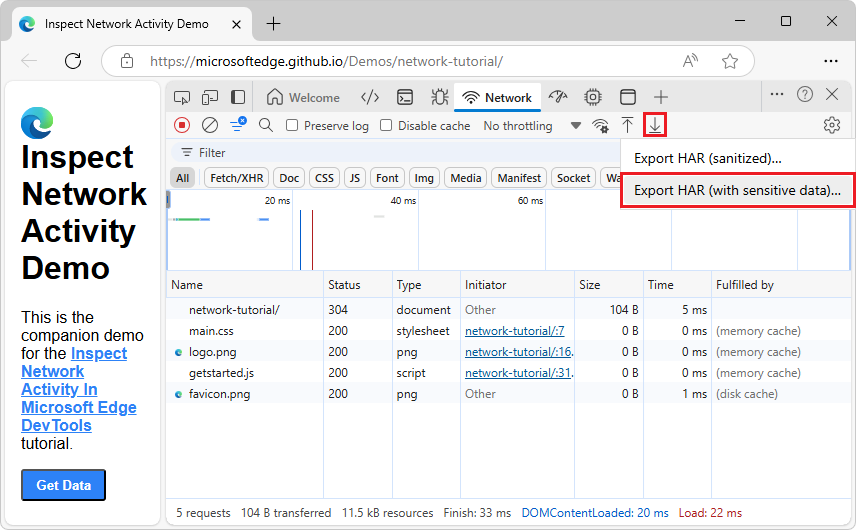
Import a HAR file into DevTools for analysis
After you have a HAR file, you can import it back into DevTools for analysis by using HAR Analyzer.
To import a HAR file into DevTools for analysis:
In the action bar at the top of the Network tool, click the Import HAR file (
 ) button.
Or, drag the HAR file onto the Requests table.
The Network tool reads and shows initiators for the requests that are imported from the HAR file. For initiators, see Display a log of requests, above.
Copy network requests to the clipboard
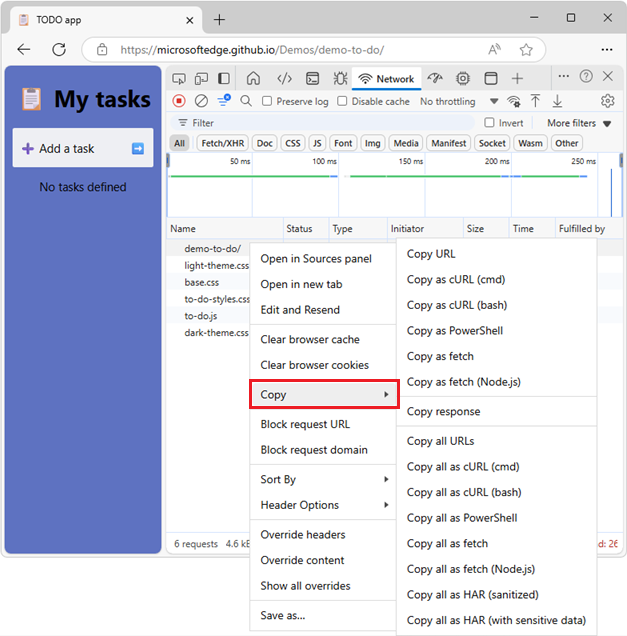
Under the Name column of the Requests table, right-click a request, hover over Copy, and then select one of the following options.
To copy a single request, its response, or its stack trace:
| Name | Details |
|---|---|
| Copy URL | Copy the URL of the request to the clipboard. |
| Copy as cURL (cmd) | Copy the request as a cURL command. |
| Copy as cURL (bash) | |
| Copy as PowerShell | Copy the request as a PowerShell command. |
| Copy as fetch | Copy the request as a fetch call. |
| Copy as fetch (Node.js) | Copy the request as a Node.js fetch call. |
| Copy response | Copy the response body to the clipboard. |
| Copy stack trace | Copy the request's stack trace to the clipboard. This menuitem only appears for requests that are triggered by JavaScript code, such as Fetch or XHR requests. See Replay XHR request, above. |
To copy all requests:
| Name | Details |
|---|---|
| Copy all URLs | Copy URLs of all requests to the clipboard. |
| Copy all as cURL (cmd) | Copy all requests as a chain of cURL commands. |
| Copy all as cURL (bash) | |
| Copy all as PowerShell | Copy all requests as a chain of PowerShell commands. |
| Copy all as fetch | Copy all requests as a chain of fetch calls. |
| Copy all as fetch (Node.js) | Copy all requests as a chain of Node.js fetch calls. |
| Copy all as HAR (sanitized) | Copy all requests as HAR data without sensitive data such as Cookie, Set-Cookie, and Authorization headers. |
| Copy all as HAR (with sensitive data) | Copy all requests as HAR data with sensitive data. Command appears if you select the checkbox Customize and control DevTools > Settings > Preferences page > Network section > Allow to generate HAR with sensitive data. |
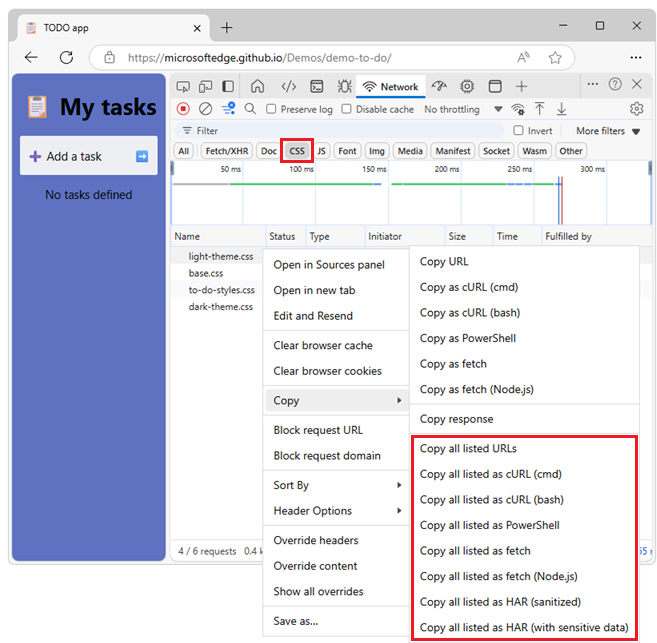
To copy a filtered set of requests, apply a filter to the network log, right-click a request, and then select:
| Name | Details |
|---|---|
| Copy all listed URLs | Copy URLs of all filtered requests to the clipboard. |
| Copy all listed as cURL (cmd) | Copy all filtered requests as a chain of cURL commands. |
| Copy all listed as cURL (bash) | Copy all filtered requests as a chain of cURL commands. |
| Copy all listed as PowerShell | Copy all filtered requests as a chain of PowerShell commands. |
| Copy all listed as fetch | Copy all filtered requests as a chain of fetch calls. |
| Copy all listed as fetch (Node.js) | Copy all filtered requests as a chain of Node.js fetch calls. |
| Copy all listed as HAR (sanitized) | Copy all filtered requests as HAR data without sensitive data such as Cookie, Set-Cookie, and Authorization headers. |
| Copy all listed as HAR (with sensitive data) | Copy all filtered requests as HAR data with sensitive data. Command appears if you select the checkbox Customize and control DevTools > Settings > Preferences page > Network section > Allow to generate HAR with sensitive data. |
See also:
- Filter requests, above.
Copy formatted response JSON to the clipboard
To copy the formatted JSON data of a JSON response:
In the Requests table, click the name of the request that led to a JSON response.
In the sidebar, select the Preview tab.
Right-click the first line of the formatted JSON response preview and then select Copy value.
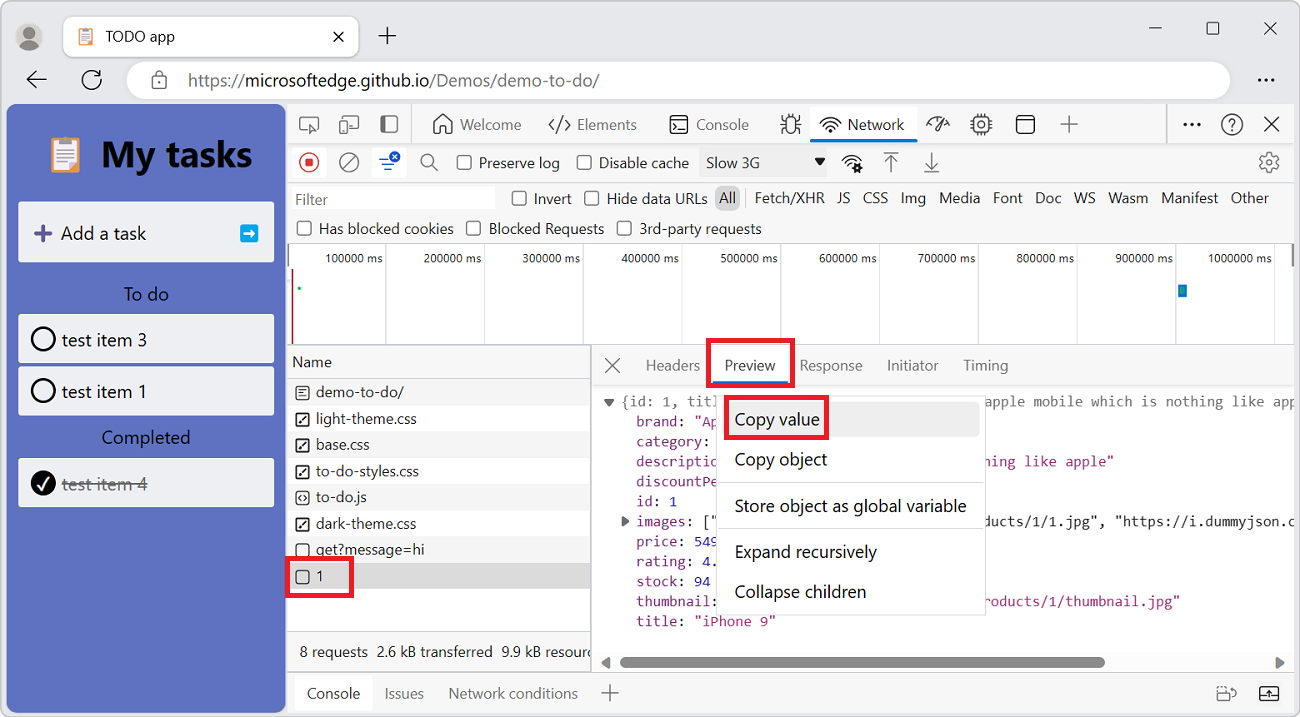
You can now paste the value into any editor.
Copy property values from network requests to your clipboard
To copy property values from network requests to your clipboard:
In the Request table, click the name of the request.
In the sidebar, select the Payload tab:
Expand one of the following sections.
- Request payload (JSON)
- Form Data
- Query String Parameters
- Request Headers
- Response Headers
Right-click a value and then select Copy value. You can now paste the value into any editor.
Change the layout of the Network tool
You can expand or collapse sections of the Network tool UI to focus important information.
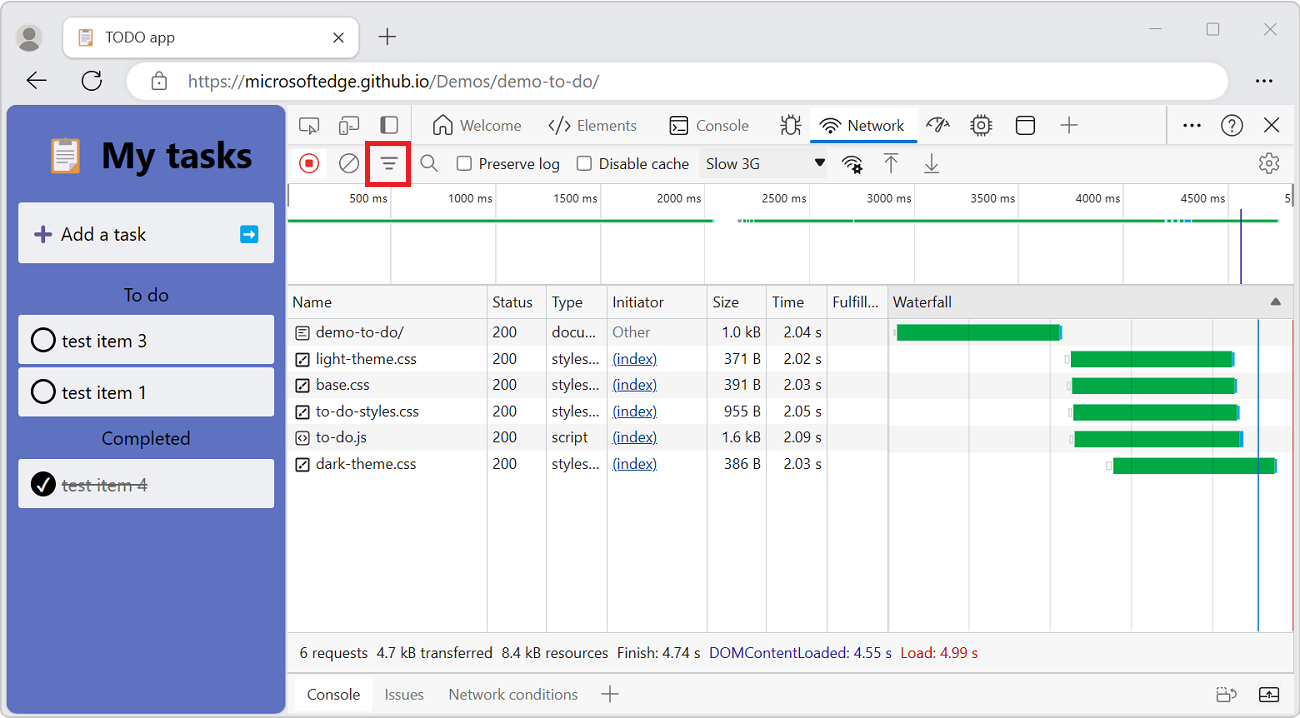
Hide the Filters pane
By default, DevTools shows the Filters pane. To hide the Filters pane, select Filter (![]() ).
).
Use big request rows
Use big request rows when you want more whitespace in your network requests table. Some columns also provide a little more information when using big rows; for example:
The bottom value of the Size column is the uncompressed size of a request.
The Priority column (not shown by default) shows both the initial (bottom value) and final (top value) fetch priority.
To enable big rows:
Go to a webpage, such as the Inspect Network Activity demo page, in a new window or tab.
Right-click the webpage, and then select Inspect.
DevTools opens.
In DevTools, select the Network tool.
Refresh the webpage.
Requests are shown in small rows.
In the Network tool, click the Network settings (
) button, and then select the Big request rows checkbox.Requests are shown in big rows:
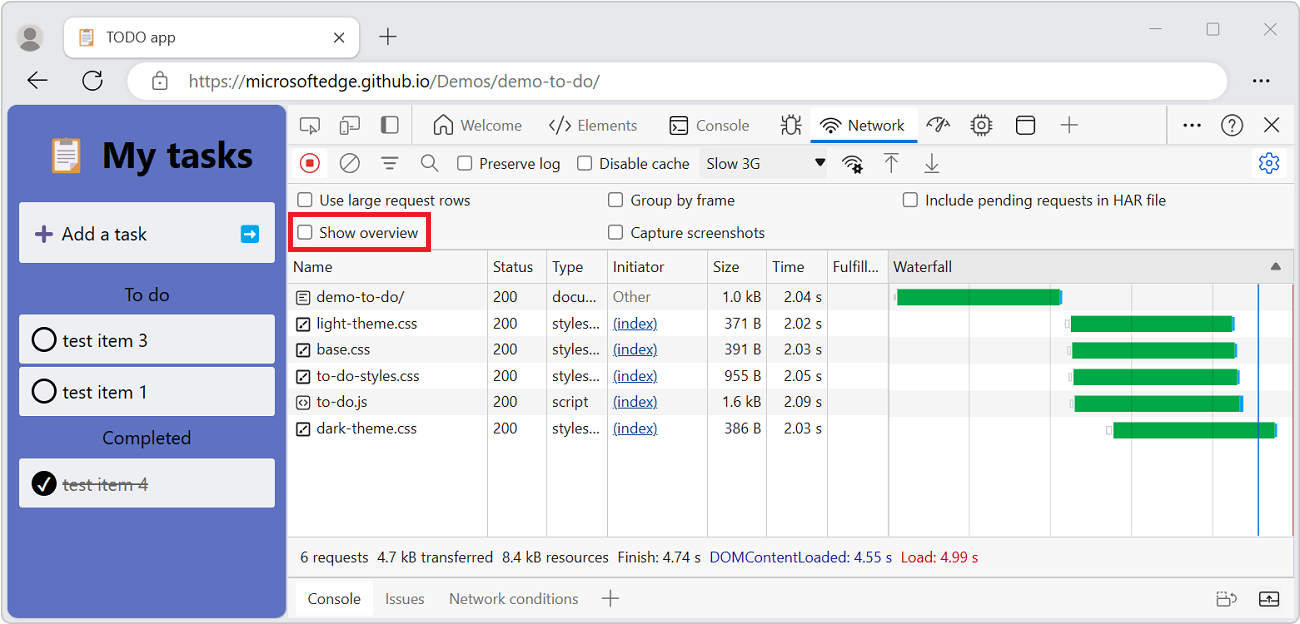
Hide the Overview pane
By default, DevTools displays the Overview pane. To hide the Overview pane, clear the Show Overview checkbox.
See also
- Inspect network activity - step-by-step walkthrough and introduction to the Network tool.
Demo webpages:
Note
Portions of this page are modifications based on work created and shared by Google and used according to terms described in the Creative Commons Attribution 4.0 International License. The original page is found here and is authored by Kayce Basques.
![]() This work is licensed under a Creative Commons Attribution 4.0 International License.
This work is licensed under a Creative Commons Attribution 4.0 International License.