Note
Access to this page requires authorization. You can try signing in or changing directories.
Access to this page requires authorization. You can try changing directories.
| Enabled for | Public preview | Early access | General availability |
|---|---|---|---|
| Users by admins, makers, or analysts |  Mar 21, 2025
 |
- |  Apr 25, 2025
 |
Business value
Sales teams often rely on dashboards, static charts, or external tools like Power BI to make sense of their sales data in Dynamics 365 Sales. Switching between views or analyzing raw data manually can take extra time, disrupt daily workflows, and delay decision-making.
As part of Copilot’s productivity capabilities, smart charts enable sellers to generate real-time visualizations directly within their workflow. Using AI, these charts help you uncover trends, patterns, and relationships in tabular data, making it easier to interpret data, act on insights faster, and stay focused on closing deals.
Feature details
As a seller, you can:
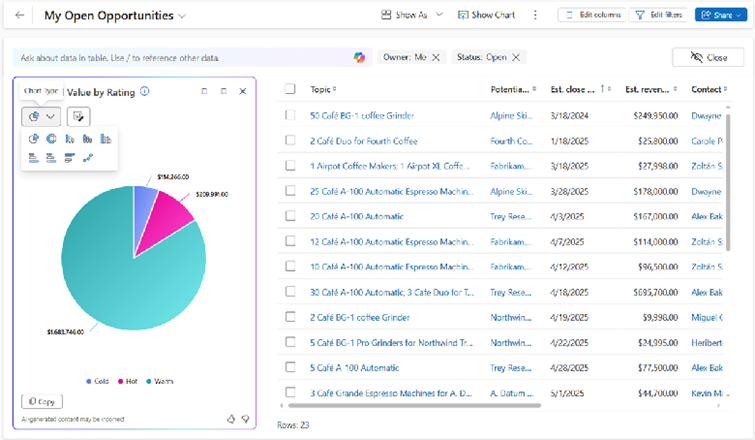
- Select the Visualize option on a grid page to generate a chart based on the visible columns and applied filters in the current view.
- View the chart side by side with the data grid, so you can more easily interpret key trends and patterns in your data.
- Select Explain to see an AI-generated summary that helps you understand why Copilot chose the specific visualization.
- Hover over data points or select chart elements to drill into details—filtered results will update automatically in the grid.
- Use the chart selector to personalize the visualization by choosing from nine chart types, including bar, pie, column, and line.
- Add or remove columns and filters in the view, and Copilot will automatically update the chart.
- Use additional controls to refresh the chart, expand it to full screen, close the chart pane, or copy it as a PNG.
- Share your feedback with the thumbs-up or thumbs-down icons to help improve the feature.
For more details and timelines, go to the Power Apps release plan: Visualize the data in your view easily with Copilot

Note
Your administrator must enable the Allow AI to generate charts to visualize the data in a view setting in the Power Platform admin center.
Geographic areas
Visit the Explore Feature Geography report for Microsoft Azure areas where this feature is planned or available.
Language availability
Visit the Explore Feature Language report for information on this feature's availability.