Note
Access to this page requires authorization. You can try signing in or changing directories.
Access to this page requires authorization. You can try changing directories.
When you deploy an Azure Managed Instance for Apache Cassandra cluster, the service provisions Metrics Collector for Apache Cassandra agent software on each data node. Prometheus consumes the metrics and they're visualized through Grafana. This article describes how to configure Prometheus and Grafana to visualize metrics emitted from your managed instance cluster.
The following tasks are required to visualize metrics:
- Deploy an Ubuntu virtual machine (VM) inside the Azure virtual network where the managed instance is present.
- Install the Prometheus dashboards onto the VM.
Warning
Prometheus and Grafana are open-source software and aren't supported as part of Azure Managed Instance for Apache Cassandra. Visualizing metrics in the way described in this article requires you to host and maintain a VM as the server for both Prometheus and Grafana. The instructions in this article were tested only for Ubuntu Server 18.04. There's no guarantee that they work with other Linux distributions.
Following this approach means that you must support any issues that might arise, such as running out of space or availability of the server. For a fully supported and hosted metrics experience, consider using Azure Monitor metrics or Azure Monitor partner integrations.
Deploy an Ubuntu server
Sign in to the Azure portal.
Go to the resource group where your managed instance cluster is located. Select Add and search for the Ubuntu Server 18.04 LTS image.
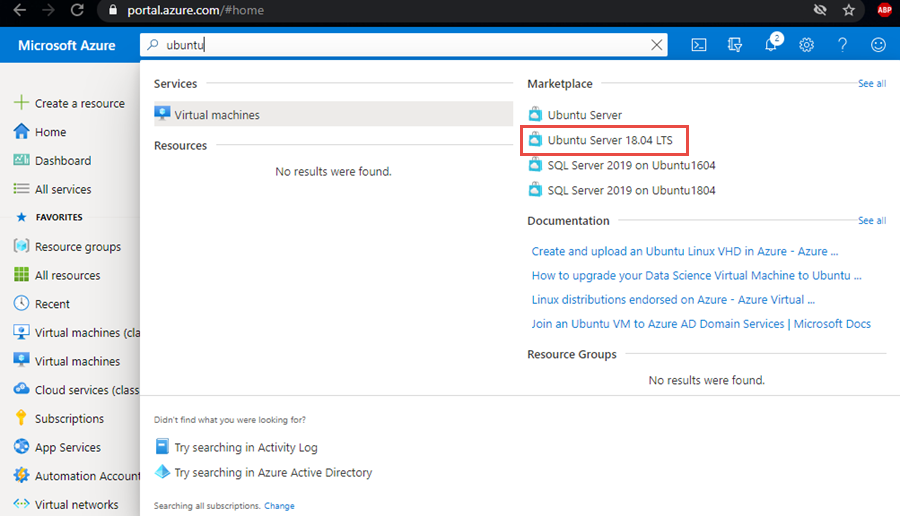
Select the image, and then select Create.
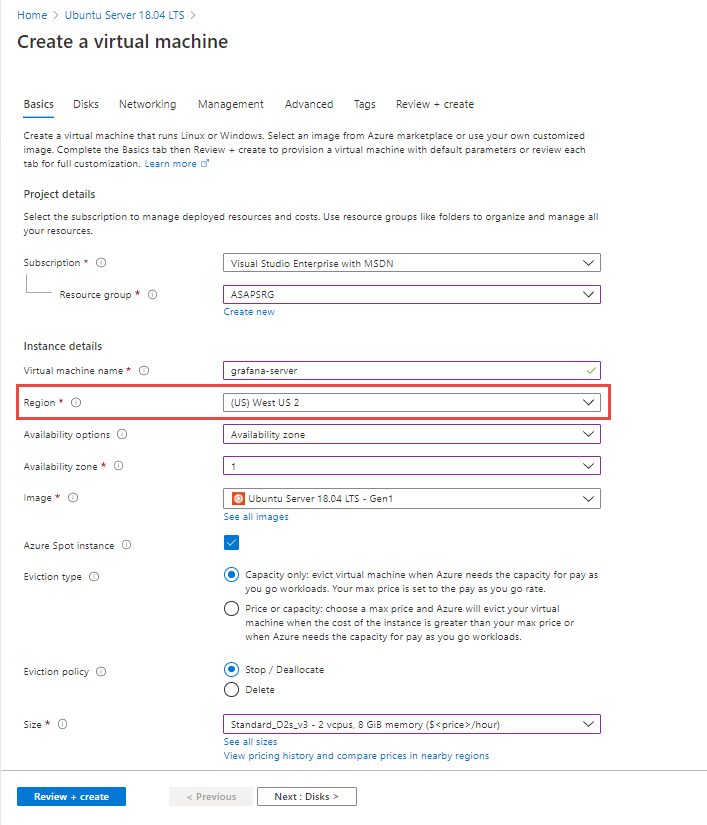
On the Create a virtual machine pane, enter values for the following fields. You can leave default values for other fields:
- Virtual machine name: Enter a name for your VM.
- Region: Select the same region where your virtual network is deployed.
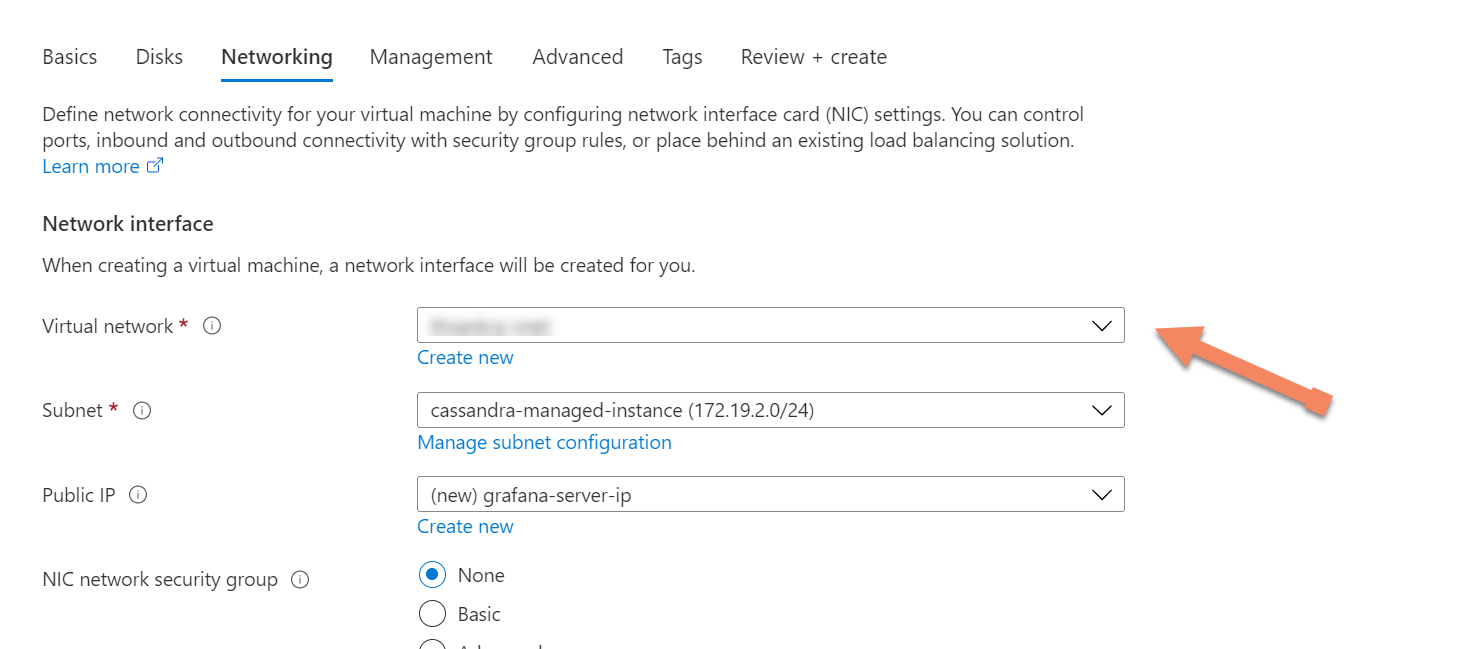
On the Networking tab, select the virtual network in which your managed instance is deployed.
Finally, select Review + create to create your metrics server.
Install Prometheus dashboards
First, ensure that the networking settings for your newly deployed Ubuntu server have inbound port rules that allow ports
9090and3000. These ports are required later for Prometheus and Grafana, respectively.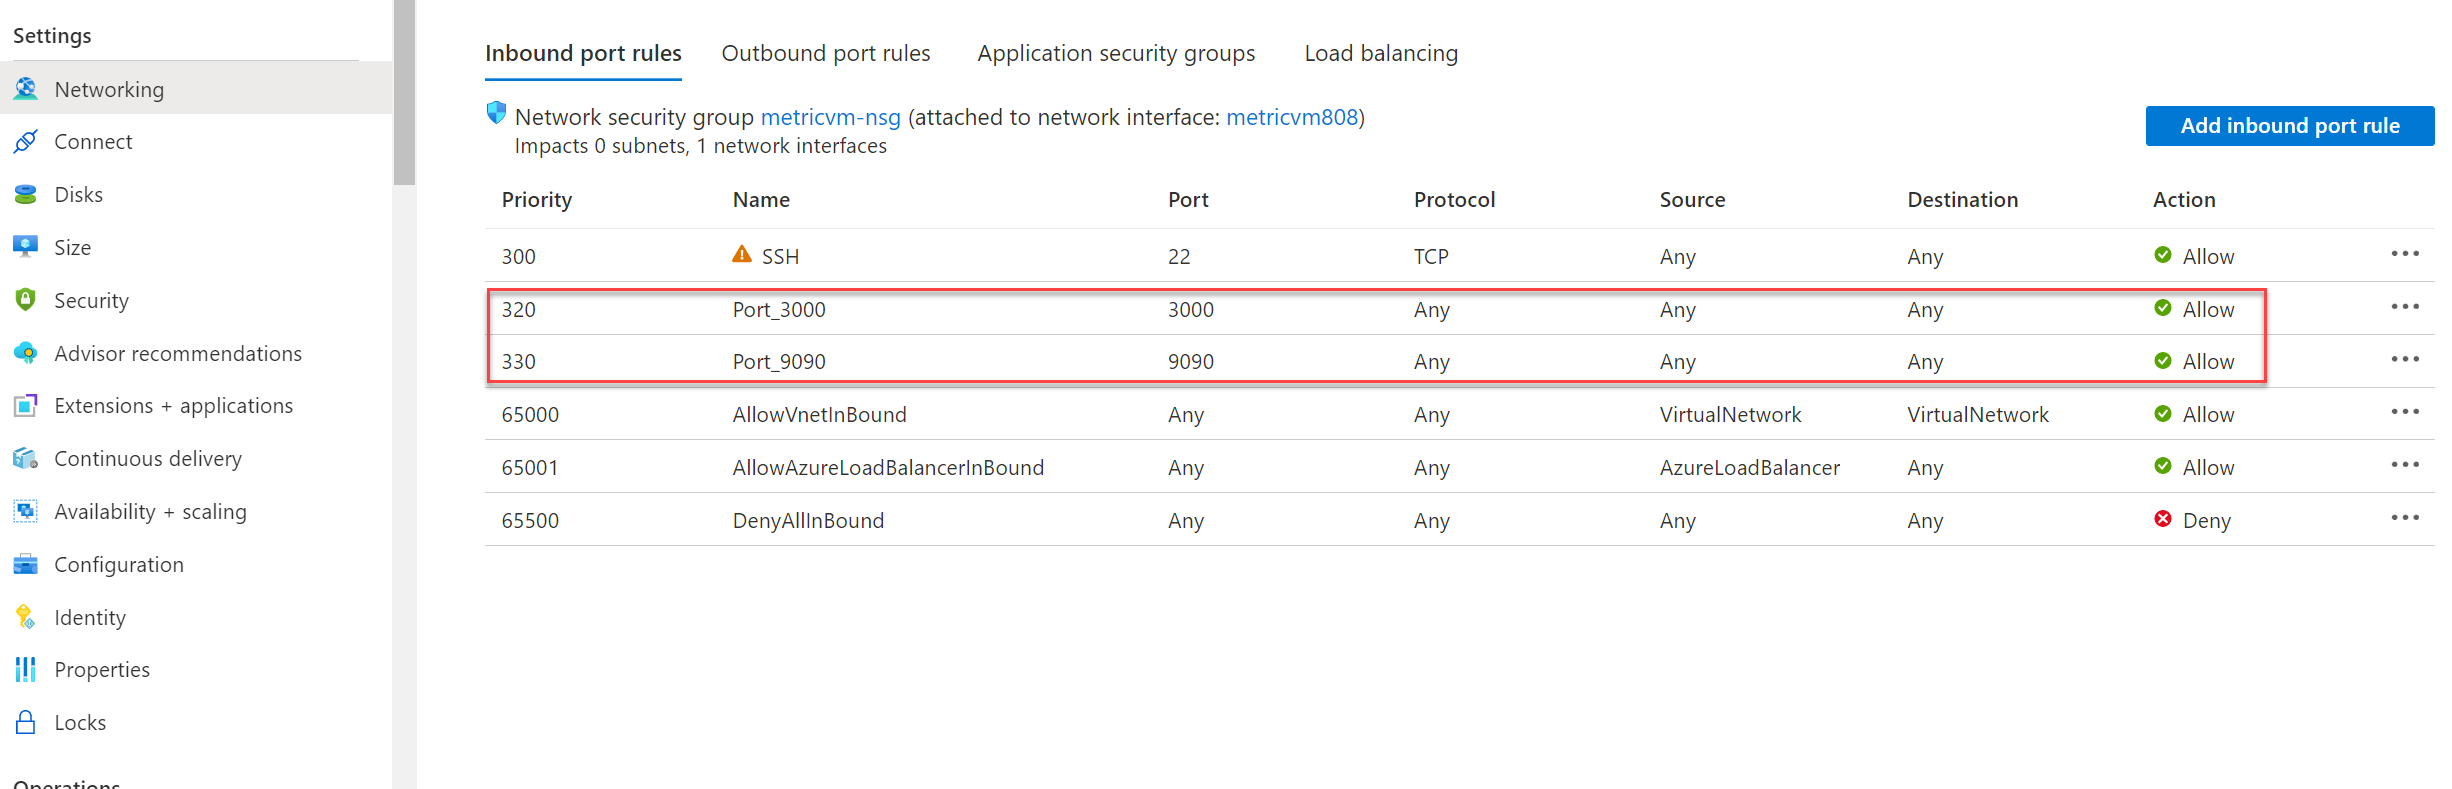
Connect to your Ubuntu server by using the Azure CLI or your preferred client tool to connect via Secure Shell.
After you connect to the VM, install the metrics collector software. First, download and unzip the files:
 #install unzip utility (if not already installed)
 sudo apt install unzip

 #get dashboards
 wget https://github.com/datastax/metric-collector-for-apache-cassandra/releases/download/v0.3.0/datastax-mcac-dashboards-0.3.0.zip -O temp.zip
 unzip temp.zip
Next, go to the Prometheus directory and use
vito edit thetg_mcac.jsonfile:cd */prometheus vi tg_mcac.jsonAdd the IP addresses of each node in your cluster in
targets, each with port 9443. Yourtg_mcac.jsonfile should look like the following example:[ { "targets": [ "10.9.0.6:9443","10.9.0.7:9443","10.9.0.8:9443" ], "labels": { } } ]Save the file. Next, edit the
prometheus.yamlfile in the same directory. Locate the following section:file_sd_configs: - files: - 'tg_mcac.json'Directly underneath this section, add the following snippet. This step is required because metrics are exposed via HTTPS.
scheme: https tls_config: insecure_skip_verify: trueThe file should now look like the following example. Ensure that the tabs on each line match the example:
file_sd_configs: - files: - 'tg_mcac.json' scheme: https tls_config: insecure_skip_verify: trueSave the file. Now you can start Prometheus and Grafana. First, install Docker:
sudo apt install apt-transport-https ca-certificates curl software-properties-common
curl -fsSL https://download.docker.com/linux/ubuntu/gpg | sudo apt-key add -
sudo add-apt-repository "deb [arch=amd64] https://download.docker.com/linux/ubuntu `lsb_release -cs` test"
sudo apt update
sudo apt install docker-ce
Then install
docker-compose:sudo apt install docker-composeNow go to the top-level directory where
docker-compose.yamlis located, and start the application:cd .. sudo docker-compose upPrometheus should be available at port
9090and Grafana dashboards on port3000on your metrics server.
Related content
In this article, you learned how to configure dashboards to visualize metrics in Prometheus by using Grafana. Learn more about Azure Managed Instance for Apache Cassandra with the following articles: