Note
Access to this page requires authorization. You can try signing in or changing directories.
Access to this page requires authorization. You can try changing directories.
Azure Managed Instance for Apache Cassandra is a fully managed service for pure open-source Apache Cassandra clusters. The service also allows configurations to be overridden, depending on the specific needs of each workload. This feature allows maximum flexibility and control where needed. This article provides tips on how to optimize performance.
Optimal setup and configuration
Replication factor, number of disks, number of nodes, and product tiers
Azure supports three availability zones in most regions. Azure Managed Instance for Apache Cassandra maps availability zones to racks. We recommend that you choose a partition key with high cardinality to avoid hot partitions. For the best level of reliability and fault tolerance, we highly recommend that you configure a replication factor of 3. We also recommend that you specify a multiple of the replication factor as the number of nodes. For example, use 3, 6, 9, etc.
Azure uses a RAID 0 over the number of disks that you provision. To get the optimal input/ouput operations per second (IOPS), check for the maximum IOPS on the product tier that you chose together with the IOPS of a P30 disk. For example, the Standard_DS14_v2 product tier supports 51,200 uncached IOPS. A single P30 disk has a base performance of 5,000 IOPS. Four disks lead to 20,000 IOPS, which is well below the limits of the machine.
We strongly recommend extensive benchmarking of your workload against the product tier and number of disks. Benchmarking is especially important for product tiers with only eight cores. Our research shows that eight-core CPUs work for only the least-demanding workloads. Most workloads need a minimum of 16 cores to perform properly.
Analytical vs. transactional workloads
Transactional workloads typically need a datacenter optimized for low latency. Analytical workloads often use more complex queries, which take longer to run. In most cases, you want separate datacenters with:
- One optimized for low latency.
- One optimized for analytical workloads.
Optimize for analytical workloads
We recommend that you apply the following cassandra.yaml settings for analytical workloads. For more information about how to apply these settings, see Update Cassandra configuration.
Timeouts
| Value | Cassandra MI default | Recommendation for analytical workload |
|---|---|---|
read_request_timeout_in_ms |
5,000 | 10,000 |
range_request_timeout_in_ms |
10,000 | 20,000 |
counter_write_request_timeout_in_ms |
5,000 | 10,000 |
cas_contention_timeout_in_ms |
1,000 | 2,000 |
truncate_request_timeout_in_ms |
60,000 | 120,000 |
slow_query_log_timeout_in_ms |
500 | 1,000 |
roles_validity_in_ms |
2,000 | 120,000 |
permissions_validity_in_ms |
2,000 | 120,000 |
Caches
| Value | Cassandra MI default | Recommendation for analytical workload |
|---|---|---|
file_cache_size_in_mb |
2,048 | 6,144 |
More recommendations
| Value | Cassandra MI default | Recommendation for analytical workload |
|---|---|---|
commitlog_total_space_in_mb |
8,192 | 16,384 |
column_index_size_in_kb |
64 | 16 |
compaction_throughput_mb_per_sec |
128 | 256 |
Client settings
We recommend that you boost Cassandra client driver timeouts in accordance with the timeouts applied on the server.
Optimize for low latency
Our default settings are already suitable for low-latency workloads. To ensure best performance for tail latencies, we highly recommend that you use a client driver that supports speculative execution and that you configure your client accordingly. For a Java V4 driver, a demo illustrates how this process works and how to enable the policy in this sample.
Monitor for performance bottlenecks
CPU performance
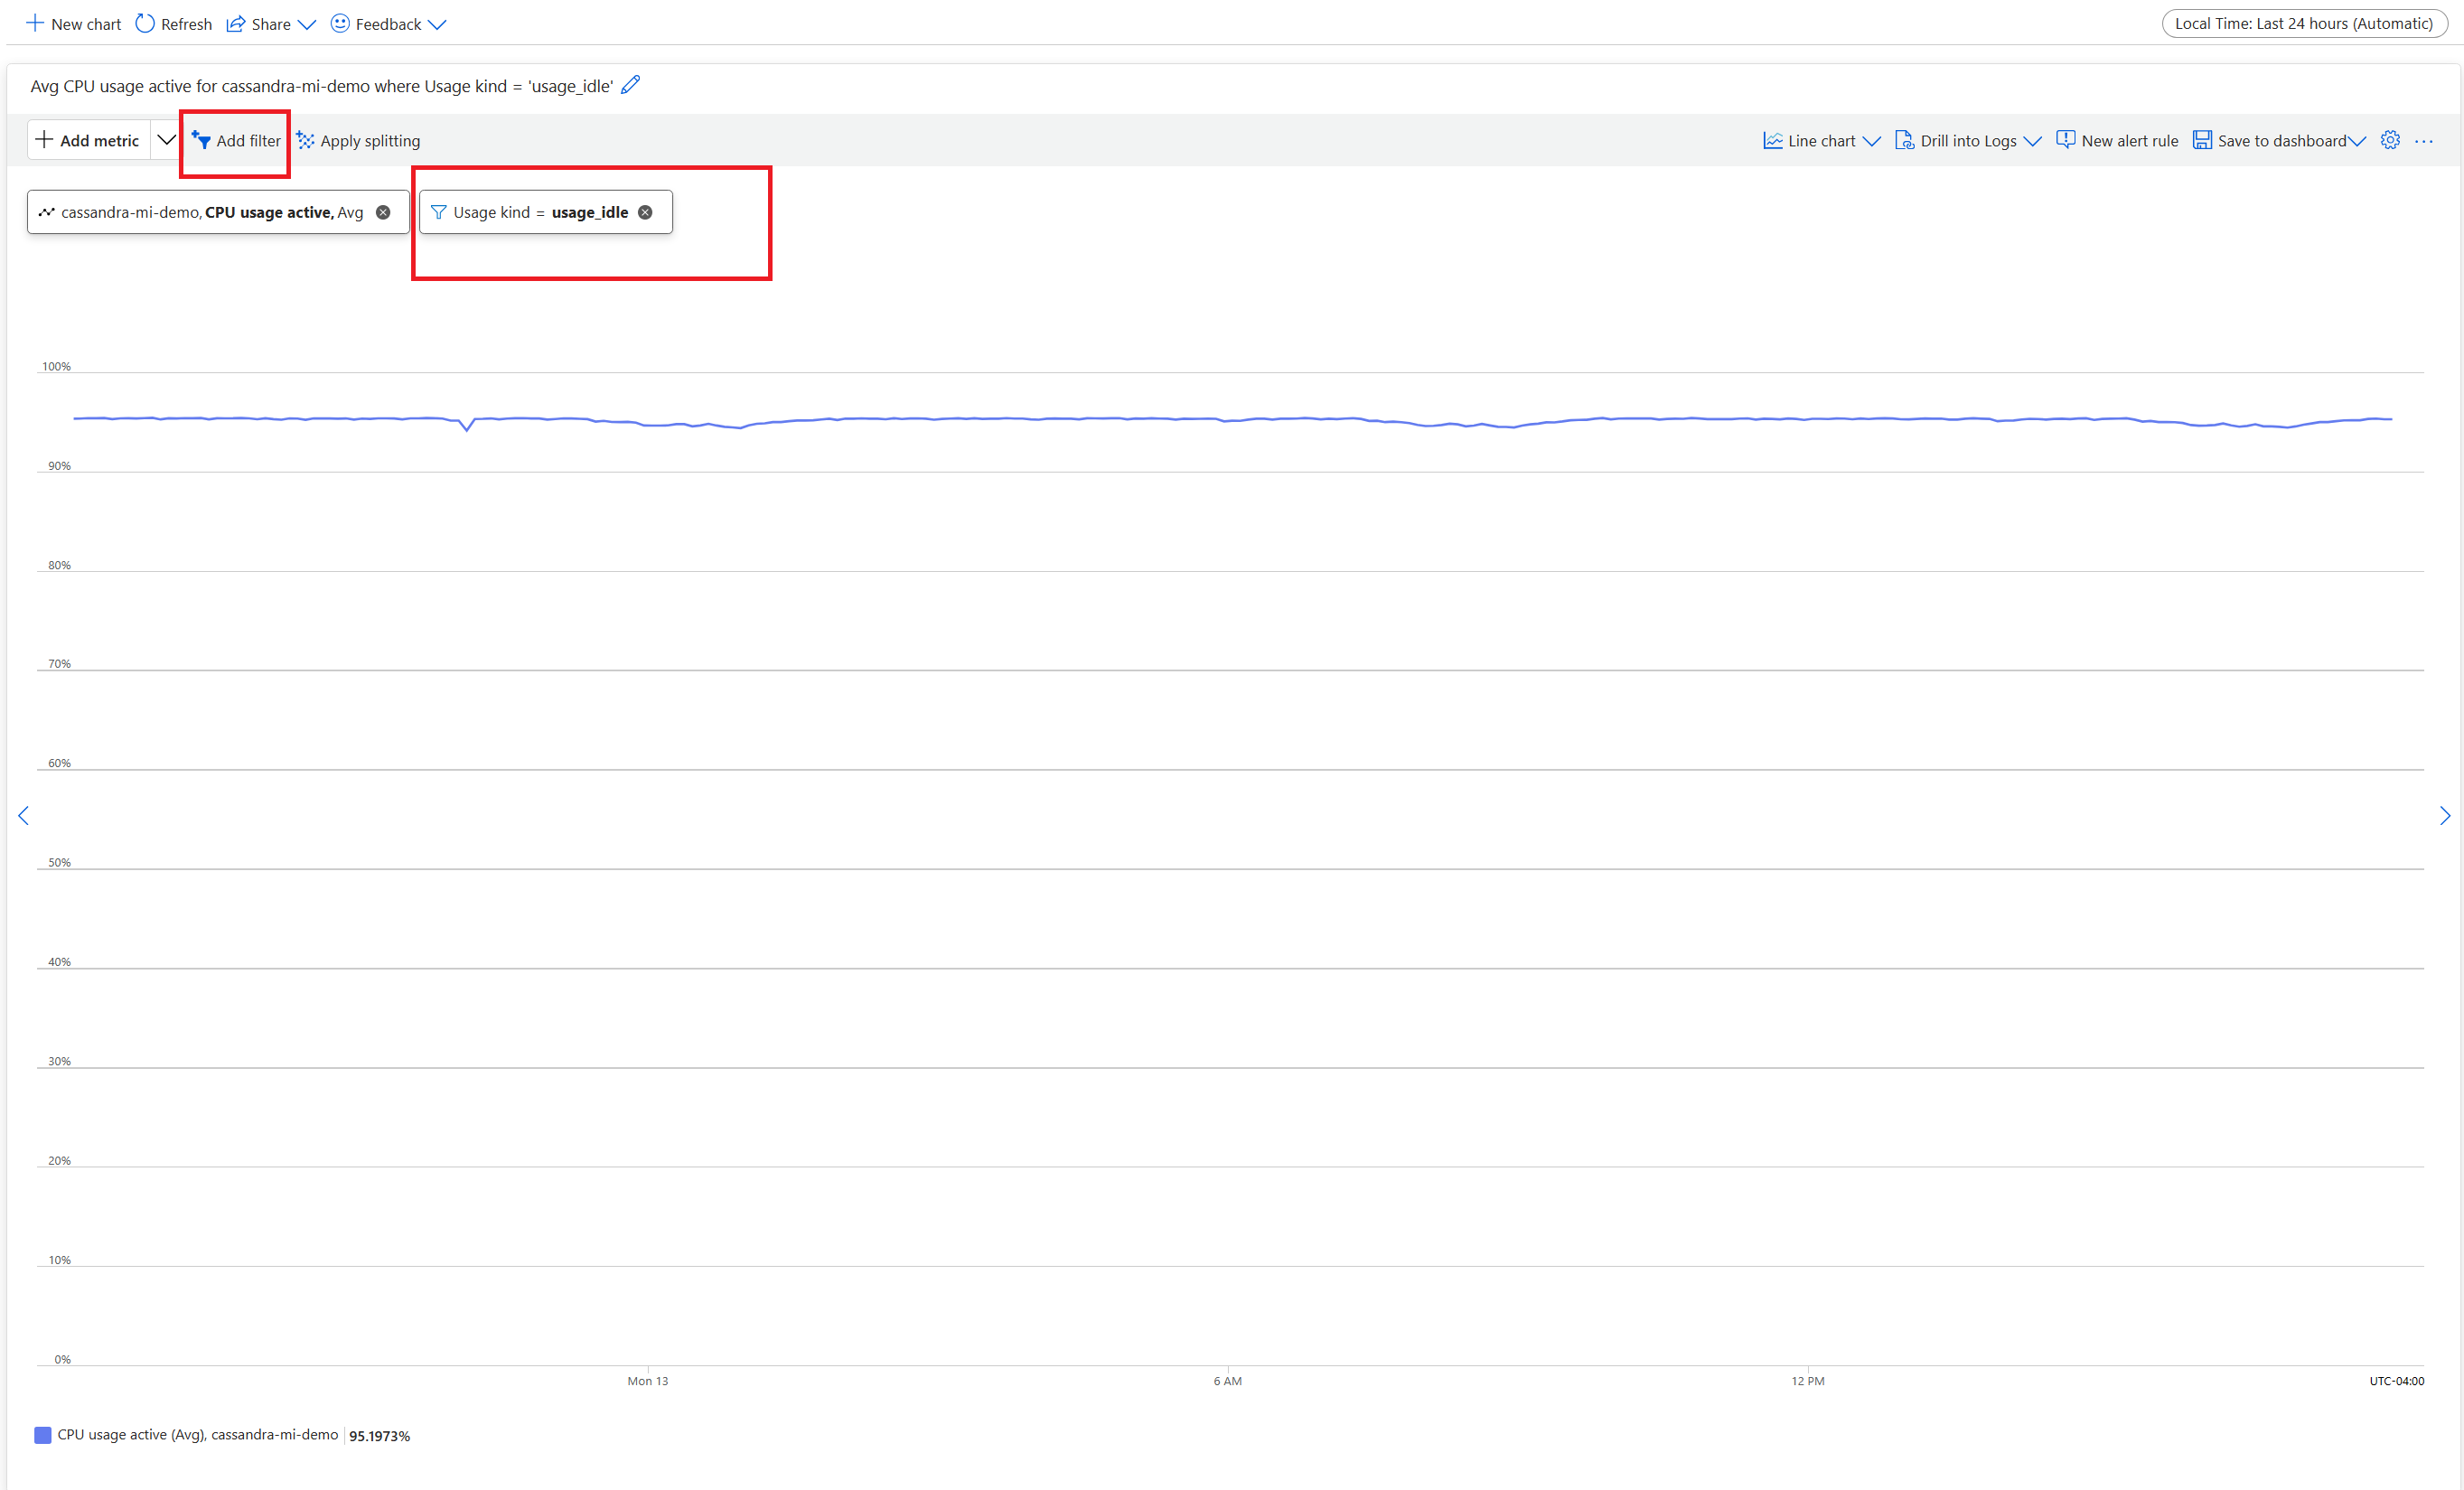
Like every database system, Cassandra works best if the CPU utilization is around 50% and never gets above 80%. To view CPU metrics, from the Azure portal, under the Monitoring section, open the Metrics tab.
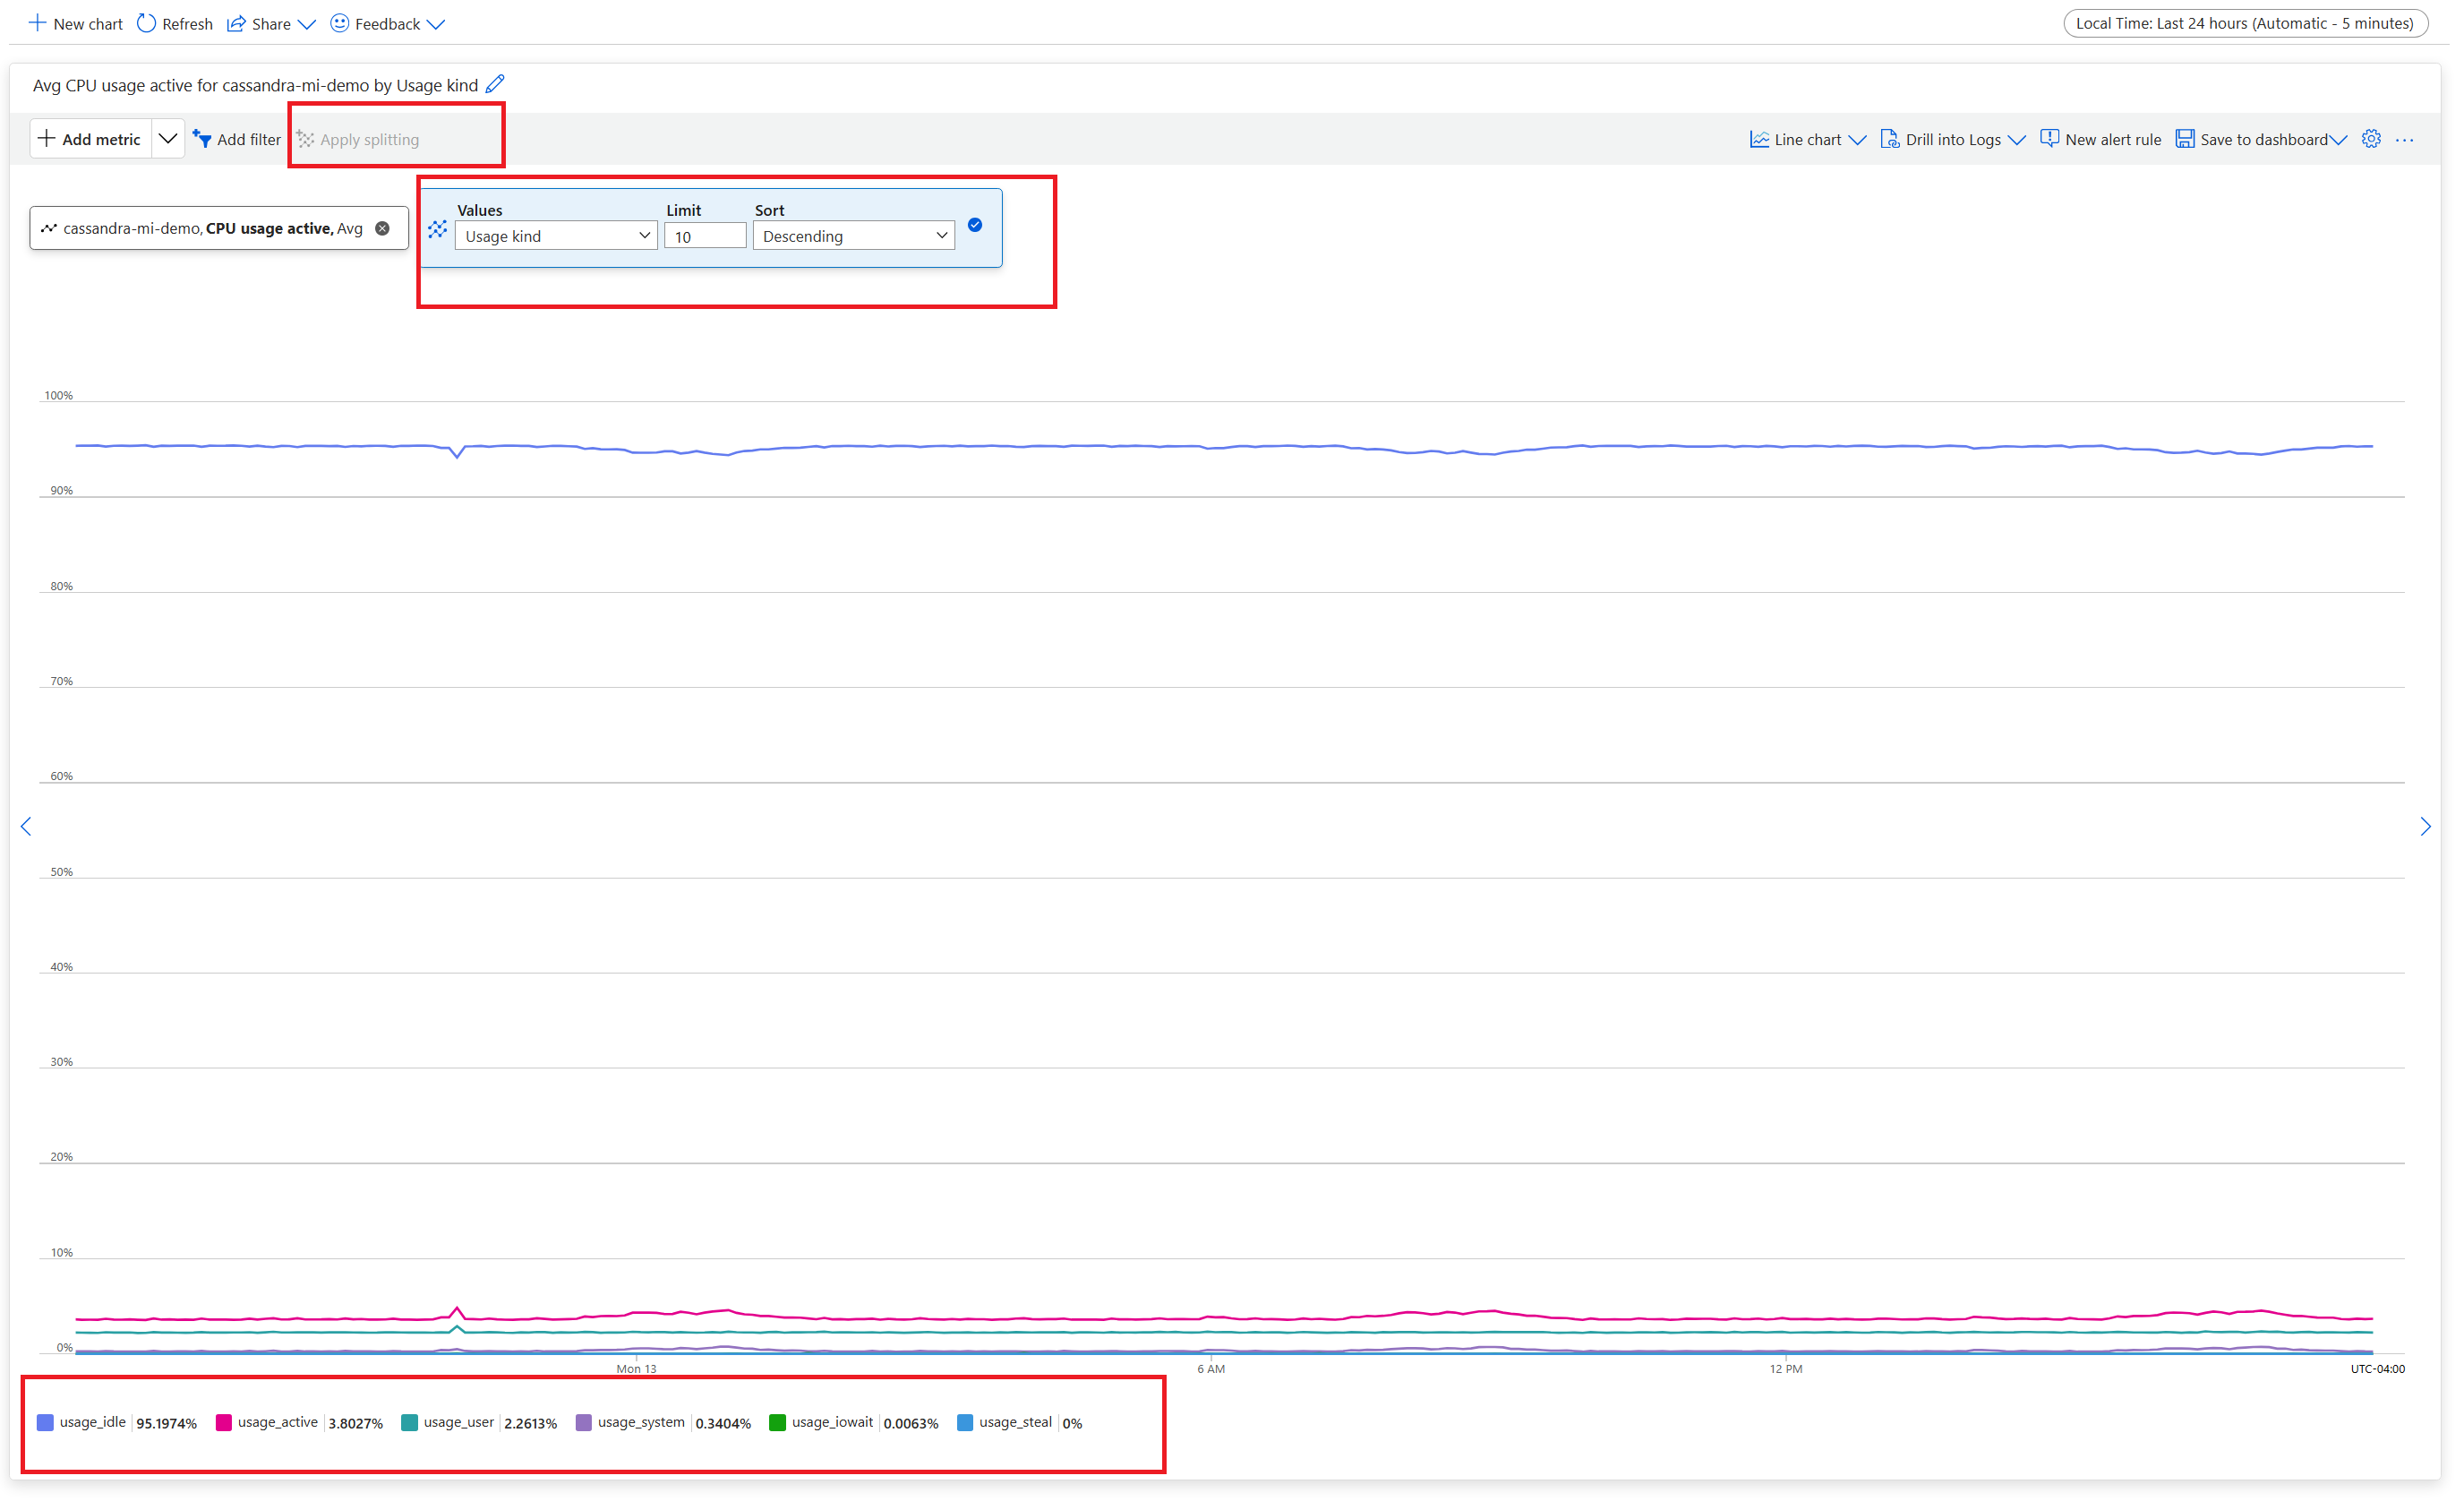
For a realistic CPU view, add a filter and use Usage kind=usage_idle to split the property. If this value is lower than 20%, apply splitting to obtain usage by all usage kinds.
If the CPU is permanently above 80% for most nodes, the database becomes overloaded, which manifests in multiple client timeouts. In this scenario, we recommend that you take the following actions:
- Vertically scale up to a product tier with more CPU cores, especially if the cores are only 8 or less.
- Horizontally scale by adding more nodes. As mentioned earlier, the number of nodes should be a multiple of the replication factor.
If the CPU is high for only a few nodes, but low for the others, it indicates a hot partition. This scenario needs further investigation.
Changing the product tier is supported by using the Azure portal, the Azure CLI, and Azure Resource Manager template (ARM template) deployment. You can deploy or edit an ARM template and replace the product tier with one of the following values:
Standard_E8s_v4Standard_E16s_v4Standard_E20s_v4Standard_E32s_v4Standard_DS13_v2Standard_DS14_v2Standard_D8s_v4Standard_D16s_v4Standard_D32s_v4Standard_L8s_v3Standard_L16s_v3Standard_L32s_v3Standard_L8as_v3Standard_L16as_v3Standard_L32as_v3
Currently, we don't support transitioning across product families. For instance, if you currently possess a Standard_DS13_v2 and want to upgrade to a larger product, such as Standard_DS14_v2, this option isn't available. Open a support ticket to request an upgrade to the higher product.
Disk performance
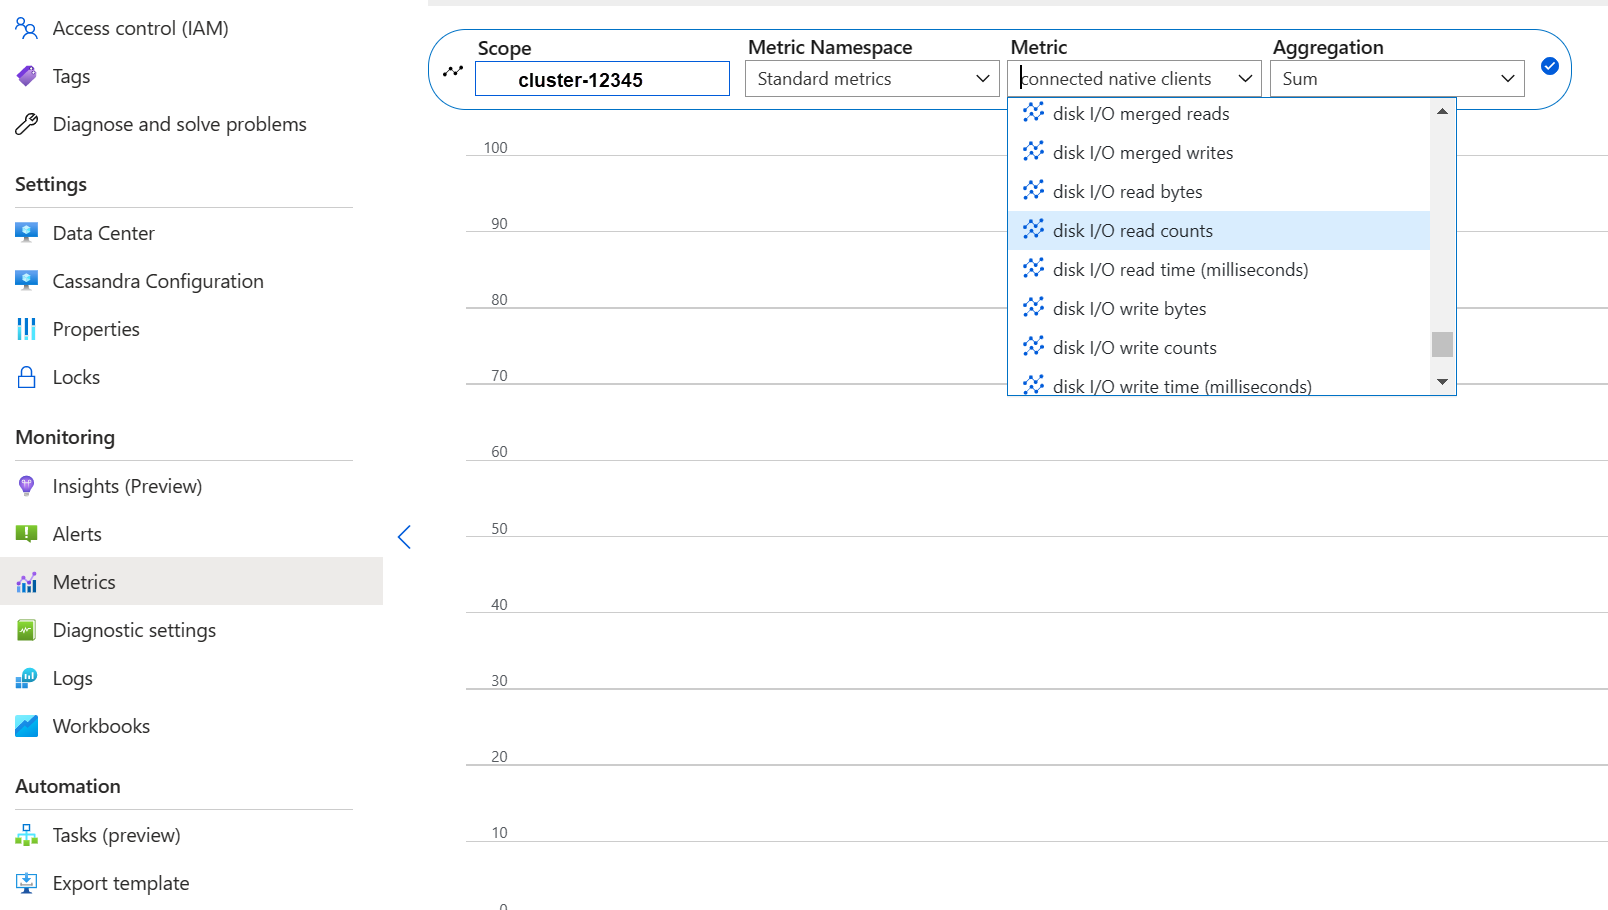
The service runs on Azure P30 managed disks, which allow for burst IOPS. Careful monitoring is required when it comes to disk-related performance bottlenecks. In this case, it's important to review the IOPS metrics.
If metrics show one or all of the following characteristics, you might need to scale up:
- Your metrics are consistently higher than or equal to the base IOPS. Remember to multiply 5,000 IOPS by the number of disks per node to get the number.
- Your metrics are consistently higher than or equal to the maximum IOPS allowed for the product tier for writes.
- Your product tier supports cached storage (write-through cache), and this number is smaller than the IOPS from the managed disks. This value is the upper limit for your read IOPS.
If you see the IOPS elevated for only a few nodes, you might have a hot partition and need to review your data for a potential skew.
If your IOPSs are lower than what your product tier supports, but higher or equal to the disk IOPS, take the following actions:
- Add more disks to increase performance. You need to raise a support case to increase disks.
- Add more nodes to scale up the datacenters.
If your IOPS reach the upper limit that your product tier supports, you can:
- Scale up to a different product tier that supports more IOPS.
- Add more nodes to scale up the datacenters.
For more information, see Virtual machine and disk performance.
Network performance
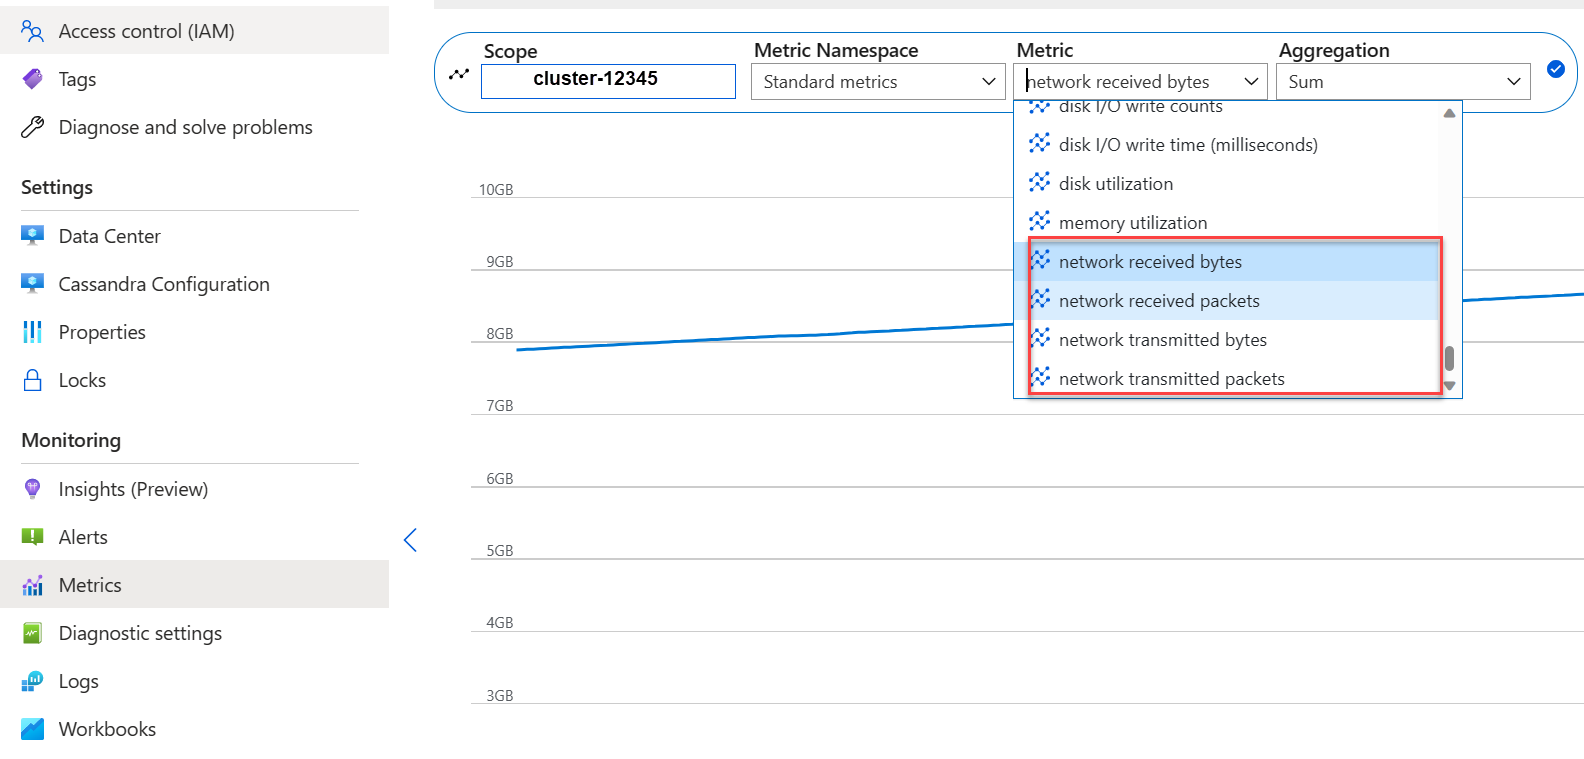
Typically, network performance is sufficient. If you stream data frequently, such as frequent horizontal scale-up/scale-down, or there are huge ingress/egress data movements, this performance can become a problem. You might need to evaluate the network performance of your product tier. For example, the Standard_DS14_v2 product tier supports 12,000 Mb/s. Compare this value to the byte-in/out in the metrics.
If you see the network elevated for only a few nodes, you might have a hot partition. Review your data distribution and access patterns for a potential skew.
- Vertically scale up to a different product tier by supporting more network I/O.
- Horizontally scale up the cluster by adding more nodes.
Too many connected clients
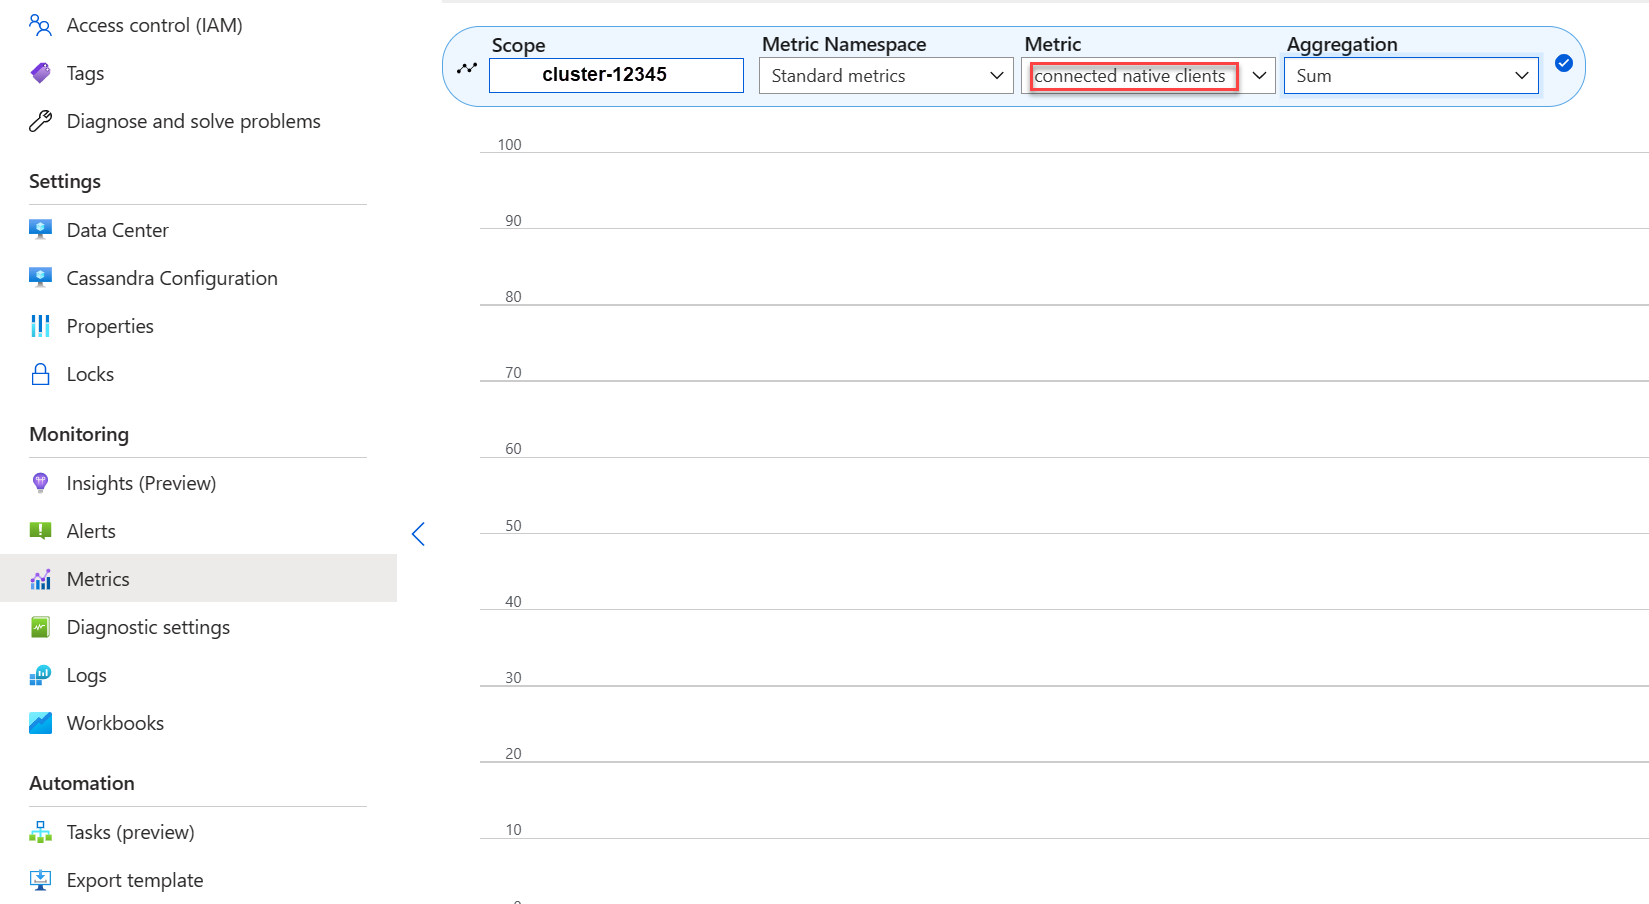
Plan and provision deployments to support the maximum number of parallel requests that are required for the desired latency of an application. For a specific deployment, introducing more load to the system above a minimum threshold increases overall latency. Monitor the number of connected clients to ensure that this situation doesn't exceed tolerable limits.
Disk space
In most cases, there's sufficient disk space. Default deployments are optimized for IOPS, which leads to low utilization of the disk. Nevertheless, we recommend that you occasionally review disk space metrics. Cassandra accumulates numerous disks and then reduces them when compaction is triggered. It's important to review disk usage over longer periods to establish trends, like when compaction is unable to recoup space.
Note
To ensure available space for compaction, keep disk utilization to around 50%.
If you see this behavior for only a few nodes, you might have a hot partition. Review your data distribution and access patterns for a potential skew.
- Add more disks, but be mindful of the IOPS limits imposed by your product tier.
- Horizontally scale up the cluster.
JVM memory
Our default formula assigns half the virtual machine's memory to the Java Virtual Machine (JVM) with an upper limit of 31 GB. In most cases, this approach is a good balance between performance and memory. Some workloads, especially ones that have frequent cross-partition reads or range scans, might be memory challenged.
In most cases, memory gets reclaimed effectively by the Java garbage collector. If the CPU is often above 80%, there aren't enough CPU cycles for the garbage collector left. Address CPU performance problems before you check any memory problems.
If the CPU hovers below 70% and the garbage collection can't reclaim memory, you might need more JVM memory. More JVM memory might be necessary if you're on a product tier with limited memory. In most cases, you need to review your queries and client settings and reduce fetch_size along with what's chosen in limit within your Cassandra Query Language (CQL) query.
If you need more memory, you can:
- File a ticket to increase your JVM memory settings.
- Scale vertically to a product tier that has more memory available.
Tombstones
We run repairs every seven days with reaper, which removes rows whose time to live (TTL) expired. These rows are called tombstones. Some workloads delete more frequently and show warnings like Read 96 live rows and 5035 tombstone cells for query SELECT ...; token <token> (see tombstone_warn_threshold) in the Cassandra logs. Some errors indicate that a query couldn't be fulfilled because of excessive tombstones.
A short-term mitigation if queries don't get fulfilled is to increase the tombstone_failure_threshold value in the Cassandra configuration from the default 100,000 to a higher value.
We also recommend that you review the TTL on the keyspace and potentially run repairs daily to clear out more tombstones. If the TTLs are short (for example, less than two days), and data flows in and gets deleted quickly, we recommend that you review the compaction strategy and favor Leveled Compaction Strategy. In some cases, such actions might indicate that a review of the data model is required.
Batch warnings
You might encounter the following warning in CassandraLogs and potentially related failures:
Batch for [<table>] is of size 6.740KiB, exceeding specified threshold of 5.000KiB by 1.740KiB.
Review your queries to stay below the recommended batch size. In rare cases and as a short-term mitigation, increase batch_size_fail_threshold_in_kb in the Cassandra configuration from the default of 50 to a higher value.
Large partition warning
You might encounter the following warning in CassandraLogs:
Writing large partition <table> (105.426MiB) to sstable <file>
This message indicates a problem in the data model. For more information, see this Stack Overflow article. This problem can cause severe performance issues and must be addressed.
Specialized optimizations
Compression
Cassandra allows the selection of an appropriate compression algorithm when a table is created. The default is LZ4, which is excellent for throughput and CPU but consumes more space on disk. Using Zstandard (Cassandra 4.0 and up) saves about 12% space with minimal CPU overhead.
Optimize memtable heap space
The default is to use one quarter of the JVM heap for memtable_heap_space in the cassandra.yaml file. For write-oriented applications or on product tiers with small amounts of memory, this issue can lead to frequent flushing and fragmented sstables, which require more compaction. Increasing to at least 4,048 might be good. This approach requires careful benchmarking to make sure that other operations (for example, reads) aren't affected.
