Note
Access to this page requires authorization. You can try signing in or changing directories.
Access to this page requires authorization. You can try changing directories.
In this article, you complete the steps to configure and use the container network logs feature in Advanced Container Networking Services for Azure Kubernetes Service (AKS). These logs offer persistent network flow monitoring tailored to enhance visibility in containerized environments.
By capturing container network logs, you can effectively track network traffic, detect anomalies, optimize performance, and ensure compliance with established policies. Follow the detailed instructions provided to set up and integrate container network logs for your system. For more information about the container network logs feature, see Overview of container network logs.
Prerequisites
- An Azure account with an active subscription. If you don't have one, create a free account before you begin.
Use the Bash environment in Azure Cloud Shell. For more information, see Get started with Azure Cloud Shell.

If you prefer to run CLI reference commands locally, install the Azure CLI. If you're running on Windows or macOS, consider running Azure CLI in a Docker container. For more information, see How to run the Azure CLI in a Docker container.
If you're using a local installation, sign in to the Azure CLI by using the az login command. To finish the authentication process, follow the steps displayed in your terminal. For other sign-in options, see Authenticate to Azure using Azure CLI.
When you're prompted, install the Azure CLI extension on first use. For more information about extensions, see Use and manage extensions with the Azure CLI.
Run az version to find the version and dependent libraries that are installed. To upgrade to the latest version, run az upgrade.
The minimum version of the Azure CLI required to complete the steps in this article is 2.73.0. To find your version, run
az --versionin the Azure CLI. To install or upgrade, see Install Azure CLI.Container network logs in stored logs mode works only for Cilium data planes.
Container network logs in on-demand mode works for both Cilium and non-Cilium data planes.
If your existing cluster is <= 1.32, upgrade the cluster to the latest available Kubernetes version.
The minimum version of the
aks-previewAzure CLI extension to complete the steps in this article is18.0.0b2.
Install the aks-preview Azure CLI extension
Install or update the Azure CLI preview extension by using the az extension add or az extension update command.
# Install the aks-preview extension
az extension add --name aks-preview
# Update the extension to make sure you have the latest version installed
az extension update --name aks-preview
Configure stored logs mode for container network logs
Register the AdvancedNetworkingFlowLogsPreview feature flag
First, register the AdvancedNetworkingFlowLogsPreview feature flag by using the az feature register command:
az feature register --namespace "Microsoft.ContainerService" --name "AdvancedNetworkingFlowLogsPreview"
Verify successful registration by using the az feature show command. It takes a few minutes for registration to complete.
az feature show --namespace "Microsoft.ContainerService" --name "AdvancedNetworkingFlowLogsPreview"
When the feature shows Registered, refresh the registration of the Microsoft.ContainerService resource provider by using the az provider register command.
Limitations
- Layer 7 flow data is captured only when Layer 7 policy support is enabled. For more information, see Configure a Layer 7 policy.
- Domain Name System (DNS) flows and related metrics are captured only when a Cilium Fully Qualified Domain (FQDN) network policy is applied. For more information, see Configure an FQDN policy.
- During preview, you can configure this feature only via the Azure CLI and Azure Resource Manager templates (ARM templates). Onboarding by using Terraform isn't supported at this time.
- When Log Analytics isn't configured for log storage, container network logs are limited to a maximum of 50 MB of storage. When this limit is reached, new entries overwrite older logs.
- If the log table plan is set to Basic logs, the prebuilt Grafana dashboards don't function as expected.
- The Auxiliary logs table plan isn't supported.
Enable Advanced Container Networking Services on a new cluster
Use the az aks create command with the --enable-acns flag to create a new AKS cluster that has all Advanced Container Networking Services features. These features include:
Container Network Observability: Provides insight into your network traffic. To learn more, see Container Network Observability.
Container Network Security: Offers security features like FQDN filtering. To learn more, see Container Network Security.
# Set an environment variable for the AKS cluster name. Make sure you replace the placeholder with your own value.
export CLUSTER_NAME="<aks-cluster-name>"
export RESOURCE_GROUP="<aks-resource-group>"

# Create an AKS cluster
az aks create \
    --name $CLUSTER_NAME \
    --resource-group $RESOURCE_GROUP \
    --generate-ssh-keys \
    --location uksouth \
    --max-pods 250 \
    --network-plugin azure \
    --network-plugin-mode overlay \
    --network-dataplane cilium \
    --node-count 2 \
    --pod-cidr 192.168.0.0/16 \
    --kubernetes-version 1.32 \
    --enable-acns
Configure custom resources for log filtering
To configure container network logs in stored logs mode, you must define specific custom resources to set filters for logs collection. When at least one custom resource is defined, logs are collected and stored on the host node at /var/log/acns/hubble/events.log.
To configure logging, you must define and apply the RetinaNetworkFlowLog type of custom resource. You set filters like namespace, pod, service, port, protocol, and verdict. Multiple custom resources can exist in a cluster simultaneously. If no custom resource is defined with nonempty filters, no logs are saved in the designated location.
The following sample definition demonstrates how to configure the RetinaNetworkFlowLog type of custom resource.
RetinaNetworkFlowLog template
apiVersion: acn.azure.com/v1alpha1
kind: RetinaNetworkFlowLog
metadata:
  name: sample-retinanetworkflowlog # Cluster scoped
spec:
  includefilters: # List of filters
    - name: sample-filter # Filter name
      from:
        namespacedPod: # List of source namespace/pods. Prepend namespace with /
          - sample-namespace/sample-pod
        labelSelector: # Standard k8s label selector
          matchLabels:
            app: frontend
            k8s.io/namespace: sample-namespace
          matchExpressions:
            - key: environment
              operator: In
              values:
                - production
                - staging
        ip: # List of source IPs; can be CIDR
          - "192.168.1.10"
          - "10.0.0.1"
      to:
        namespacedPod:
          - sample-namespace2/sample-pod2
        labelSelector:
          matchLabels:
            app: backend
            k8s.io/namespace: sample-namespace2
          matchExpressions:
            - key: tier
              operator: NotIn
              values:
                - dev
        ip:
          - "192.168.1.20"
          - "10.0.1.1"
      protocol: # List of protocols; can be tcp, udp, dns
        - tcp
        - udp
        - dns
      verdict: # List of verdicts; can be forwarded, dropped
        - forwarded
        - dropped
The following table describes the fields in the custom resource definition:
| Field | Type | Description | Required |
|---|---|---|---|
includefilters |
[]filter | A list of filters that define network flows to include. Each filter specifies the source, destination, protocol, and other matching criteria. Include filters can't be empty and must have at least one filter. | Mandatory |
filters.name |
String | The name of the filter. | Optional |
filters.protocol |
[]string | The protocols to match for this filter. Valid values are tcp, udp, and dns. Because it's an optional parameter, if it isn't specified, logs with all protocols are included. |
Optional |
filters.verdict |
[]string | The verdict of the flow to match. Valid values are forwarded and dropped. Because it's an optional parameter, if it isn't specified, logs with all verdicts are included. |
Optional |
filters.from |
Endpoint | Specifies the source of the network flow. Can include IP addresses, label selectors, and namespace/pod pairs. | Optional |
Endpoint.ip |
[]string | It can be a single IP or a CIDR. | Optional |
Endpoint.labelSelector |
Object | A label selector is a mechanism to filter and query resources based on labels, so you can identify specific subsets of resources. A label selector can include two components: matchLabels and matchExpressions. Use matchLabels for straightforward matching by specifying a key/value pair (for example, {"app": "frontend"}). For more advanced criteria, use matchExpressions, where you define a label key, an operator (such as In, NotIn, Exists, or DoesNotExist), and an optional list of values. Ensure that the conditions in both matchLabels and matchExpressions are met, because they're logically combined by AND. If no conditions are specified, the selector matches all resources. To match none, leave the selector null. Carefully define your label selector to target the correct set of resources. |
Optional |
Endpoint.namespacedPod |
[]string | A list of namespace and pod pairs (formatted as namespace/pod) for matching the source. name should match the RegEx pattern ^.+$. |
Optional |
filters.to |
Endpoint | Specifies the destination of the network flow. Can include IP addresses, label selectors, or namespace/pod pairs. | Optional |
Endpoint.ip |
[]string | It can be a single IP or a CIDR. | Optional |
Endpoint.labelSelector |
Object | A label selector to match resources based on their labels. | Optional |
Endpoint.namespacedPod |
[]string | A list of namespace and pod pairs (formatted as namespace/pod) to match the destination. |
Optional |
Apply the
RetinaNetworkFlowLogcustom resource to enable log collection at the cluster:kubectl apply -f <crd.yaml>
Logs stored locally on host nodes are temporary because the host or node itself isn't a persistent storage solution. Also, logs on host nodes are rotated when their size reaches 50 MB. For longer-term storage and analysis, we recommend that you configure the Azure Monitor Agent on the cluster to collect and retain logs in the Log Analytics workspace.
Alternatively, you can integrate a partner logging service like an OpenTelemetry collector for more log management options.
Configure the Azure Monitor Agent to scrape logs in the Log Analytics workspace for a new cluster (in managed storage)
# Set an environment variable for the AKS cluster name. Make sure you replace the placeholder with your own value.
  export CLUSTER_NAME="<aks-cluster-name>"
  export RESOURCE_GROUP="<aks-resource-group>"

# Enable azure monitor with high log scale mode
    ### To use the default Log Analytics workspace
    az aks enable-addons -a monitoring --enable-high-log-scale-mode -g $RESOURCE_GROUP -n $CLUSTER_NAME

    ### To use an existing Log Analytics workspace
    az aks enable-addons -a monitoring --enable-high-log-scale-mode -g $RESOURCE_GROUP -n $CLUSTER_NAME --workspace-resource-id <workspace-resource-id>

# Update the AKS cluster with the enable-retina-flow-logs flag
  az aks update --enable-acns \
    --enable-retina-flow-logs \
    -g $RESOURCE_GROUP \
    -n $CLUSTER_NAME
Note
When enabled, container network flow logs are written to /var/log/acns/hubble/events.log when the RetinaNetworkFlowLog custom resource is applied. If Log Analytics integration is enabled later, the Azure Monitor Agent begins collecting logs at that point. Logs older than two minutes aren't ingested. Only new entries that are appended after monitoring begins are collected in a Log Analytics workspace.
Configure an existing cluster to store logs in a Log Analytics workspace
To enable container network logs on an existing cluster:
Check whether monitoring addons is already enabled on that cluster:
az aks addon list -g $RESOURCE_GROUP -n $CLUSTER_NAMEIf monitoring addons is enabled, disable monitoring addons:
az aks disable-addons -a monitoring -g $RESOURCE_GROUP -n $CLUSTER_NAMEYou complete this step because monitoring addons might already be enabled, but not for high scale. For more information, see High-scale mode.
Set Azure Monitor to
enable-high-log-scale-mode:### Use default Log Analytics workspace az aks enable-addons -a monitoring --enable-high-log-scale-mode -g $RESOURCE_GROUP -n $CLUSTER_NAME ### Use existing Log Analytics workspace az aks enable-addons -a monitoring --enable-high-log-scale-mode -g $RESOURCE_GROUP -n $CLUSTER_NAME --workspace-resource-id <workspace-resource-id>Update the AKS cluster with the
enable-retina-flow-logsflag:az aks update --enable-acns \ --enable-retina-flow-logs \ -g $RESOURCE_GROUP \ -n $CLUSTER_NAME
Get cluster credentials
Get your cluster credentials by using the az aks get-credentials command:
az aks get-credentials --name $CLUSTER_NAME --resource-group $RESOURCE_GROUP
Validate the setup
Validate that the retina network flow log capability is enabled:
az aks show -g $RESOURCE_GROUP -n $CLUSTER_NAME
Expected output:
"networkProfile":{
 "advancedNetworking": {
  "enabled": true,
  "observability":{
    "enabled": true
     }
 }
}
----------------------------
"osmagent":{
 "config":{
  "enableRetinaNetworkFlags": "True"
 }
}
Validate that the RetinaNetworkFlowLog custom resource is applied:
kubectl describe retinanetworkflowlogs <cr-name>
Expect to see a Spec node that contains Include filters and a Status node. The value for Status > State should be CONFIGURED (not FAILED).
Spec:
  Includefilters:
    From:
      Namespaced Pod:
        namespace/pod-
    Name:  sample-filter
    Protocol:
      tcp
    To:
      Namespaced Pod:
        namespace/pod-
    Verdict:
      dropped
Status:
  State:      CONFIGURED
  Timestamp:  2025-05-01T11:24:48Z
Azure Managed Grafana
If you don't have an existing Azure Managed Grafana instance, you must create one to visualize the network flow logs pre-built dashboard.
Create an Azure Managed Grafana instance
Use az grafana create to create a Managed Grafana instance. The name of the instance must be unique.
# Set an environment variable for the Managed Grafana name. Make sure that you replace the placeholder with your own value.
export GRAFANA_NAME="<grafana-name>"

# Create a Managed Grafana instance
az grafana create \
    --name $GRAFANA_NAME \
    --resource-group $RESOURCE_GROUP
Ensure that your Managed Grafana workspace can access and search all monitoring data in the relevant subscription. This step is required to access prebuilt dashboards for network flow logs.
Use case 1: If you're a subscription Owner or a User Access Administrator, when a Managed Grafana workspace is created, it comes with the Monitoring Reader role granted on all Azure Monitor data and Log Analytics resources in the subscription. The new Managed Grafana workspace can access and search all monitoring data in the subscription. It can view the Azure Monitor metrics and logs from all resources and view any logs stored in Log Analytics workspaces in the subscription.
Use case 2: If you're not a subscription Owner or User Access Administrator, or if your Log Analytics and Managed Garfana workspace are in different subscriptions, Grafana can't access Log Analytics and the subscription. The Grafana workspace must have the Monitoring Reader role in the relevant subscription to access to prebuilt Grafana dashboards. In this scenario, complete these steps to provide access:
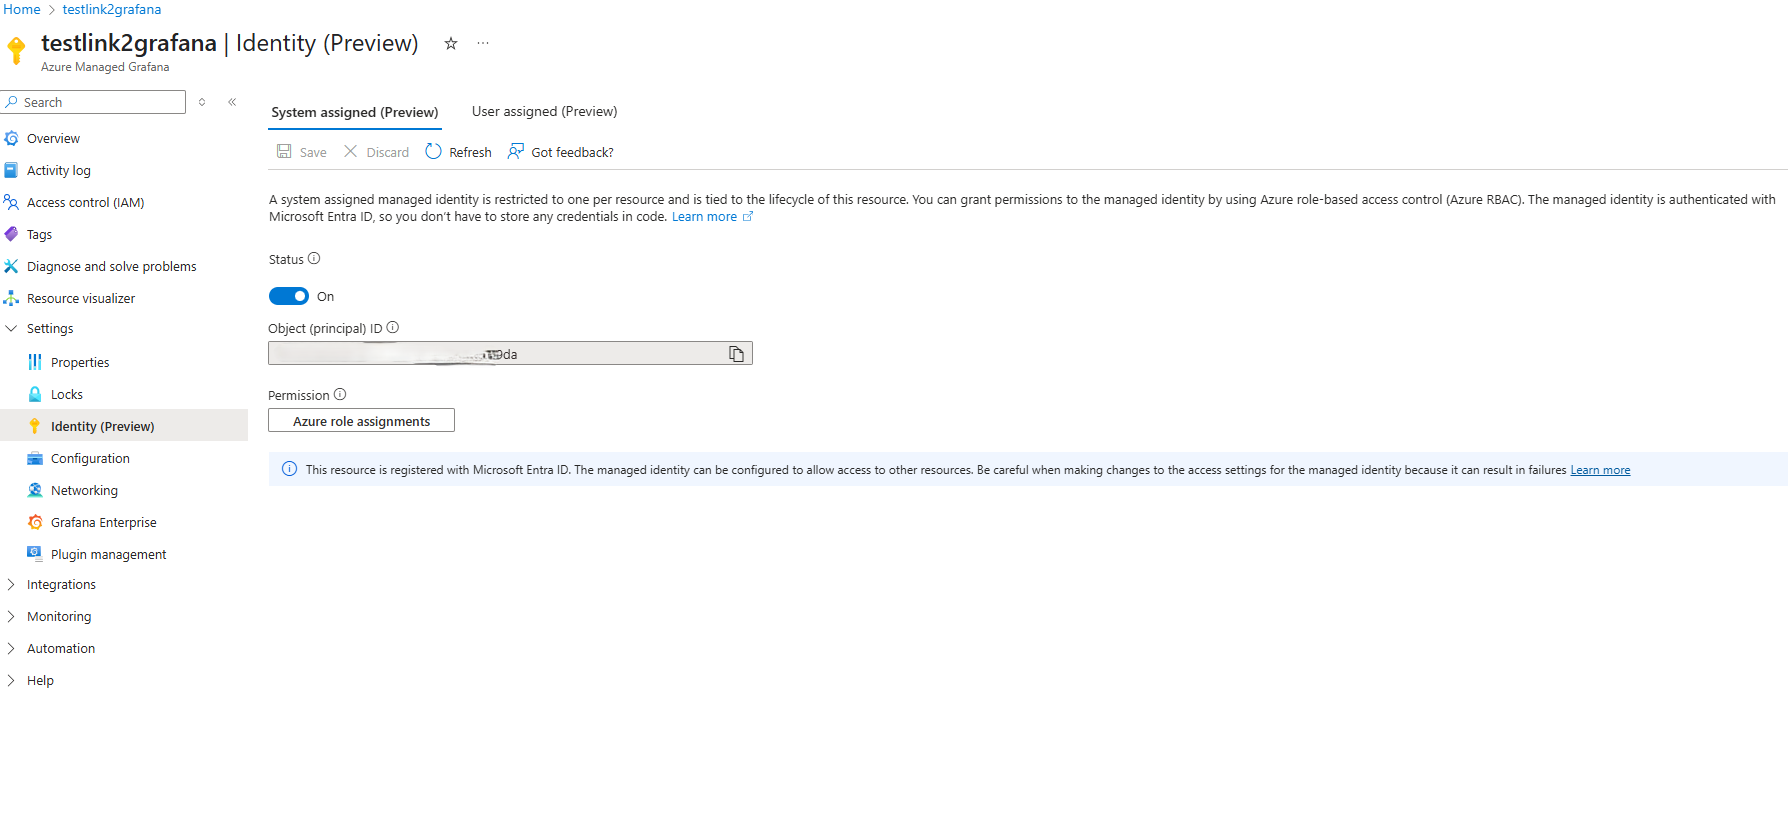
In your Managed Grafana workspace, go to Settings > Identity.
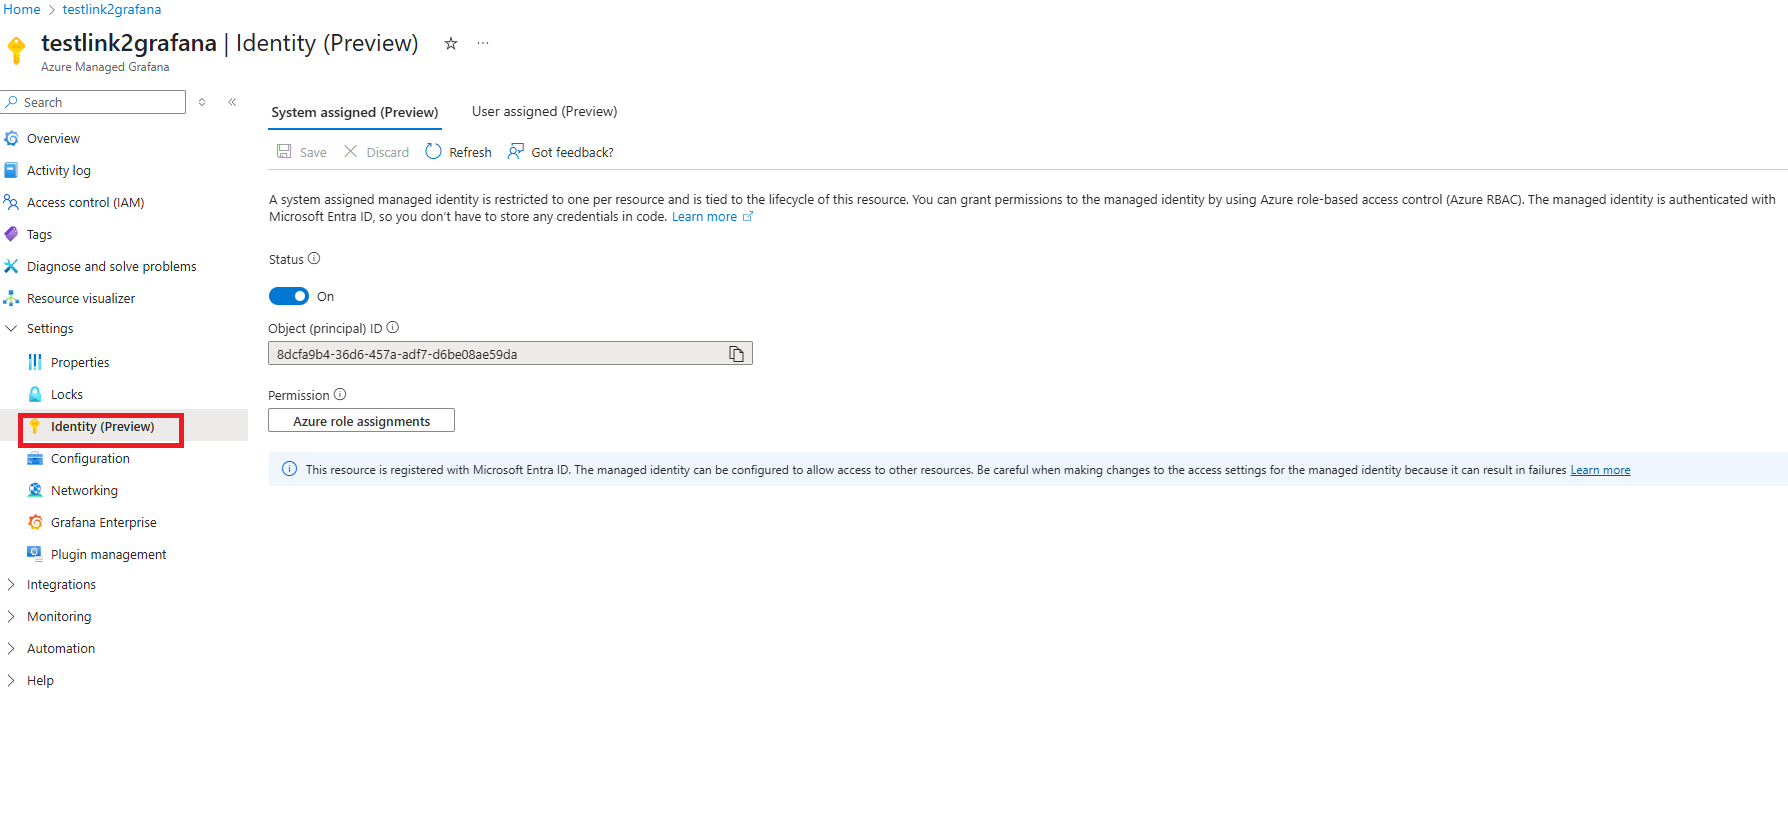
Select Azure role assignments > Add role assignments.
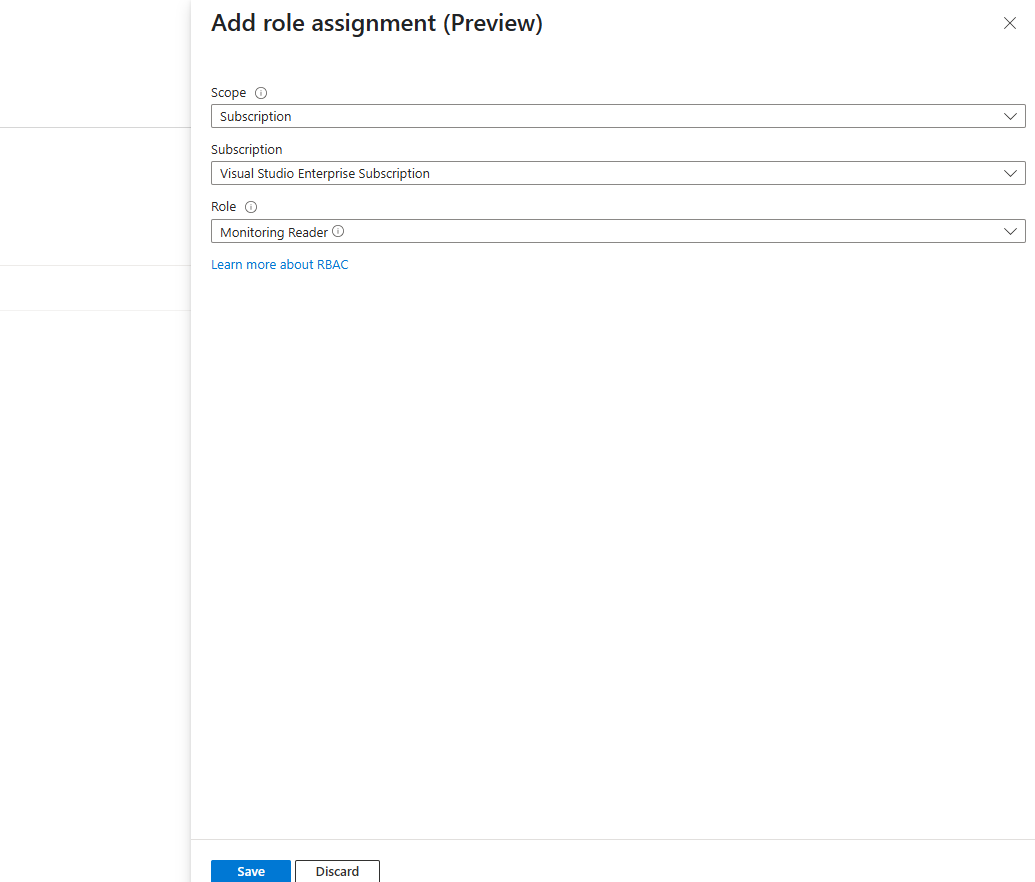
For Scope, enter Subscription. Select your subscription. Set Role to Monitoring Reader, and then select Save.
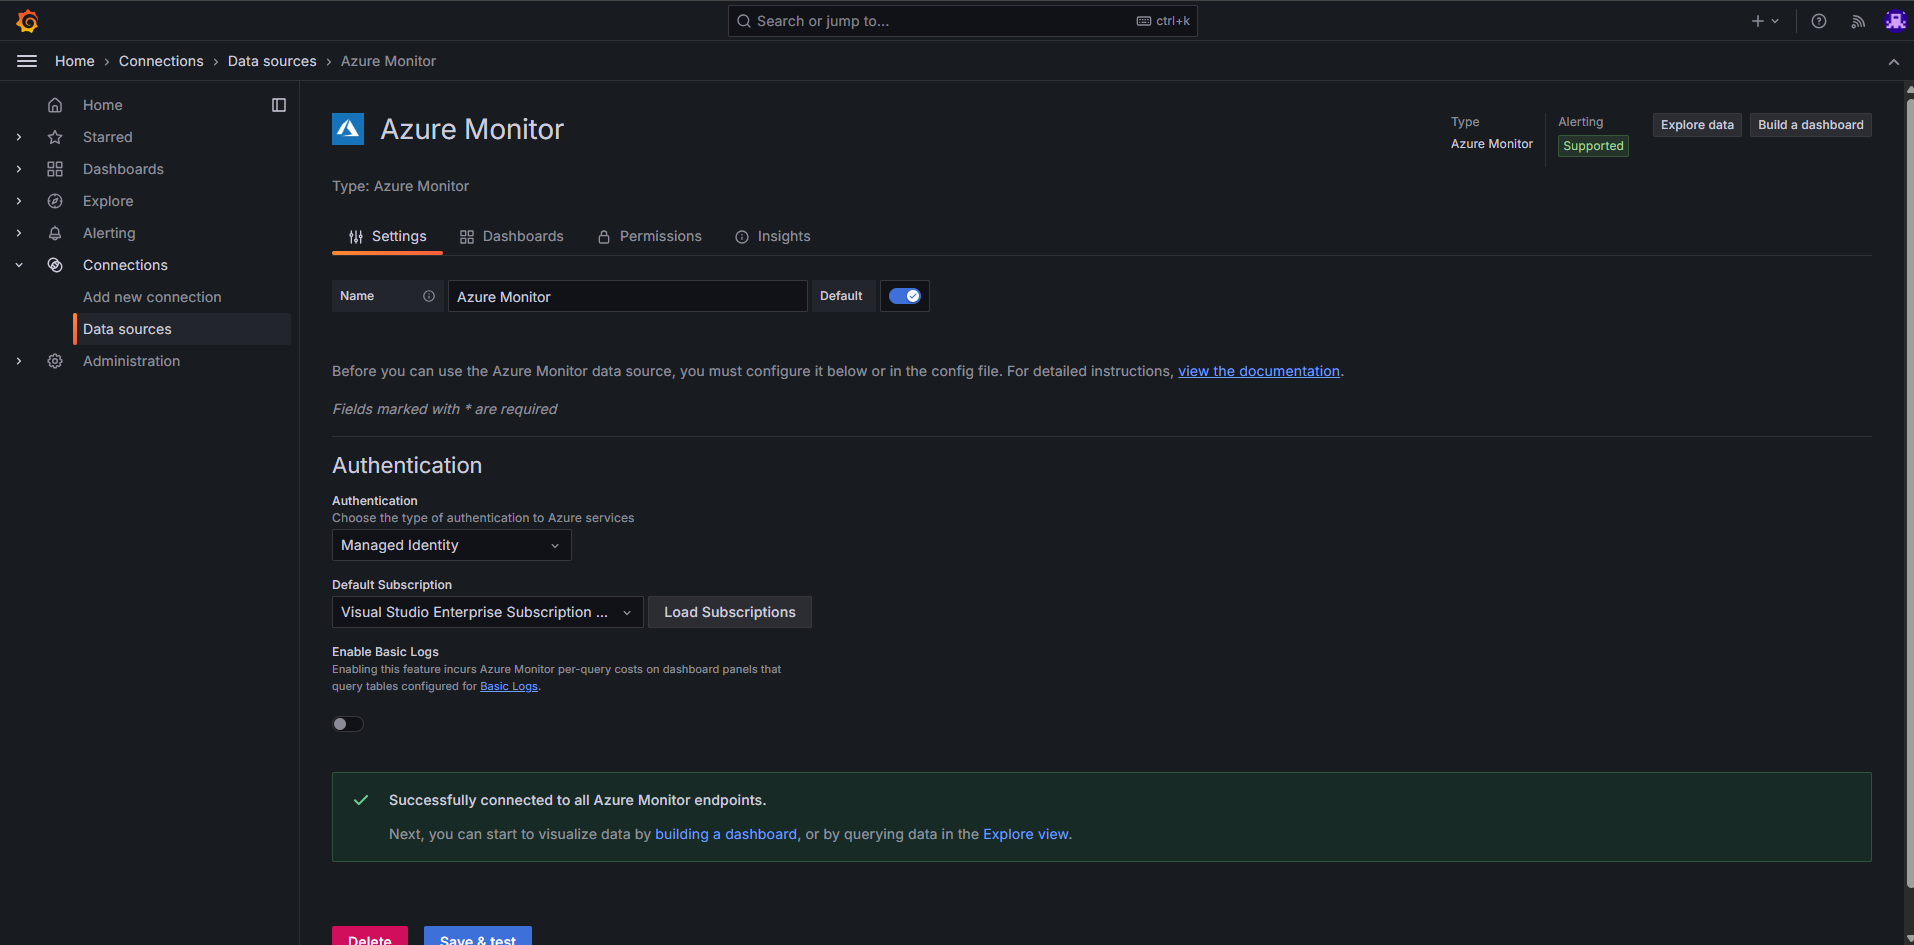
Verify the data source for the Managed Grafana instance. To verify the subscription for the data source for the Grafana dashboards, check the Data source tab in the Managed Grafana instance:


Visualization in Grafana dashboards
You can visualize container network flow logs for analysis by using two prebuilt Grafana dashboards. You can access the dashboards either through Azure Managed Grafana or in the Azure portal.
Visualization by using Azure Managed Grafana
Make sure that the Azure logs pods are running:
kubectl get pods -o wide -n kube-system | grep ama-logsYour output should look similar to the following example:
ama-logs-9bxc6                                   3/3     Running   1 (39m ago)   44m
ama-logs-fd568                                   3/3     Running   1 (40m ago)   44m
ama-logs-rs-65bdd98f75-hqnd2                     2/2     Running   1 (43m ago)   22h
To simplify log analysis, we provide preconfigured two Azure Managed Grafana dashboards:
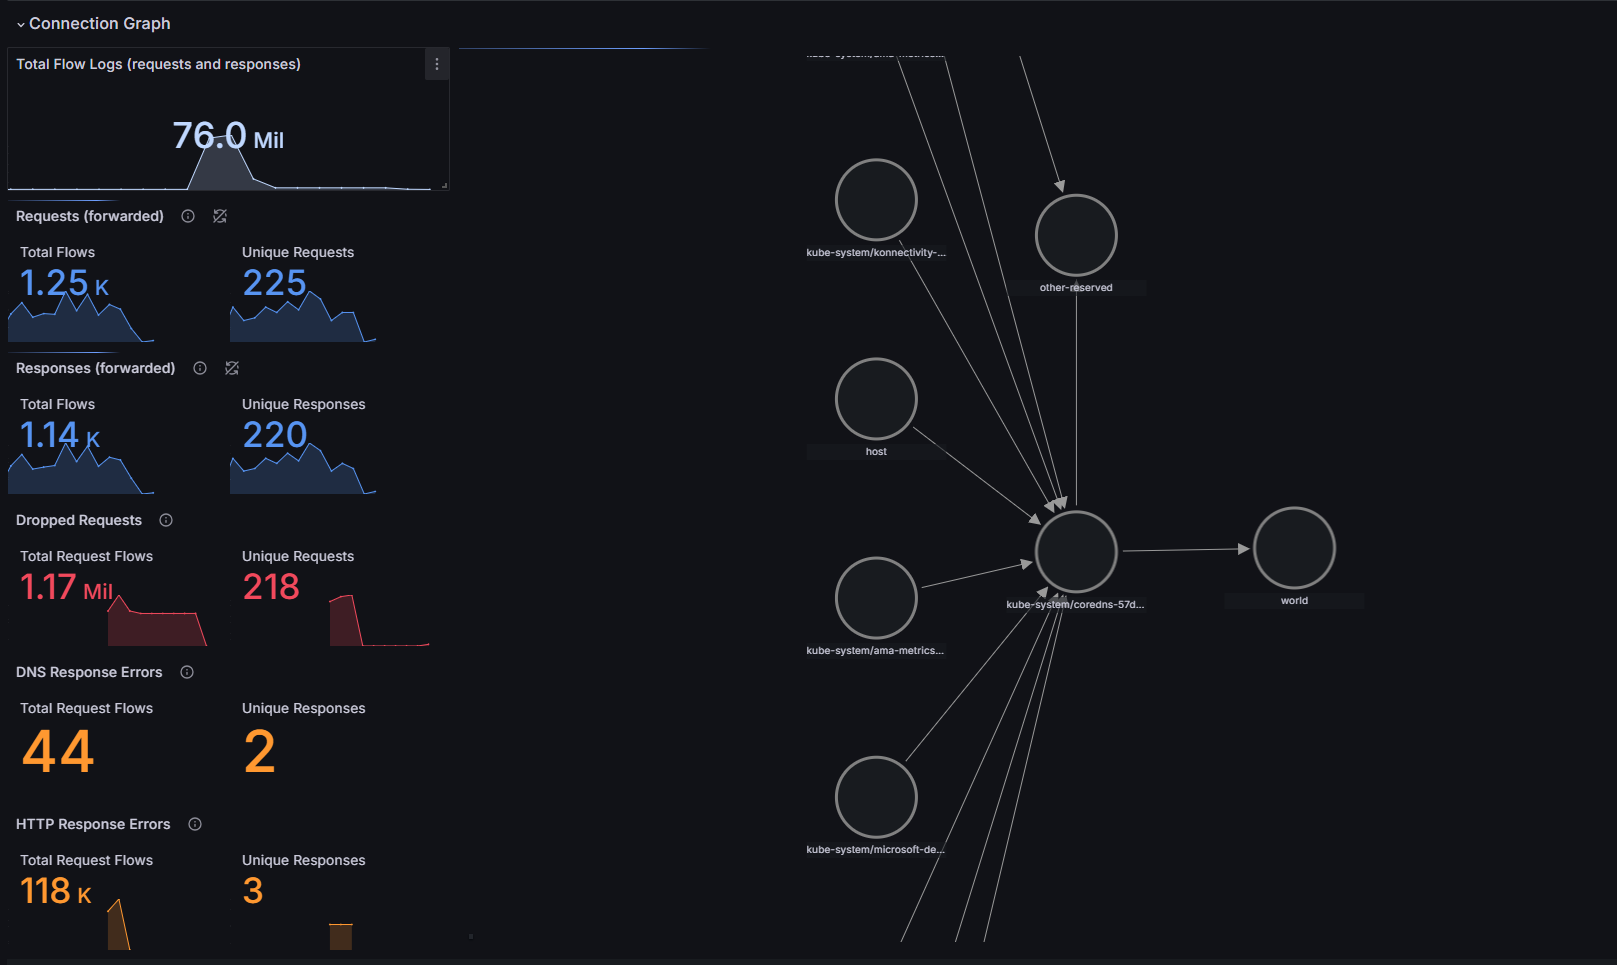
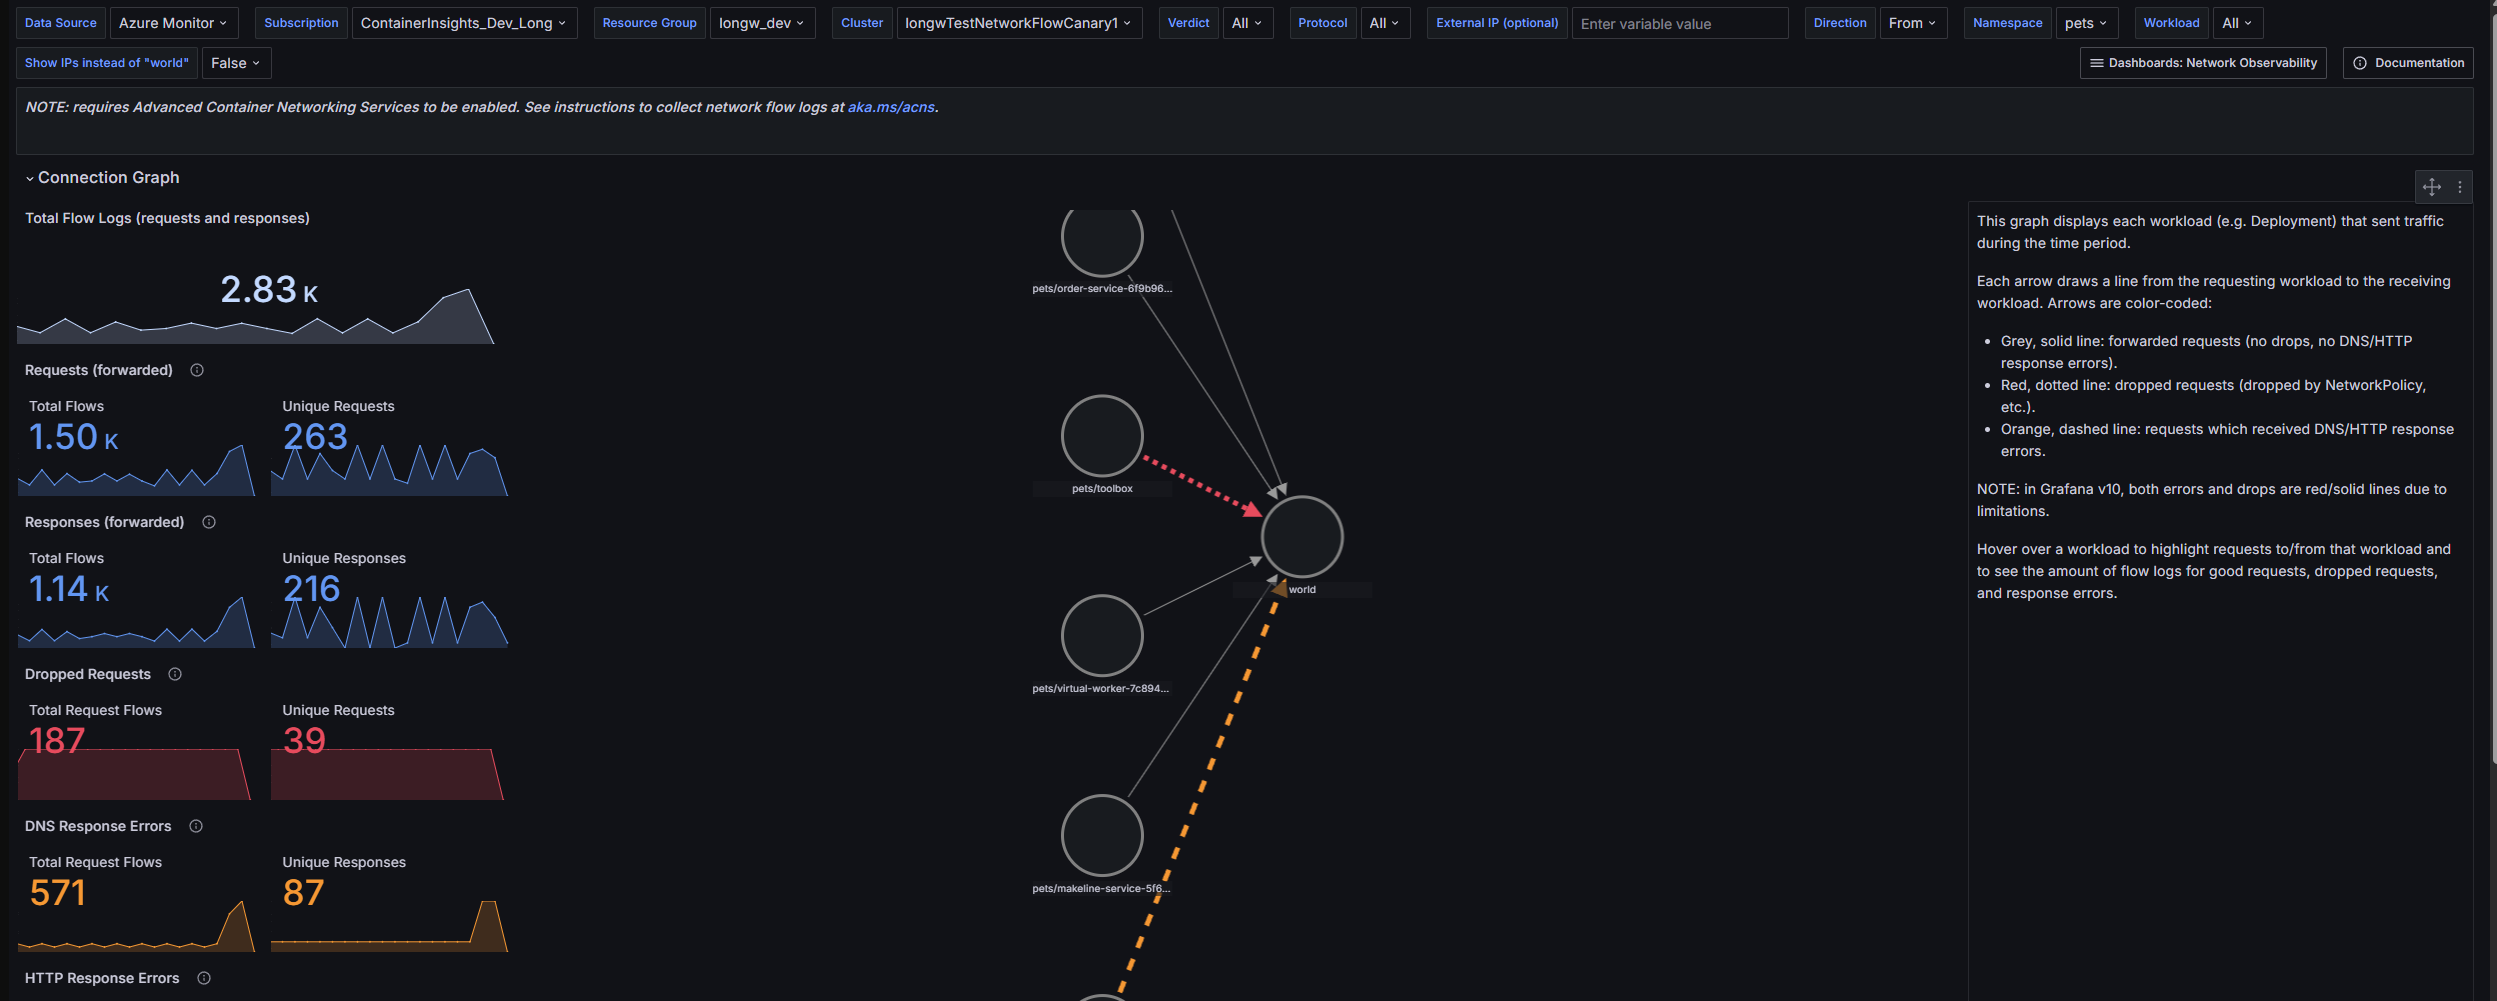
Go to Azure > Insights > Containers > Networking > Flow Logs. This dashboard provides visualizations in which AKS workloads communicate with each other, including network requests, responses, drops, and errors. Currently, you must use ID 23155 to import these dashboards.
Go to Azure > Insights > Containers > Networking > Flow Logs (External Traffic). This dashboard provides visualizations in which AKS workloads send and receive communications from outside an AKS cluster, including network requests, responses, drops, and errors. Use ID 23156.


For more information about how to use this dashboard, see the overview of container network logs.
Visualization of container network logs in the Azure portal
You can visualize, query, and analyze flow logs in the Azure portal. Go to the Log Analytics workspace of the cluster:

Configure on-demand logs mode
On-demand logs mode for network flows works with both Cilium and non-Cilium data planes.
To proceed, you must have an AKS cluster with Advanced Container Networking Services enabled.
The az aks create command with the Advanced Container Networking Services flag, --enable-acns, creates a new AKS cluster with all Advanced Container Networking Services features. The features include:
Container Network Observability: Provides insights into your network traffic. To learn more visit Container Network Observability.
Container Network Security: Offers security features like FQDN filtering. To learn more visit Container Network Security.
Note
Clusters that have the Cilium data plane support the Container Network Observability and Container Network Security features in Kubernetes version 1.29 and later.
# Set an environment variable for the AKS cluster name. Make sure you replace the placeholder with your own value.
export CLUSTER_NAME="<aks-cluster-name>"

# Create an AKS cluster
az aks create \
    --name $CLUSTER_NAME \
    --resource-group $RESOURCE_GROUP \
    --generate-ssh-keys \
    --location eastus \
    --max-pods 250 \
    --network-plugin azure \
    --network-plugin-mode overlay \
    --network-dataplane cilium \
    --node-count 2 \
    --pod-cidr 192.168.0.0/16 \
    --kubernetes-version 1.29 \
    --enable-acns
Enable Advanced Container Networking Services on an existing cluster
The az aks update command with the --enable-acns flag updates an existing AKS cluster with all Advanced Container Networking Services features. The features include Container Network Observability and Container Network Security.
Note
Only clusters that have the Cilium data plane support the Container Network Security features of Advanced Container Networking Services.
az aks update \
    --resource-group $RESOURCE_GROUP \
    --name $CLUSTER_NAME \
    --enable-acns
Next, get your cluster credentials by using the az aks get-credentials command:
az aks get-credentials --name $CLUSTER_NAME --resource-group $RESOURCE_GROUP
Install the Hubble CLI
Install the Hubble CLI to access the data it collects. Run the following commands:
# Set environment variables
export HUBBLE_VERSION=v1.16.3
export HUBBLE_ARCH=amd64

#Install the Hubble CLI
if [ "$(uname -m)" = "aarch64" ]; then HUBBLE_ARCH=arm64; fi
curl -L --fail --remote-name-all https://github.com/cilium/hubble/releases/download/$HUBBLE_VERSION/hubble-linux-${HUBBLE_ARCH}.tar.gz{,.sha256sum}
sha256sum --check hubble-linux-${HUBBLE_ARCH}.tar.gz.sha256sum
sudo tar xzvfC hubble-linux-${HUBBLE_ARCH}.tar.gz /usr/local/bin
rm hubble-linux-${HUBBLE_ARCH}.tar.gz{,.sha256sum}
Visualize the Hubble flows
Make sure that the Hubble pods are running:
kubectl get pods -o wide -n kube-system -l k8s-app=hubble-relayYour output should look similar to the following example:
hubble-relay-7ddd887cdb-h6khj 1/1 Running 0 23hPort-forward the Hubble Relay server:
kubectl port-forward -n kube-system svc/hubble-relay --address 127.0.0.1 4245:443Mutual TLS (mTLS) ensures the security of the Hubble Relay server. To enable the Hubble client to retrieve flows, you must get the appropriate certificates and configure the client with them. Apply the certificates by using the following commands:
#!/usr/bin/env bash
    set -euo pipefail
set -x

# Directory where certificates will be stored
CERT_DIR="$(pwd)/.certs"
mkdir -p "$CERT_DIR"

declare -A CERT_FILES=(
  ["tls.crt"]="tls-client-cert-file"
  ["tls.key"]="tls-client-key-file"
  ["ca.crt"]="tls-ca-cert-files"
)

for FILE in "${!CERT_FILES[@]}"; do
  KEY="${CERT_FILES[$FILE]}"
  JSONPATH="{.data['${FILE//./\\.}']}"

  # Retrieve the secret and decode it
  kubectl get secret hubble-relay-client-certs -n kube-system \
    -o jsonpath="${JSONPATH}" | \
    base64 -d > "$CERT_DIR/$FILE"

  # Set the appropriate hubble CLI config
  hubble config set "$KEY" "$CERT_DIR/$FILE"
done

hubble config set tls true
hubble config set tls-server-name instance.hubble-relay.cilium.io
Confirm that the secrets were generated:
kubectl get secrets -n kube-system | grep hubble-Your output should look similar to the following example:
kube-system     hubble-relay-client-certs     kubernetes.io/tls     3     9d

kube-system     hubble-relay-server-certs     kubernetes.io/tls     3     9d

kube-system     hubble-server-certs           kubernetes.io/tls     3     9d
Verify that the Hubble Relay pod is running:
hubble observe --pod hubble-relay-7ddd887cdb-h6khj
Visualize by using the Hubble UI
To use the Hubble UI, save the following script in the
hubble-ui.yamlfile:apiVersion: v1 kind: ServiceAccount metadata: name: hubble-ui namespace: kube-system --- kind: ClusterRole apiVersion: rbac.authorization.k8s.io/v1 metadata: name: hubble-ui labels: app.kubernetes.io/part-of: retina rules: - apiGroups: - networking.k8s.io resources: - networkpolicies verbs: - get - list - watch - apiGroups: - "" resources: - componentstatuses - endpoints - namespaces - nodes - pods - services verbs: - get - list - watch - apiGroups: - apiextensions.k8s.io resources: - customresourcedefinitions verbs: - get - list - watch - apiGroups: - cilium.io resources: - "*" verbs: - get - list - watch --- apiVersion: rbac.authorization.k8s.io/v1 kind: ClusterRoleBinding metadata: name: hubble-ui labels: app.kubernetes.io/part-of: retina roleRef: apiGroup: rbac.authorization.k8s.io kind: ClusterRole name: hubble-ui subjects: - kind: ServiceAccount name: hubble-ui namespace: kube-system --- apiVersion: v1 kind: ConfigMap metadata: name: hubble-ui-nginx namespace: kube-system data: nginx.conf: | server { listen 8081; server_name localhost; root /app; index index.html; client_max_body_size 1G; location / { proxy_set_header Host $host; proxy_set_header X-Real-IP $remote_addr; # CORS add_header Access-Control-Allow-Methods "GET, POST, PUT, HEAD, DELETE, OPTIONS"; add_header Access-Control-Allow-Origin *; add_header Access-Control-Max-Age 1728000; add_header Access-Control-Expose-Headers content-length,grpc-status,grpc-message; add_header Access-Control-Allow-Headers range,keep-alive,user-agent,cache-control,content-type,content-transfer-encoding,x-accept-content-transfer-encoding,x-accept-response-streaming,x-user-agent,x-grpc-web,grpc-timeout; if ($request_method = OPTIONS) { return 204; } # /CORS location /api { proxy_http_version 1.1; proxy_pass_request_headers on; proxy_hide_header Access-Control-Allow-Origin; proxy_pass http://127.0.0.1:8090; } location / { try_files $uri $uri/ /index.html /index.html; } # Liveness probe location /healthz { access_log off; add_header Content-Type text/plain; return 200 'ok'; } } } --- kind: Deployment apiVersion: apps/v1 metadata: name: hubble-ui namespace: kube-system labels: k8s-app: hubble-ui app.kubernetes.io/name: hubble-ui app.kubernetes.io/part-of: retina spec: replicas: 1 selector: matchLabels: k8s-app: hubble-ui template: metadata: labels: k8s-app: hubble-ui app.kubernetes.io/name: hubble-ui app.kubernetes.io/part-of: retina spec: serviceAccountName: hubble-ui automountServiceAccountToken: true containers: - name: frontend image: mcr.microsoft.com/oss/cilium/hubble-ui:v0.12.2 imagePullPolicy: Always ports: - name: http containerPort: 8081 livenessProbe: httpGet: path: /healthz port: 8081 readinessProbe: httpGet: path: / port: 8081 resources: {} volumeMounts: - name: hubble-ui-nginx-conf mountPath: /etc/nginx/conf.d/default.conf subPath: nginx.conf - name: tmp-dir mountPath: /tmp terminationMessagePolicy: FallbackToLogsOnError securityContext: {} - name: backend image: mcr.microsoft.com/oss/cilium/hubble-ui-backend:v0.12.2 imagePullPolicy: Always env: - name: EVENTS_SERVER_PORT value: "8090" - name: FLOWS_API_ADDR value: "hubble-relay:443" - name: TLS_TO_RELAY_ENABLED value: "true" - name: TLS_RELAY_SERVER_NAME value: ui.hubble-relay.cilium.io - name: TLS_RELAY_CA_CERT_FILES value: /var/lib/hubble-ui/certs/hubble-relay-ca.crt - name: TLS_RELAY_CLIENT_CERT_FILE value: /var/lib/hubble-ui/certs/client.crt - name: TLS_RELAY_CLIENT_KEY_FILE value: /var/lib/hubble-ui/certs/client.key livenessProbe: httpGet: path: /healthz port: 8090 readinessProbe: httpGet: path: /healthz port: 8090 ports: - name: grpc containerPort: 8090 resources: {} volumeMounts: - name: hubble-ui-client-certs mountPath: /var/lib/hubble-ui/certs readOnly: true terminationMessagePolicy: FallbackToLogsOnError securityContext: {} nodeSelector: kubernetes.io/os: linux volumes: - configMap: defaultMode: 420 name: hubble-ui-nginx name: hubble-ui-nginx-conf - emptyDir: {} name: tmp-dir - name: hubble-ui-client-certs projected: defaultMode: 0400 sources: - secret: name: hubble-relay-client-certs items: - key: tls.crt path: client.crt - key: tls.key path: client.key - key: ca.crt path: hubble-relay-ca.crt --- kind: Service apiVersion: v1 metadata: name: hubble-ui namespace: kube-system labels: k8s-app: hubble-ui app.kubernetes.io/name: hubble-ui app.kubernetes.io/part-of: retina spec: type: ClusterIP selector: k8s-app: hubble-ui ports: - name: http port: 80 targetPort: 8081Apply the
hubble-ui.yamlmanifest to your cluster:kubectl apply -f hubble-ui.yamlSet up port forwarding for the Hubble UI:
kubectl -n kube-system port-forward svc/hubble-ui 12000:80In your web browser, enter
http://localhost:12000/to access the Hubble UI.
Basic troubleshooting
Advanced Container Networking Services is a prerequisite to turn on the Azure Monitor Agent log collection feature.
Trying to enable the container network flow logs capability on a cluster without enabling Advanced Container Networking Services, for example:
az aks update -g test-rg -n test-cluster --enable-retina-flow-logsResults in an error message:
Flow logs requires '--enable-acns', advanced networking to be enabled, and the monitoring addon to be enabled.If the cluster Kubernetes version is earlier than version 1.32.0, trying to run
--enable-retina-flow-logsresults in an error message:The specified orchestrator version %s is not valid. Advanced Networking Flow Logs is only supported on Kubernetes version 1.32.0 or later.where
%sis your Kubernetes version.If you try to run
--enable-retina-flow-logson a subscription where the Azure Feature Exposure Control (AFEC) flag isn't enabled, an error message appears:Feature Microsoft.ContainerService/AdvancedNetworkingFlowLogsPreview is not enabled. Please see https://aka.ms/aks/previews for how to enable features.If you try to apply a
RetinaNetworkFlowLogcustom resource on a cluster where Advanced Container Networking Services isn't enabled, an error message appears:error: resource mapping not found for <....>": no matches for kind "RetinaNetworkFlowLog" in version "acn.azure.com/v1alpha1"Ensure that you install custom resources first.
Disable container network logs: Stored logs mode on existing cluster
If all custom resources are deleted, flow log collection stops because no filters are defined for collection.
To disable retina flow log collection by the Azure Monitor Agent, run:
az aks update -n $CLUSTER_NAME -g $RESOURCE_GROUP --disable-retina-flow-logs
Clean up resources
If you don't plan to use this example application, delete the resources you created in this article by using the az group delete command.
az group delete --name $RESOURCE_GROUP
Related content
- Get more information about Advanced Container Networking Services for AKS.
- Explore the Container Network Observability feature in Advanced Container Networking Services.
Collaborate with us on GitHub
The source for this content can be found on GitHub, where you can also create and review issues and pull requests. For more information, see our contributor guide.

Azure Kubernetes Service