Note
Access to this page requires authorization. You can try signing in or changing directories.
Access to this page requires authorization. You can try changing directories.
Container network logs in Advanced Container Networking Services for Azure Kubernetes Service (AKS) give you deep visibility into network traffic in your AKS clusters.
The logs capture essential metadata, including source and destination IP addresses, pod and service names, ports, protocols, and traffic direction for detailed insight into network behavior.
Container network logs capture Layer 3 (IP), Layer 4 (TCP/UDP), and Layer 7 (HTTP/gRPC/Kafka) traffic to help you effectively monitor connectivity, troubleshoot, visualize network topology, and enforce security policy.
Choose from two modes:
- Stored logs
- On-demand logs
Stored logs
Stored logs mode ensures continuous log generation and collection in the AKS cluster when you enable Advanced Container Networking Services and set up custom filters. Log collection is disabled by default.
To enable log collection, you define custom resources to specify the types of traffic to monitor. Examples include namespaces, pods, services, and protocols. This feature remains active until you disable it.
Stored logs mode supports extended log retention, but it also supports traffic filtering. For reduced storage cost and easier analysis, you can collect and retain logs that are relevant to you.
How stored logs mode works
Advanced Container Networking Services uses eBPF technology with Cilium to fetch logs from nodes in your cluster. To start collecting logs, you define one or more custom resources to specify the types of traffic to monitor.
Custom resources give you fine-grained control to define and capture traffic that is relevant to you. The Cilium agent running on each node collects the network traffic that matches the criteria set in the custom resources. The logs are stored in JSON format on the host, providing a structured and accessible format for further use.
Alternatively, if the Azure Monitoring add-on is enabled, agents for Container insights collect the logs from the host, apply the default throttling limits, and send them to a Log Analytics workspace. The system aggregates and stores log efficiently to give you visibility into network traffic for monitoring, troubleshooting, and helping you enforce security.

To read more about throttling and Container insights, see the Container insights documentation.
Key capabilities of stored logs mode
Customizable filters. You can configure logging by defining custom resources of the RetinaNetworkFlowLog type. Use custom resources to apply granular filters by namespace, pod, service, port, protocol, verdict, or traffic direction (ingress or egress). The flexibility ensures precise data collection tailored to specific use cases. Only relevant traffic is logged, and storage is optimized for improved performance, compliance, and troubleshooting.
Log storage options. The container network logs feature has two primary storage options: unmanaged storage and managed storage.
Unmanaged storage: When a custom resource is applied to begin logs collection, network flow logs are stored locally on the host nodes at the
/var/log/acns/hubblefixed mount location. This storage location is temporary because the node itself isn't a persistent storage solution. Also, when the log files reach a size of 50 MB, they're automatically rotated, so older logs are overwritten. This storage solution is suitable for real-time monitoring, but it doesn't support long-term storage or retention.For more log management capabilities, you can integrate partner logging services like an OpenTelemetry collector. Partner integrations give you flexibility to manage logs outside the Azure ecosystem and are useful if you already deployed a specific log management platform.
Managed storage: For long-term retention and advanced analytics, we recommend that you configure Azure monitoring in your AKS cluster to collect and store logs in a Log Analytics workspace. This setup helps ensure secure and compliant log storage. It also gives you access to powerful capabilities like anomaly detection, performance tuning, and historical data analysis. You can use historical logs to identify trends, baseline behaviors, and proactively address recurring issues.
For example, you can use the managed service for Prometheus to configure alerts on both metrics and logs for real-time monitoring and to rapidly detect outliers.
You use the same workspace for log storage. You set up log storage space during onboarding. Both Analytics and Basic logs table plans are supported plans for storage for this feature. For more detailed information on table plans, see Azure Monitor Logs.
Simple visualization in Log Analytics and Grafana dashboards. Logs and data presented in Grafana dashboards simplifies complex information, facilitates data comprehension, and helps you make decisions more quickly.
Logs visualization in the Azure portal
You can visualize, query, and analyze flow logs in the Azure portal in the Log Analytics workspace for your cluster.

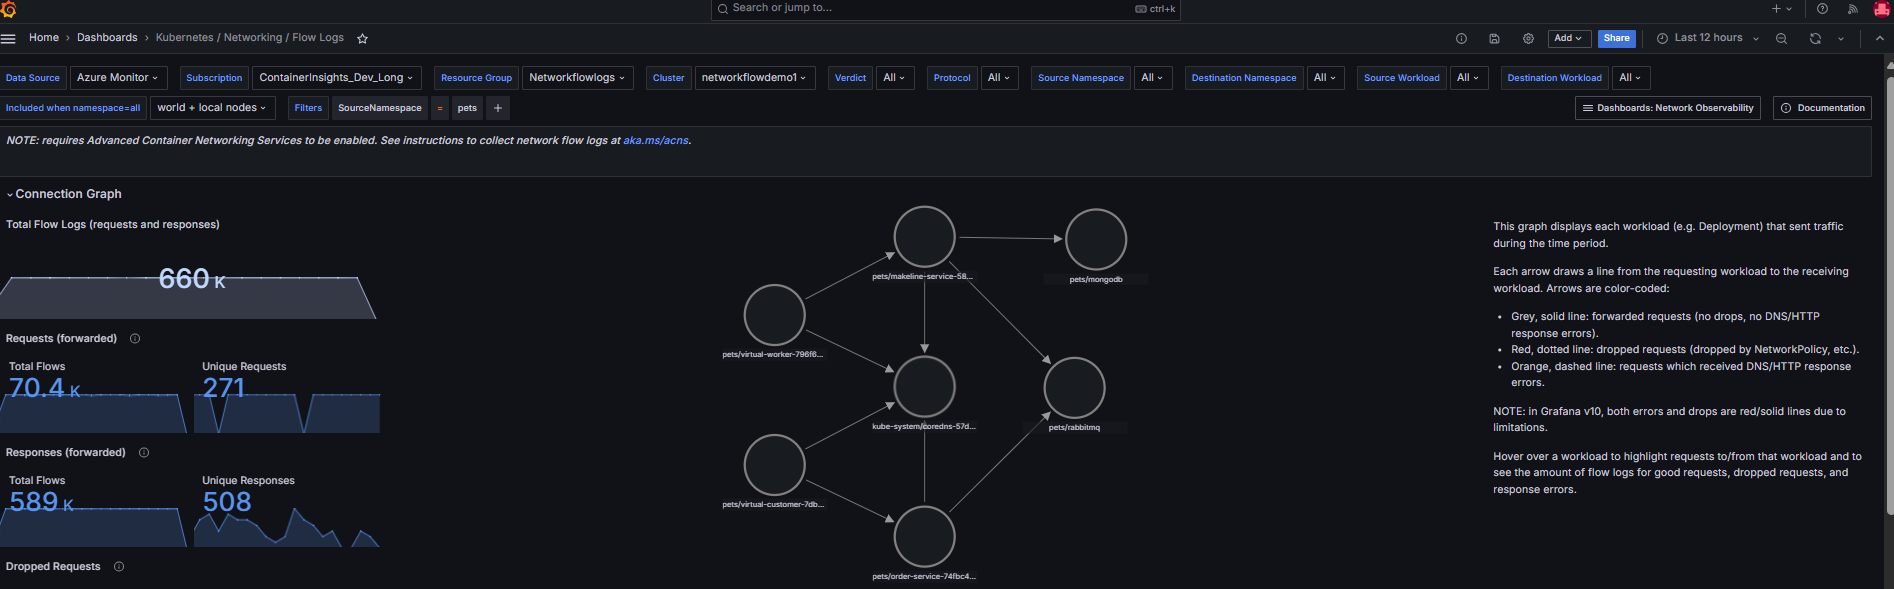
Logs visualization in Grafana dashboards
Access the flow logs in an Azure Managed Grafana instance.
To simplify your analysis of logs, we provide two preconfigured Grafana dashboards:
Go to Azure > Insights > Containers > Networking > Flow Logs. This dashboard shows which AKS workloads are communicating with each other, including network requests, responses, drops, and errors. Currently, as an interim step during preview, you must import Grafana dashboards by using a user ID to view the flow logs dashboard in the Azure portal.
Go to Azure > Insights > Containers > Networking > Flow Logs (External Traffic). This dashboard shows which AKS workloads send and receive communications from outside an AKS cluster, including network requests, responses, drops, and errors.
For more information, see Set up Azure Managed Grafana with Advanced Container Networking Services.
Access the flow logs in the Azure portal via the Dashboards with Grafana option.
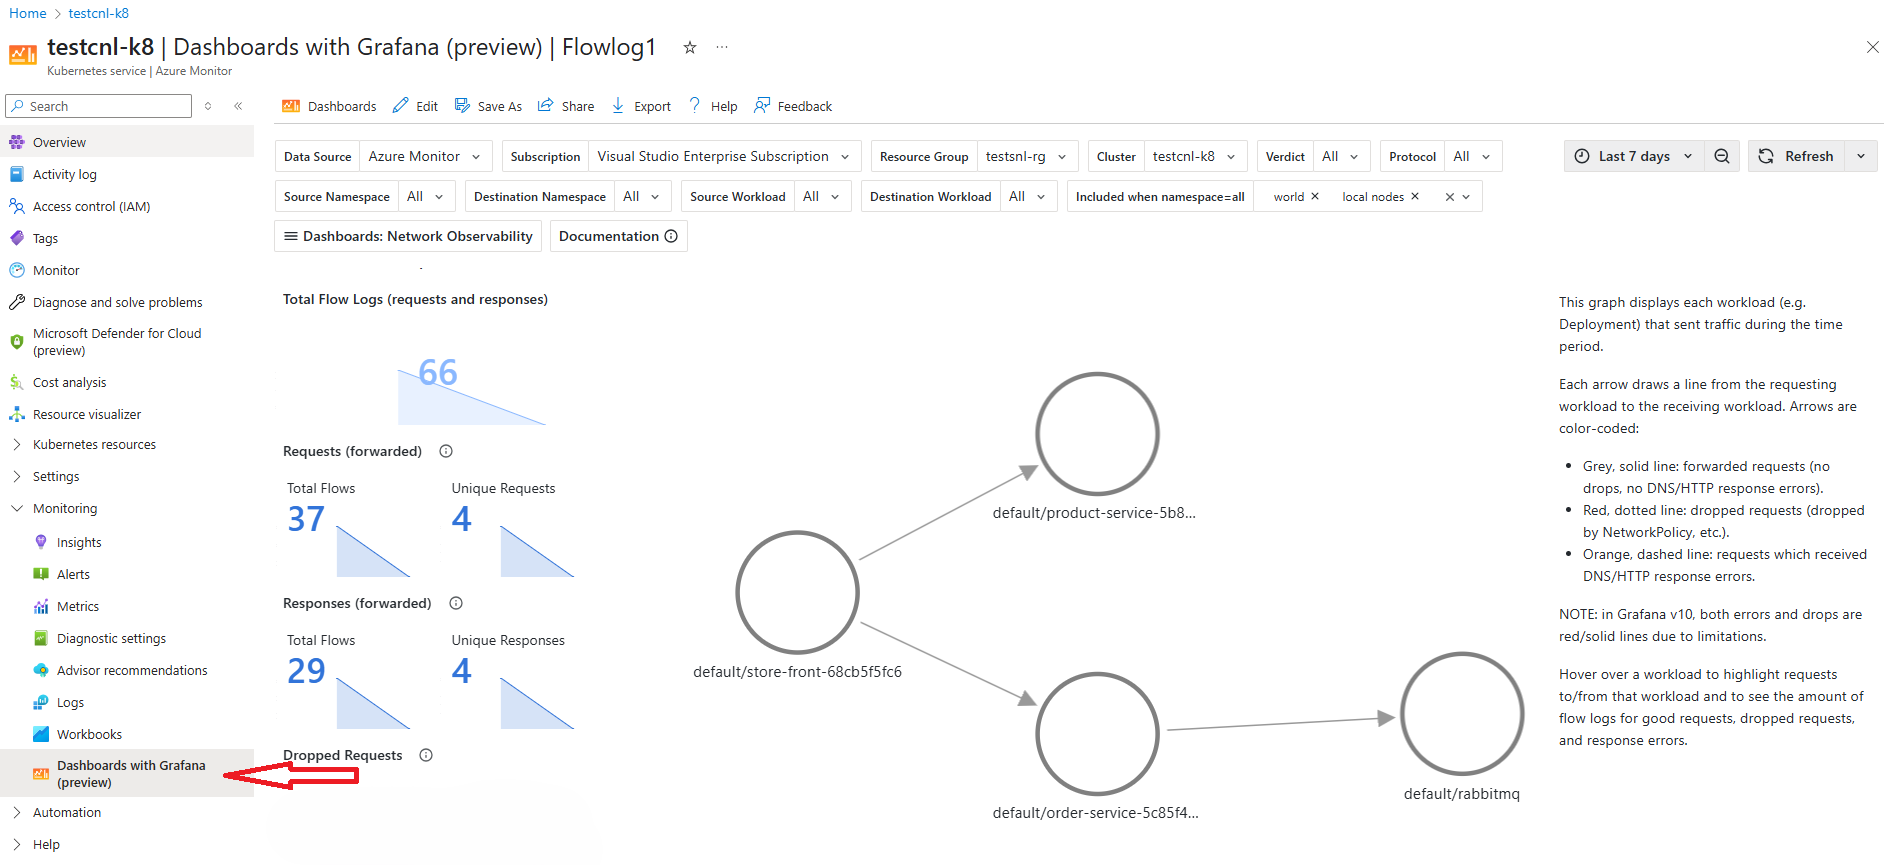


The Azure portal dashboards have the following major components:
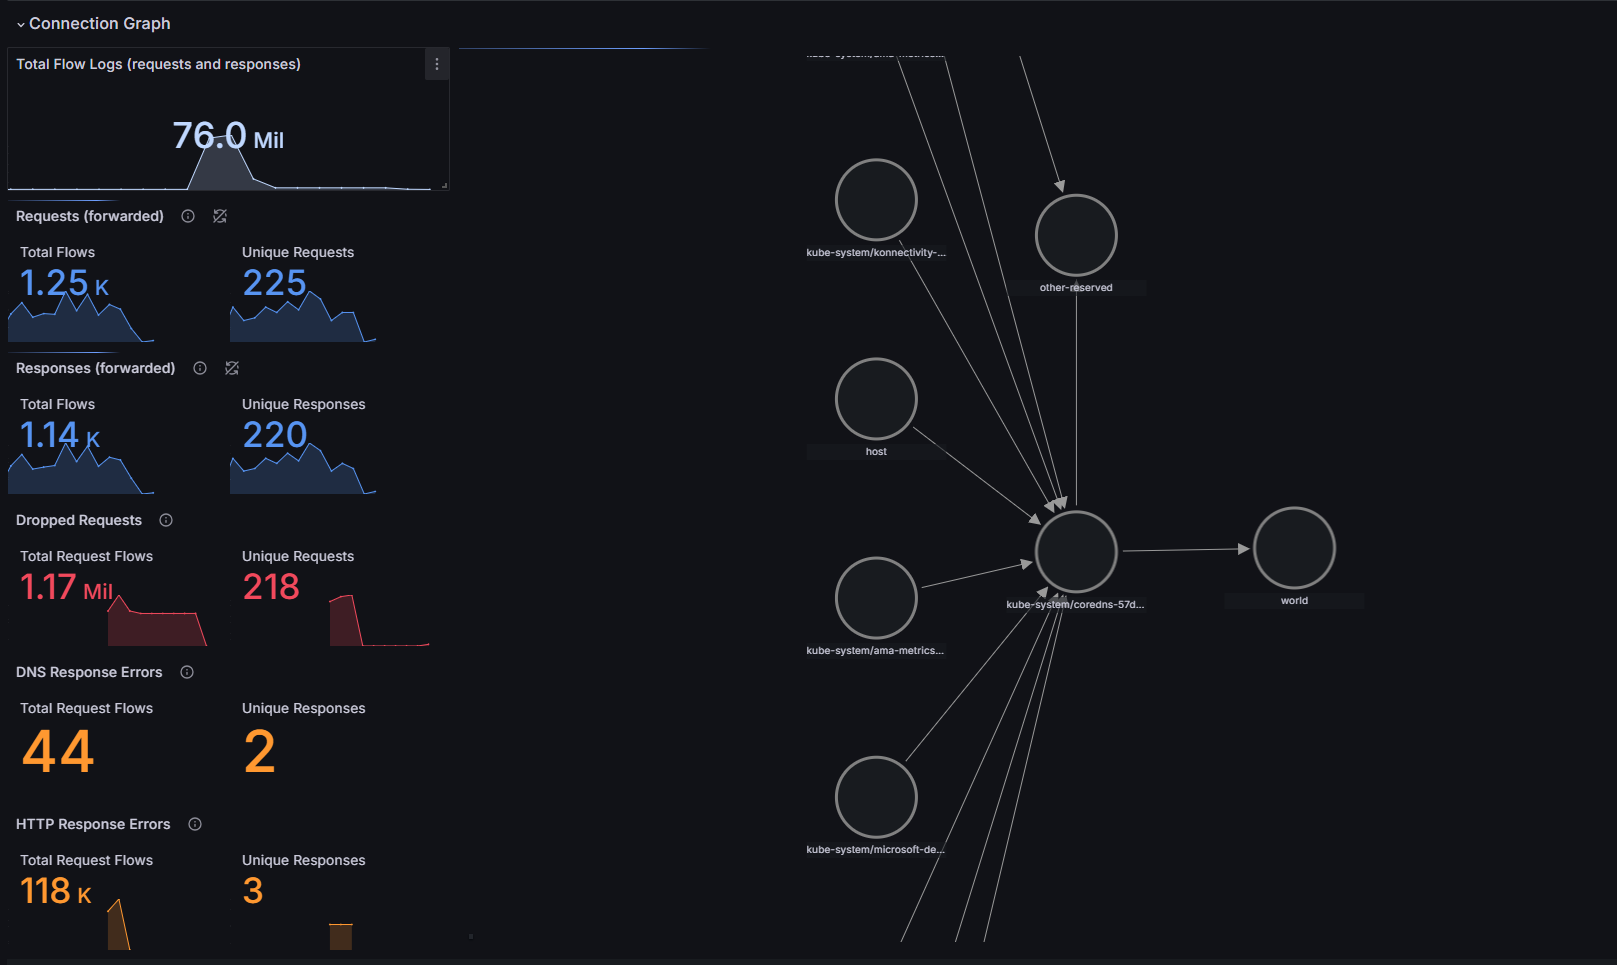
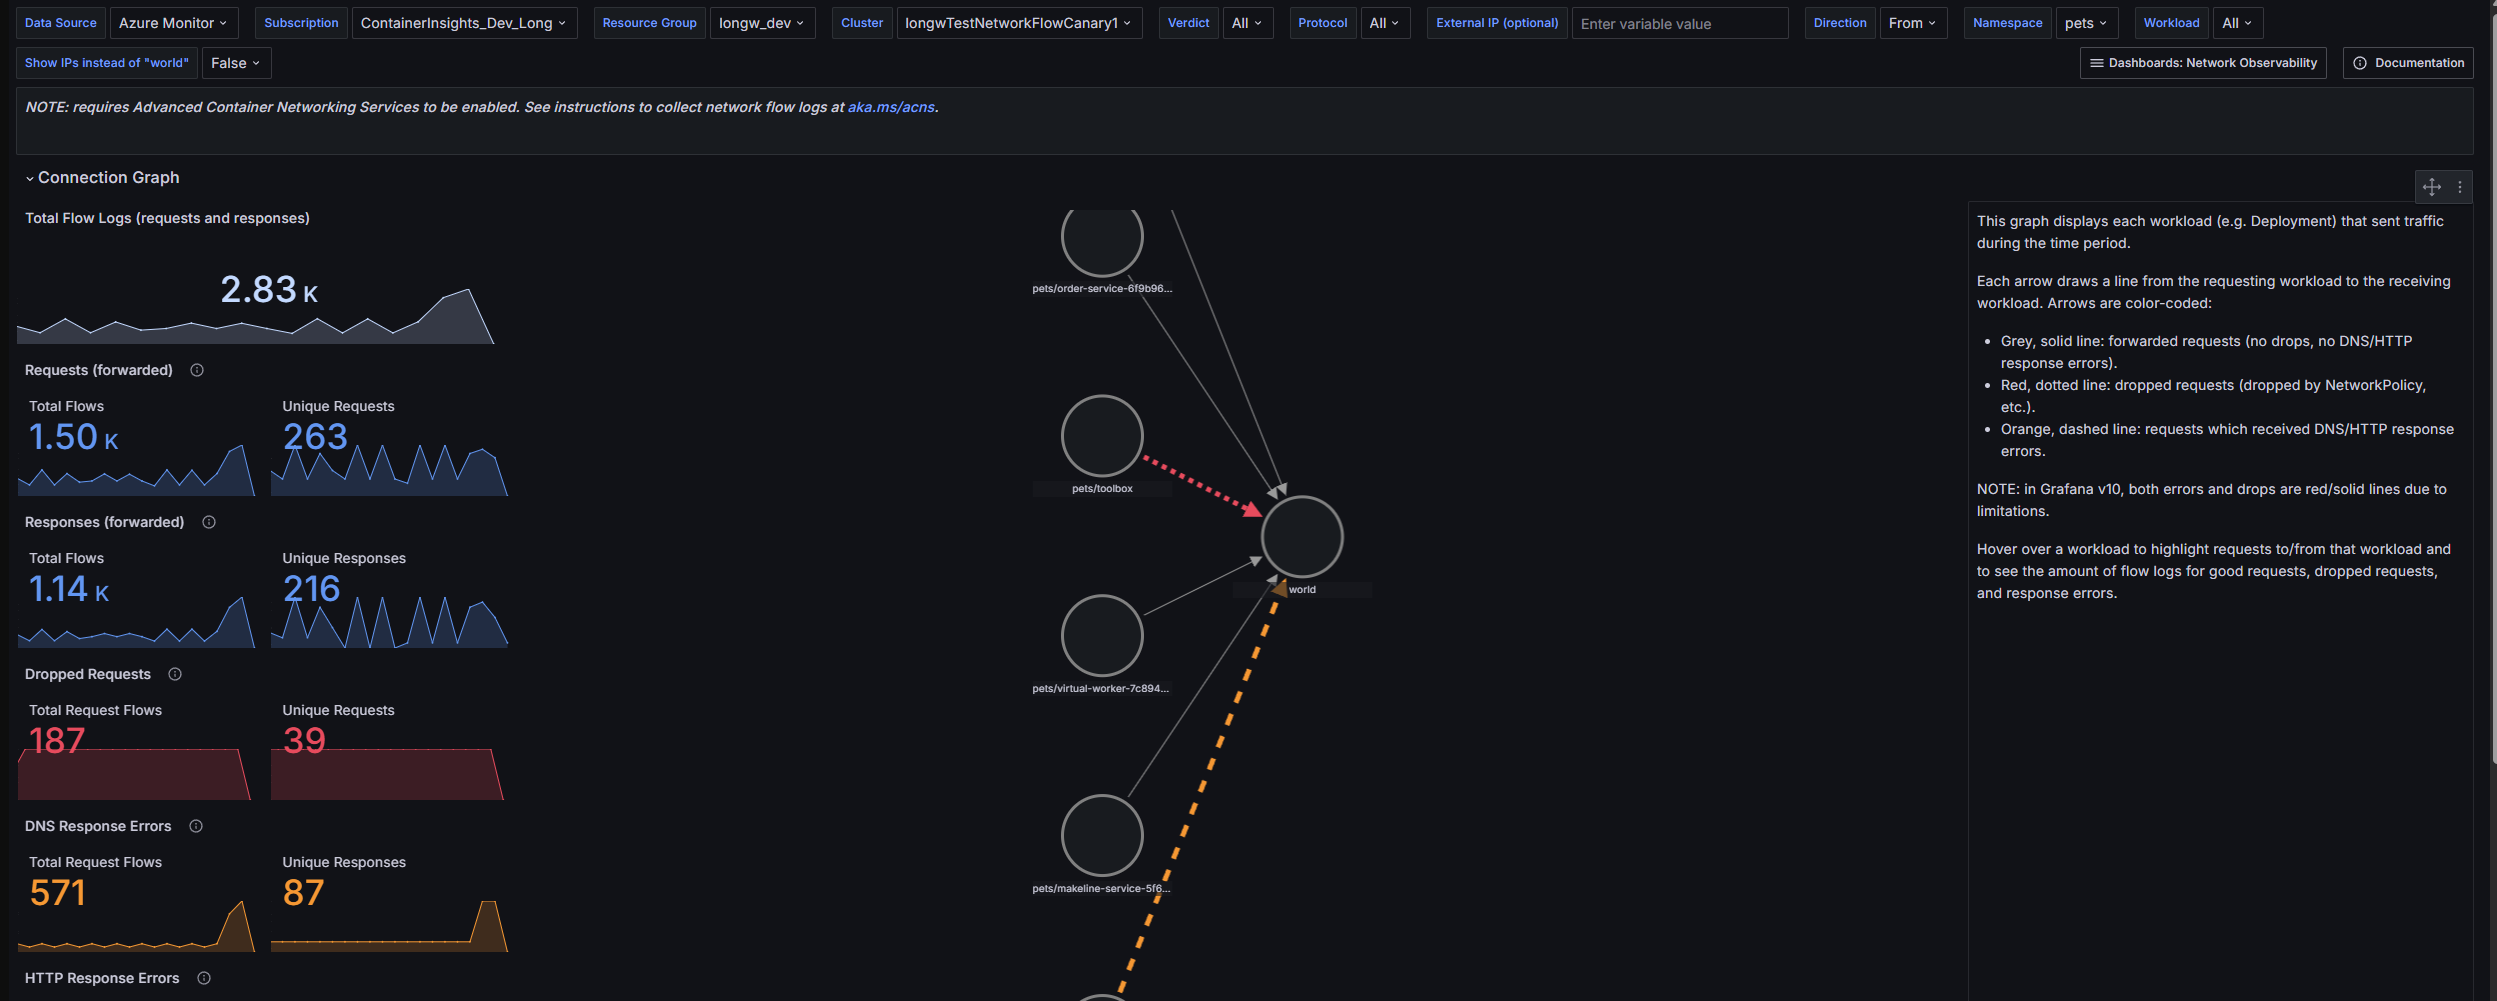
A comprehensive overview of network health. You see key metrics, like total flow logs, unique requests, dropped requests, and forwarded requests for quick anomaly detection and efficient troubleshooting. The dashboard categorizes statistics by protocol and behavior, including DNS dropped requests, HTTP 2xx responses, Layer 4 request and response rates, and dropped request counts. A service dependency graph visualizes application or cluster interactions, highlighting traffic flow, bottlenecks, and dependencies for performance optimization.
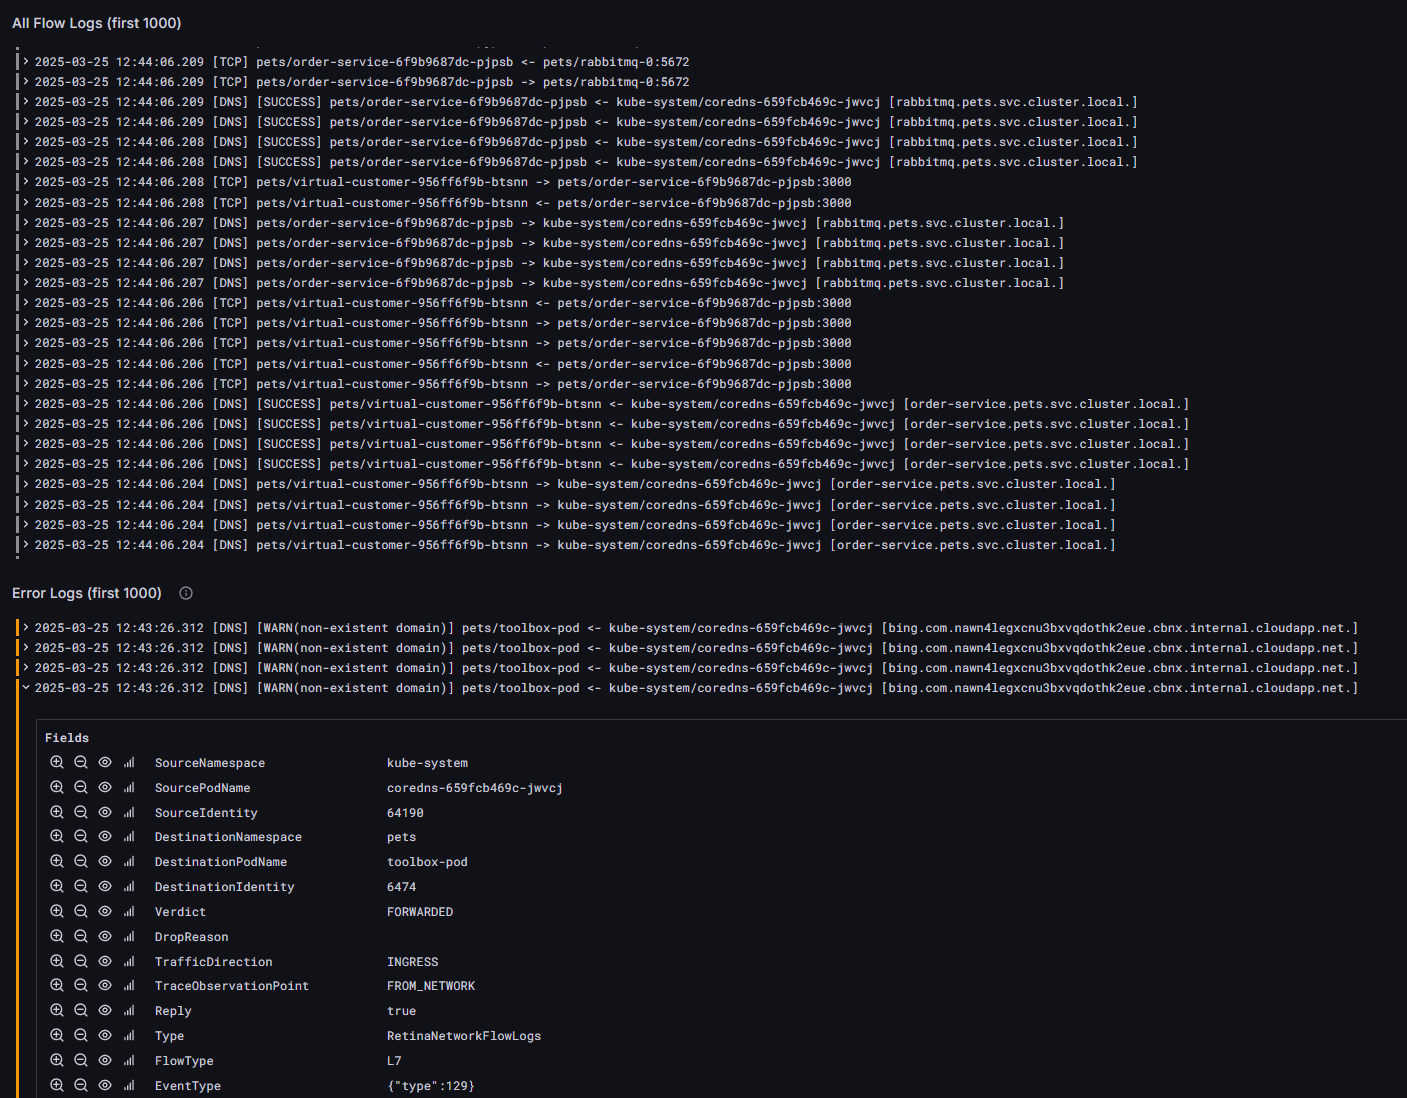
Flow logs and error logs for quick analysis. You can filter flow logs for root-cause analysis. For example, for Domain Name System (DNS) issues, filter error logs by the DNS protocol.
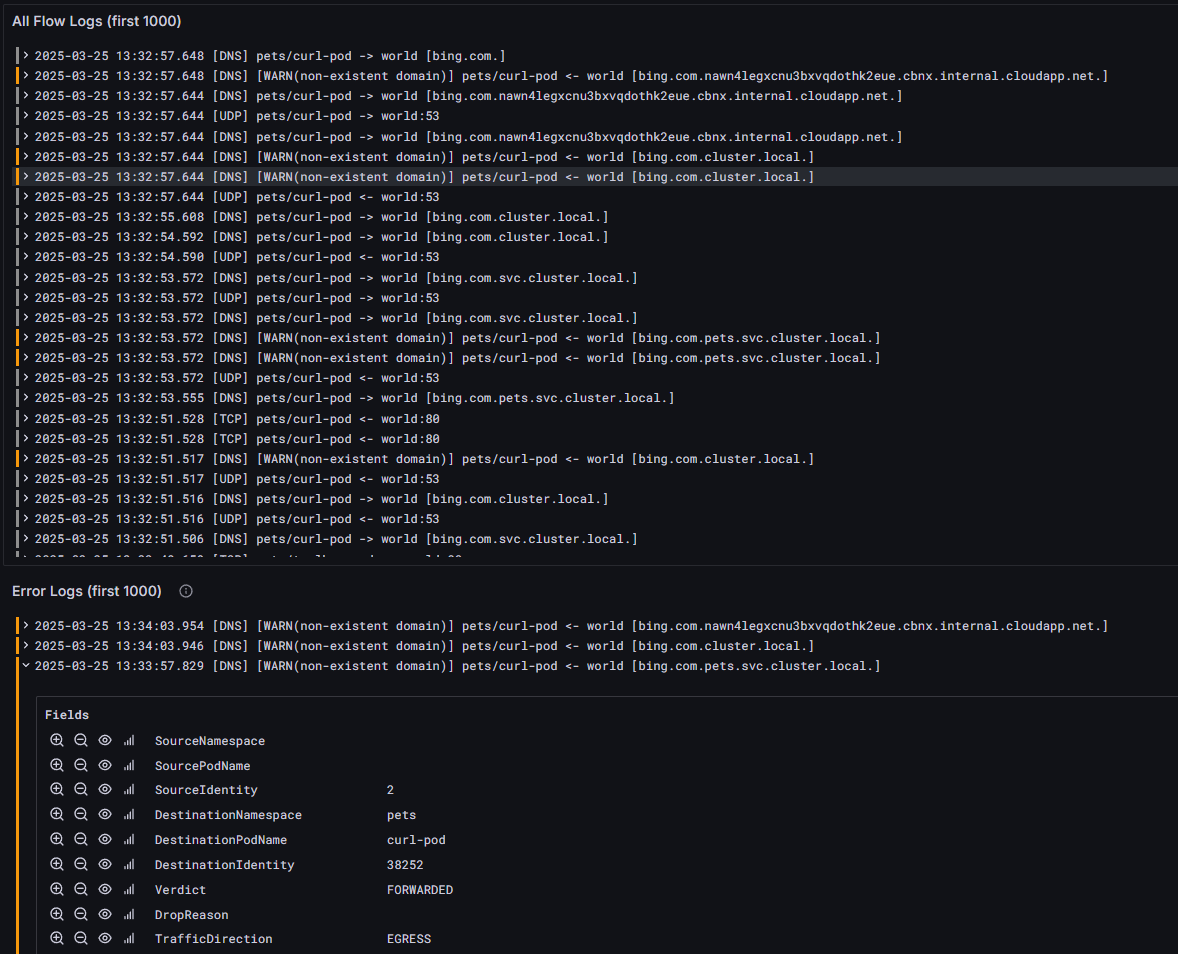
Separating sections of flow logs and error logs helps you more quickly analyze issues. You can quickly identify and address errors without sifting through unrelated information to improve efficiency in troubleshooting and debugging processes.
Use clear labels and timestamps for each log entry to more easily pinpoint specific events or errors in the system or processes.
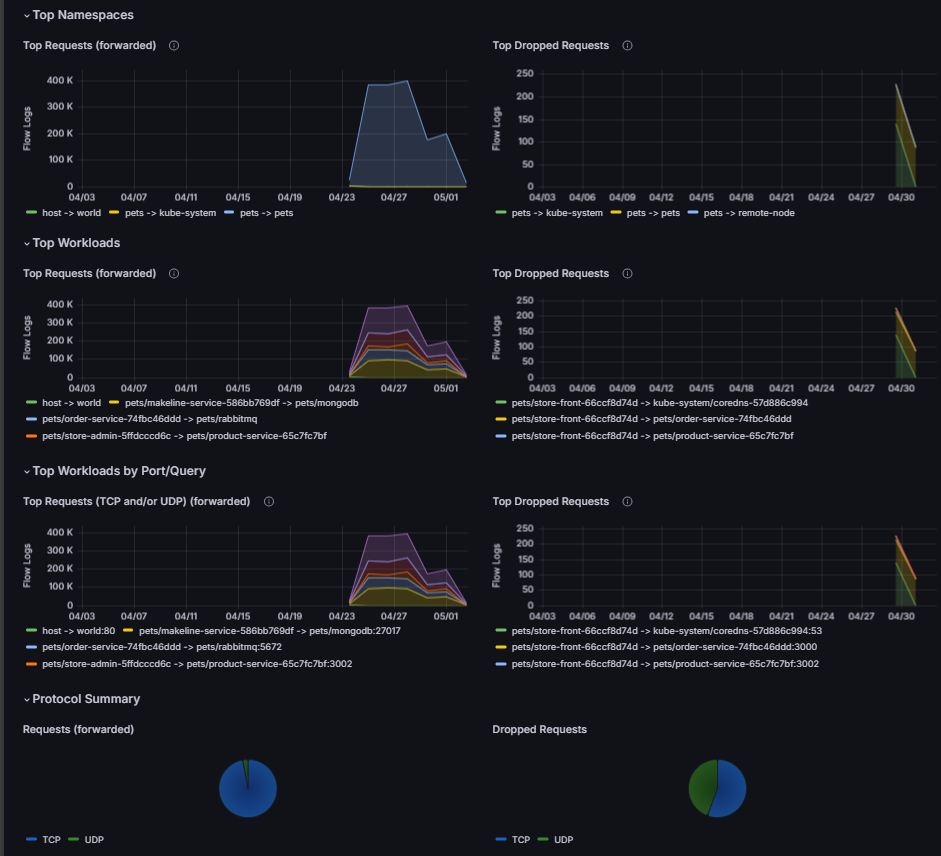
Top namespaces, workloads, and DNS errors. Network flow logs visualization is vital for monitoring and analyzing communication in an AKS cluster. It gives you insight into namespaces, workloads, and port and query usage. It helps you identify trends, detect bottlenecks, and diagnose issues. Spot significant network activity, view drop requests, and assess protocol distribution (for example, TCP versus UDP). This overview section of the dashboard supports cluster health, resource optimization, and security by detecting and displaying unusual traffic patterns.


On-demand logs
Advanced Container Networking Services offers on-demand capture of network flow logs. Get real-time visibility without prior configuration or persistent storage by using the Hubble CLI and the Hubble UI. This mode for getting on-demand logs is available. To learn how to set up on-demand logs storage, see Configure the Hubble CLI and Hubble UI.
Hubble CLI
The Hubble command-line interface (CLI) provides a flexible and interactive way to query, filter, and analyze flow logs directly in the terminal. You can execute real-time commands to inspect traffic flows, view packet metadata, and troubleshoot network issues without leaving your operational environment.

Hubble UI
The Hubble web-based interface offers an intuitive and visual platform for monitoring. With features like live traffic dashboards, flow summaries, and searchable logs, you can easily track service-to-service communication, detect anomalies, and gain insights into cluster activity.
The tools in the Hubble UI provide real-time visibility and actionable insights for faster troubleshooting and improved network management.

Key benefits of on-demand logs
- Faster issue resolution. With detailed and actionable insights into network traffic, you can identify and resolve connectivity or performance issues more quickly, minimizing downtime, and disruptions.
- Optimized operational efficiency. Aggregated and efficiently stored logs reduce data management overhead. Your team can focus on analysis and decision-making instead of on managing large volumes of raw data.
- Enhanced application reliability. By monitoring service-to-service communication and detecting anomalies, you can proactively address potential issues, ensuring a smoother and more reliable application experience.
- Improved decision-making. Visualizing network patterns in Azure Managed Grafana and applying service maps gives you clear insights into your application’s network behavior. The result is improved infrastructure planning and optimization.
- Cost savings. Efficient log aggregation and customizable logging scopes reduce storage and data ingestion costs for a cost-effective solution for long-term network monitoring.
- Streamlined compliance and security. Persistent and comprehensive logs support audit trails, regulatory compliance, and quick identification of suspicious traffic. They help you maintain a secure and compliant environment.
Limitations
- Container network logs in stored logs mode currently works only with the Cilium data plane.
- Layer 7 flow logs are captured only when Layer 7 policy support is enabled. For more information, see Configure a Layer 7 policy.
- DNS flows and metrics are captured only when a Cilium Fully Qualified Domain (FQDN) network policy is applied. For more information, see Configure an FQDN policy.
- Onboarding by using Terraform currently isn't supported.
- When Log Analytics isn't configured for log storage, container network logs are limited to a maximum of 50 MB of storage. When this limit is reached, new entries overwrite older logs.
- If the table plan is set to Basic logs, prebuilt Grafana dashboards don't work.
- The Auxiliary logs table plan isn't supported.
Pricing
Important
Advanced Container Networking Services is a paid offering.
For more information about pricing, see Advanced Container Networking Services - Pricing.
Related content
- Learn how to set up container network logs.
- Get more information about Advanced Container Networking Services for AKS.
- Explore the Container Network Observability feature in Advanced Container Networking Services.
- Explore the Container Network Security feature in Advanced Container Networking Services.
Collaborate with us on GitHub
The source for this content can be found on GitHub, where you can also create and review issues and pull requests. For more information, see our contributor guide.

Azure Kubernetes Service