你当前正在访问 Microsoft Azure Global Edition 技术文档网站。 如果需要访问由世纪互联运营的 Microsoft Azure 中国技术文档网站,请访问 https://docs.azure.cn。
为 Apache Cassandra 群集部署 Azure 托管实例时,该服务在每个数据节点上预配 Apache Cassandra 代理软件的指标收集器 。 Prometheus 使用指标,并通过 Grafana 进行可视化。 本文介绍如何配置 Prometheus 和 Grafana 以可视化托管实例群集发出的指标。
需要完成以下任务才能可视化指标:
- 在托管实例所在的 Azure 虚拟网络中部署 Ubuntu 虚拟机(VM)。
- 将 Prometheus 仪表板 安装到 VM 上。
警告
Prometheus 和 Grafana 是开源软件,不支持作为 Apache Cassandra 的 Azure 托管实例的一部分。 要按照本文所述的方式可视化指标,需要将 VM 作为 Prometheus 和 Grafana 的服务器进行托管和维护。 本文中的说明仅针对 Ubuntu Server 18.04 进行了测试。 不能保证它们与其他 Linux 分发版一起使用。
遵循此方法意味着必须支持可能出现的任何问题,例如空间不足或服务器的可用性不足。 对于完全受支持和托管的指标体验,请考虑使用 Azure Monitor 指标或 Azure Monitor 合作伙伴集成。
部署 Ubuntu 服务器
登录 Azure 门户。
转到托管实例群集所在的资源组。 选择 “添加 ”并搜索 Ubuntu Server 18.04 LTS 映像。
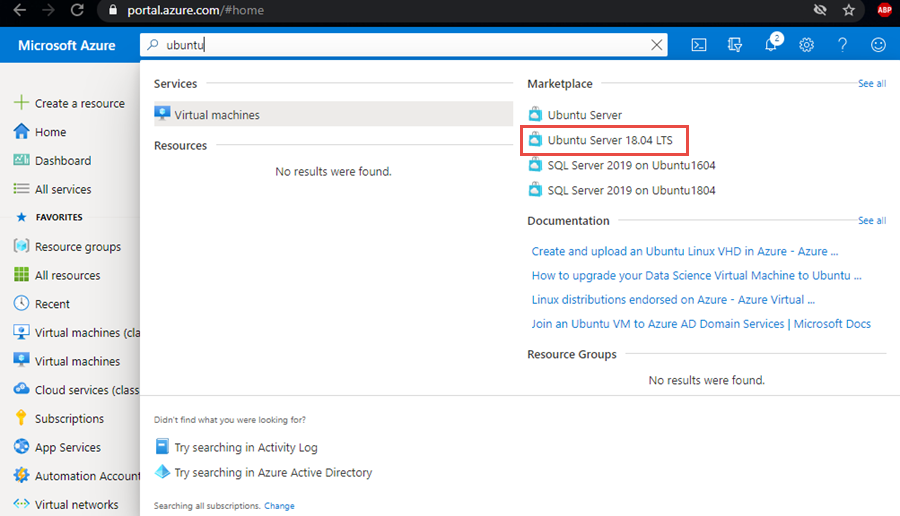
选择映像,然后选择“ 创建”。
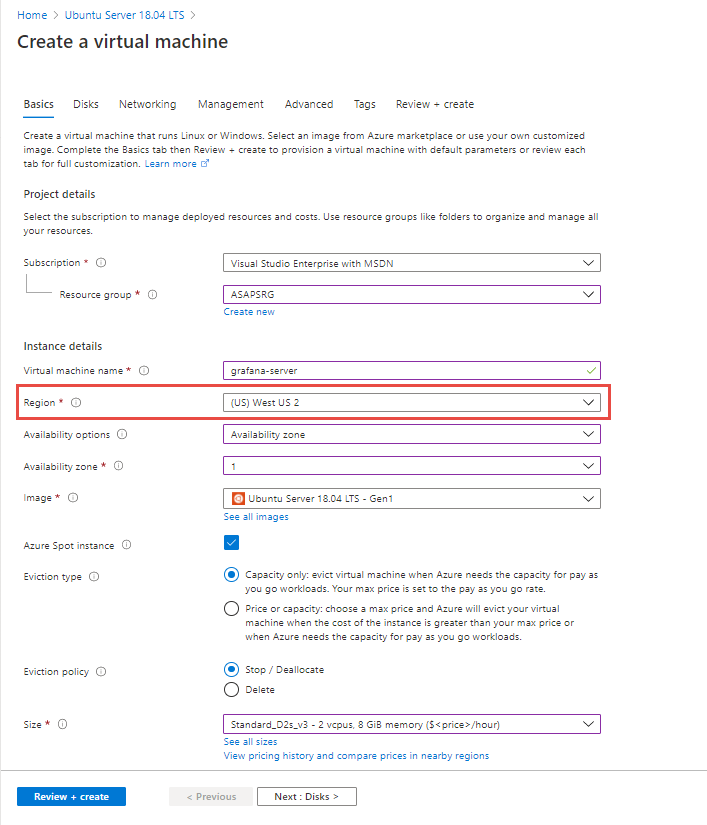
在“ 创建虚拟机 ”窗格中,输入以下字段的值。 可以保留其他字段的默认值:
- 虚拟机名称:输入 VM 的名称。
- 区域:选择部署虚拟网络的同一区域。
在“ 网络 ”选项卡上,选择在其中部署托管实例的虚拟网络。
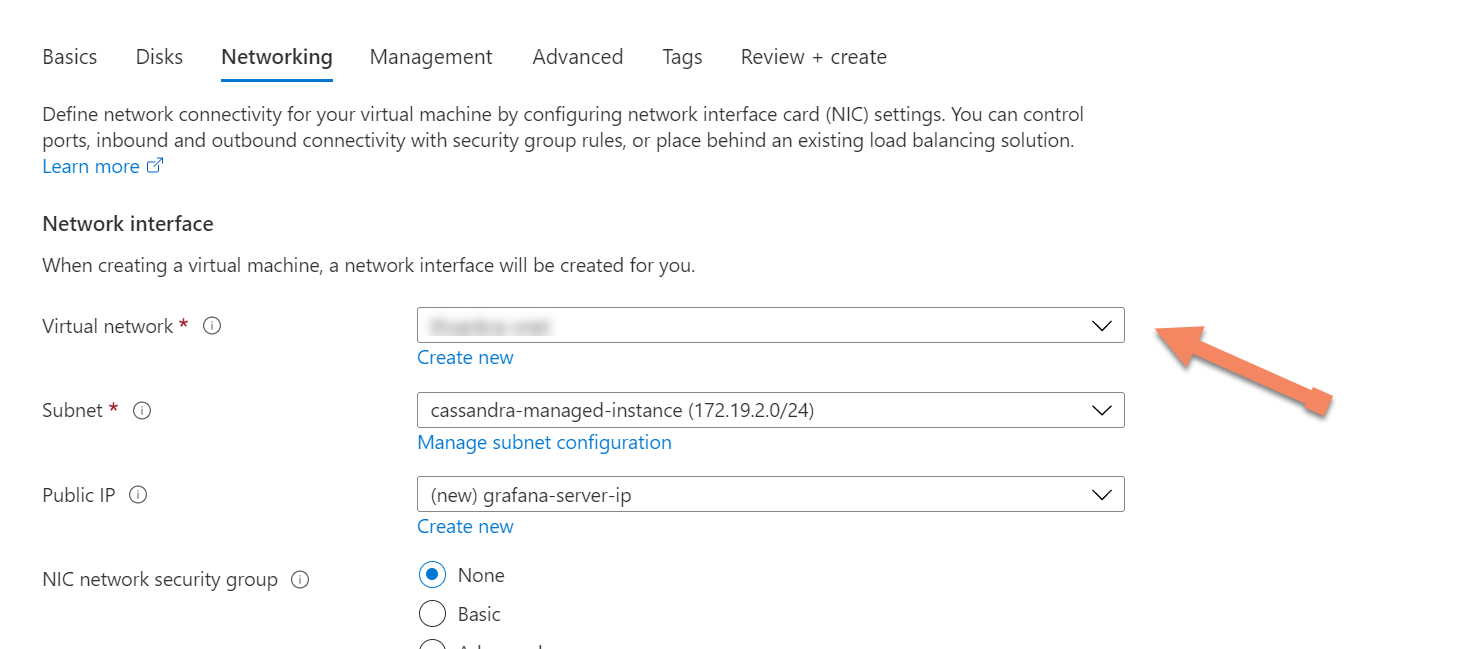
最后,选择 “查看 + 创建 ”以创建指标服务器。
安装 Prometheus 仪表板
首先,确保新部署的 Ubuntu 服务器的网络设置中定义了入站端口规则,允许开放端口
9090和3000。 Prometheus 和 Grafana 稍后需要这些端口。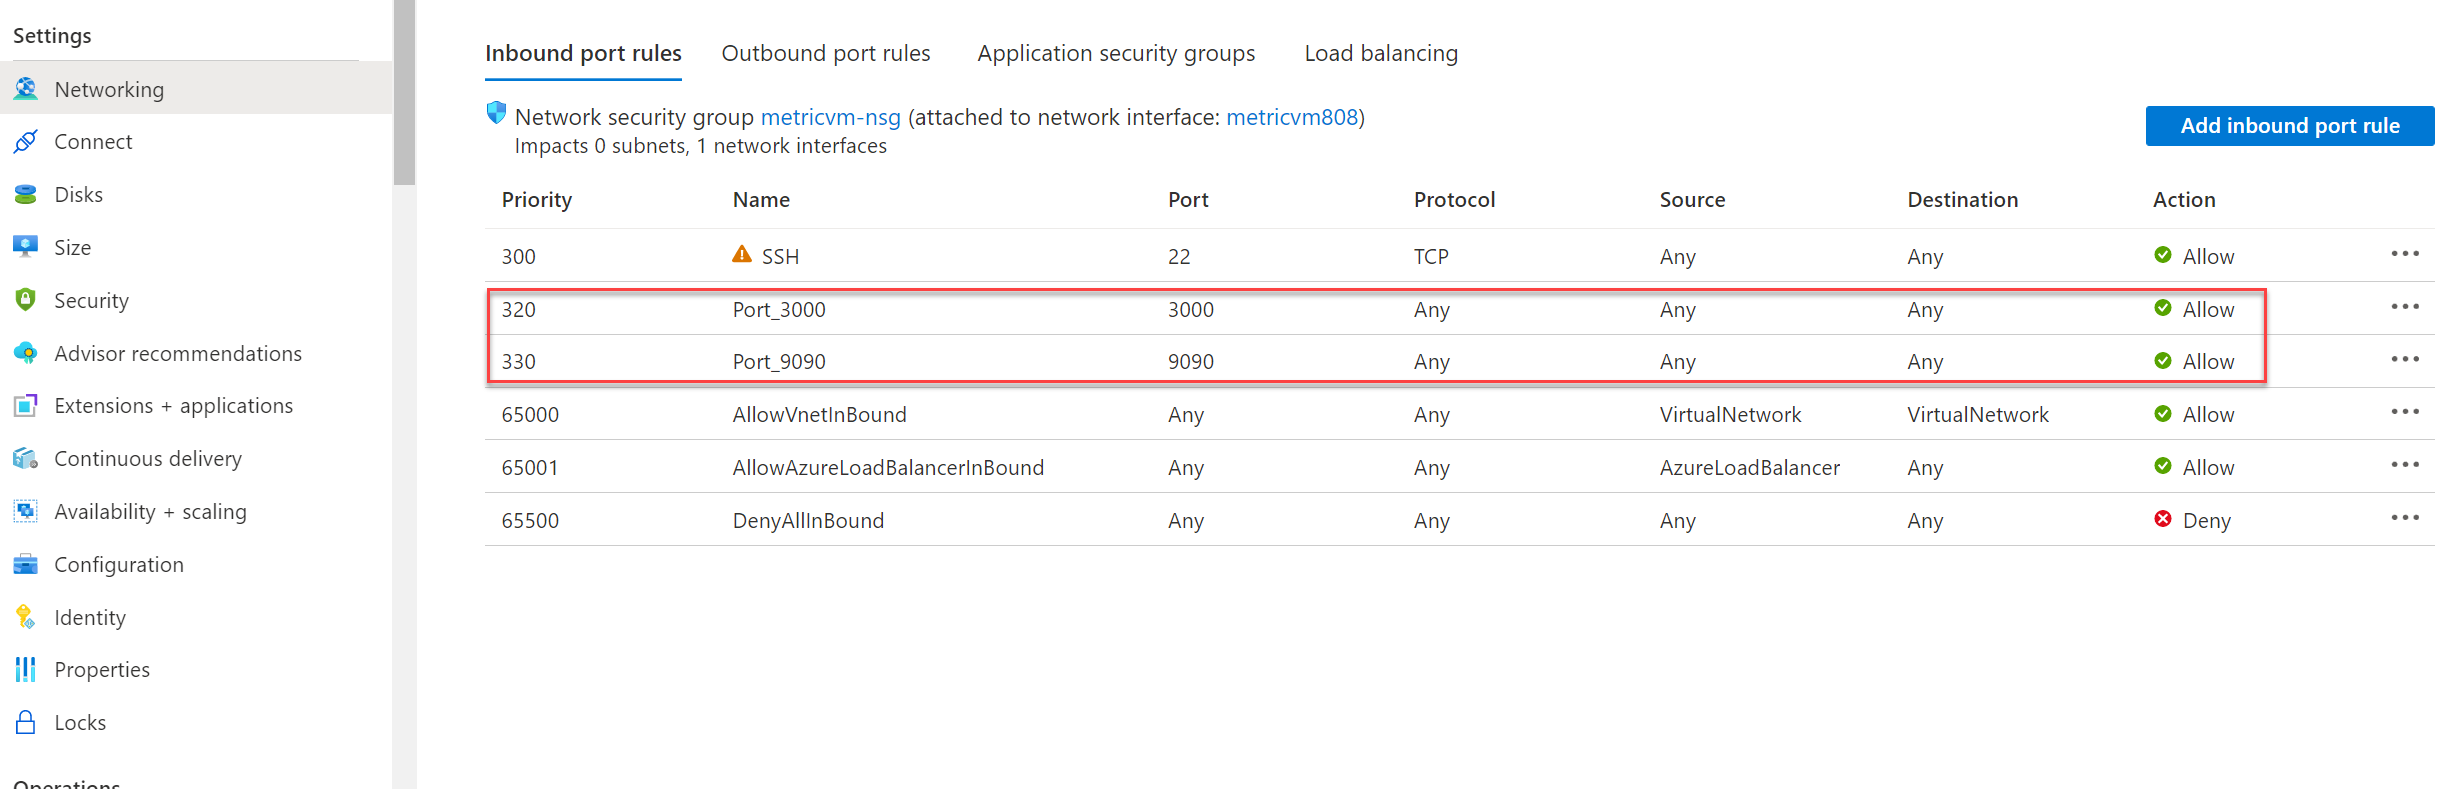
使用 Azure CLI 或首选客户端工具通过 Secure Shell 连接到 Ubuntu 服务器。
连接到 VM 后,安装指标收集器软件。 首先,下载文件并将其解压缩:
 #install unzip utility (if not already installed)
 sudo apt install unzip

 #get dashboards
 wget https://github.com/datastax/metric-collector-for-apache-cassandra/releases/download/v0.3.0/datastax-mcac-dashboards-0.3.0.zip -O temp.zip
 unzip temp.zip
接下来,转到 Prometheus 目录并用于
vi编辑tg_mcac.json文件:cd */prometheus vi tg_mcac.json在群集中添加群集
targets中每个节点的 IP 地址,每个节点都有端口 9443。 文件tg_mcac.json应如以下示例所示:[ { "targets": [ "10.9.0.6:9443","10.9.0.7:9443","10.9.0.8:9443" ], "labels": { } } ]保存文件。 接下来,在同一目录中编辑
prometheus.yaml文件。 找到以下部分:file_sd_configs: - files: - 'tg_mcac.json'在本部分的正下方,添加以下代码片段。 此步骤是必需的,因为指标是通过 HTTPS 公开的。
scheme: https tls_config: insecure_skip_verify: true该文件现在应如以下示例所示。 确保每行上的选项卡与示例匹配:
file_sd_configs: - files: - 'tg_mcac.json' scheme: https tls_config: insecure_skip_verify: true保存文件。 现在,你可以启动 Prometheus 和 Grafana。 首先,安装 Docker:
sudo apt install apt-transport-https ca-certificates curl software-properties-common
curl -fsSL https://download.docker.com/linux/ubuntu/gpg | sudo apt-key add -
sudo add-apt-repository "deb [arch=amd64] https://download.docker.com/linux/ubuntu `lsb_release -cs` test"
sudo apt update
sudo apt install docker-ce
然后安装
docker-compose:sudo apt install docker-compose现在,转到位于的
docker-compose.yaml顶级目录,并启动应用程序:cd .. sudo docker-compose upPrometheus 应该在你的指标服务器上的端口
9090处可用,Grafana 仪表板则在端口3000处可用。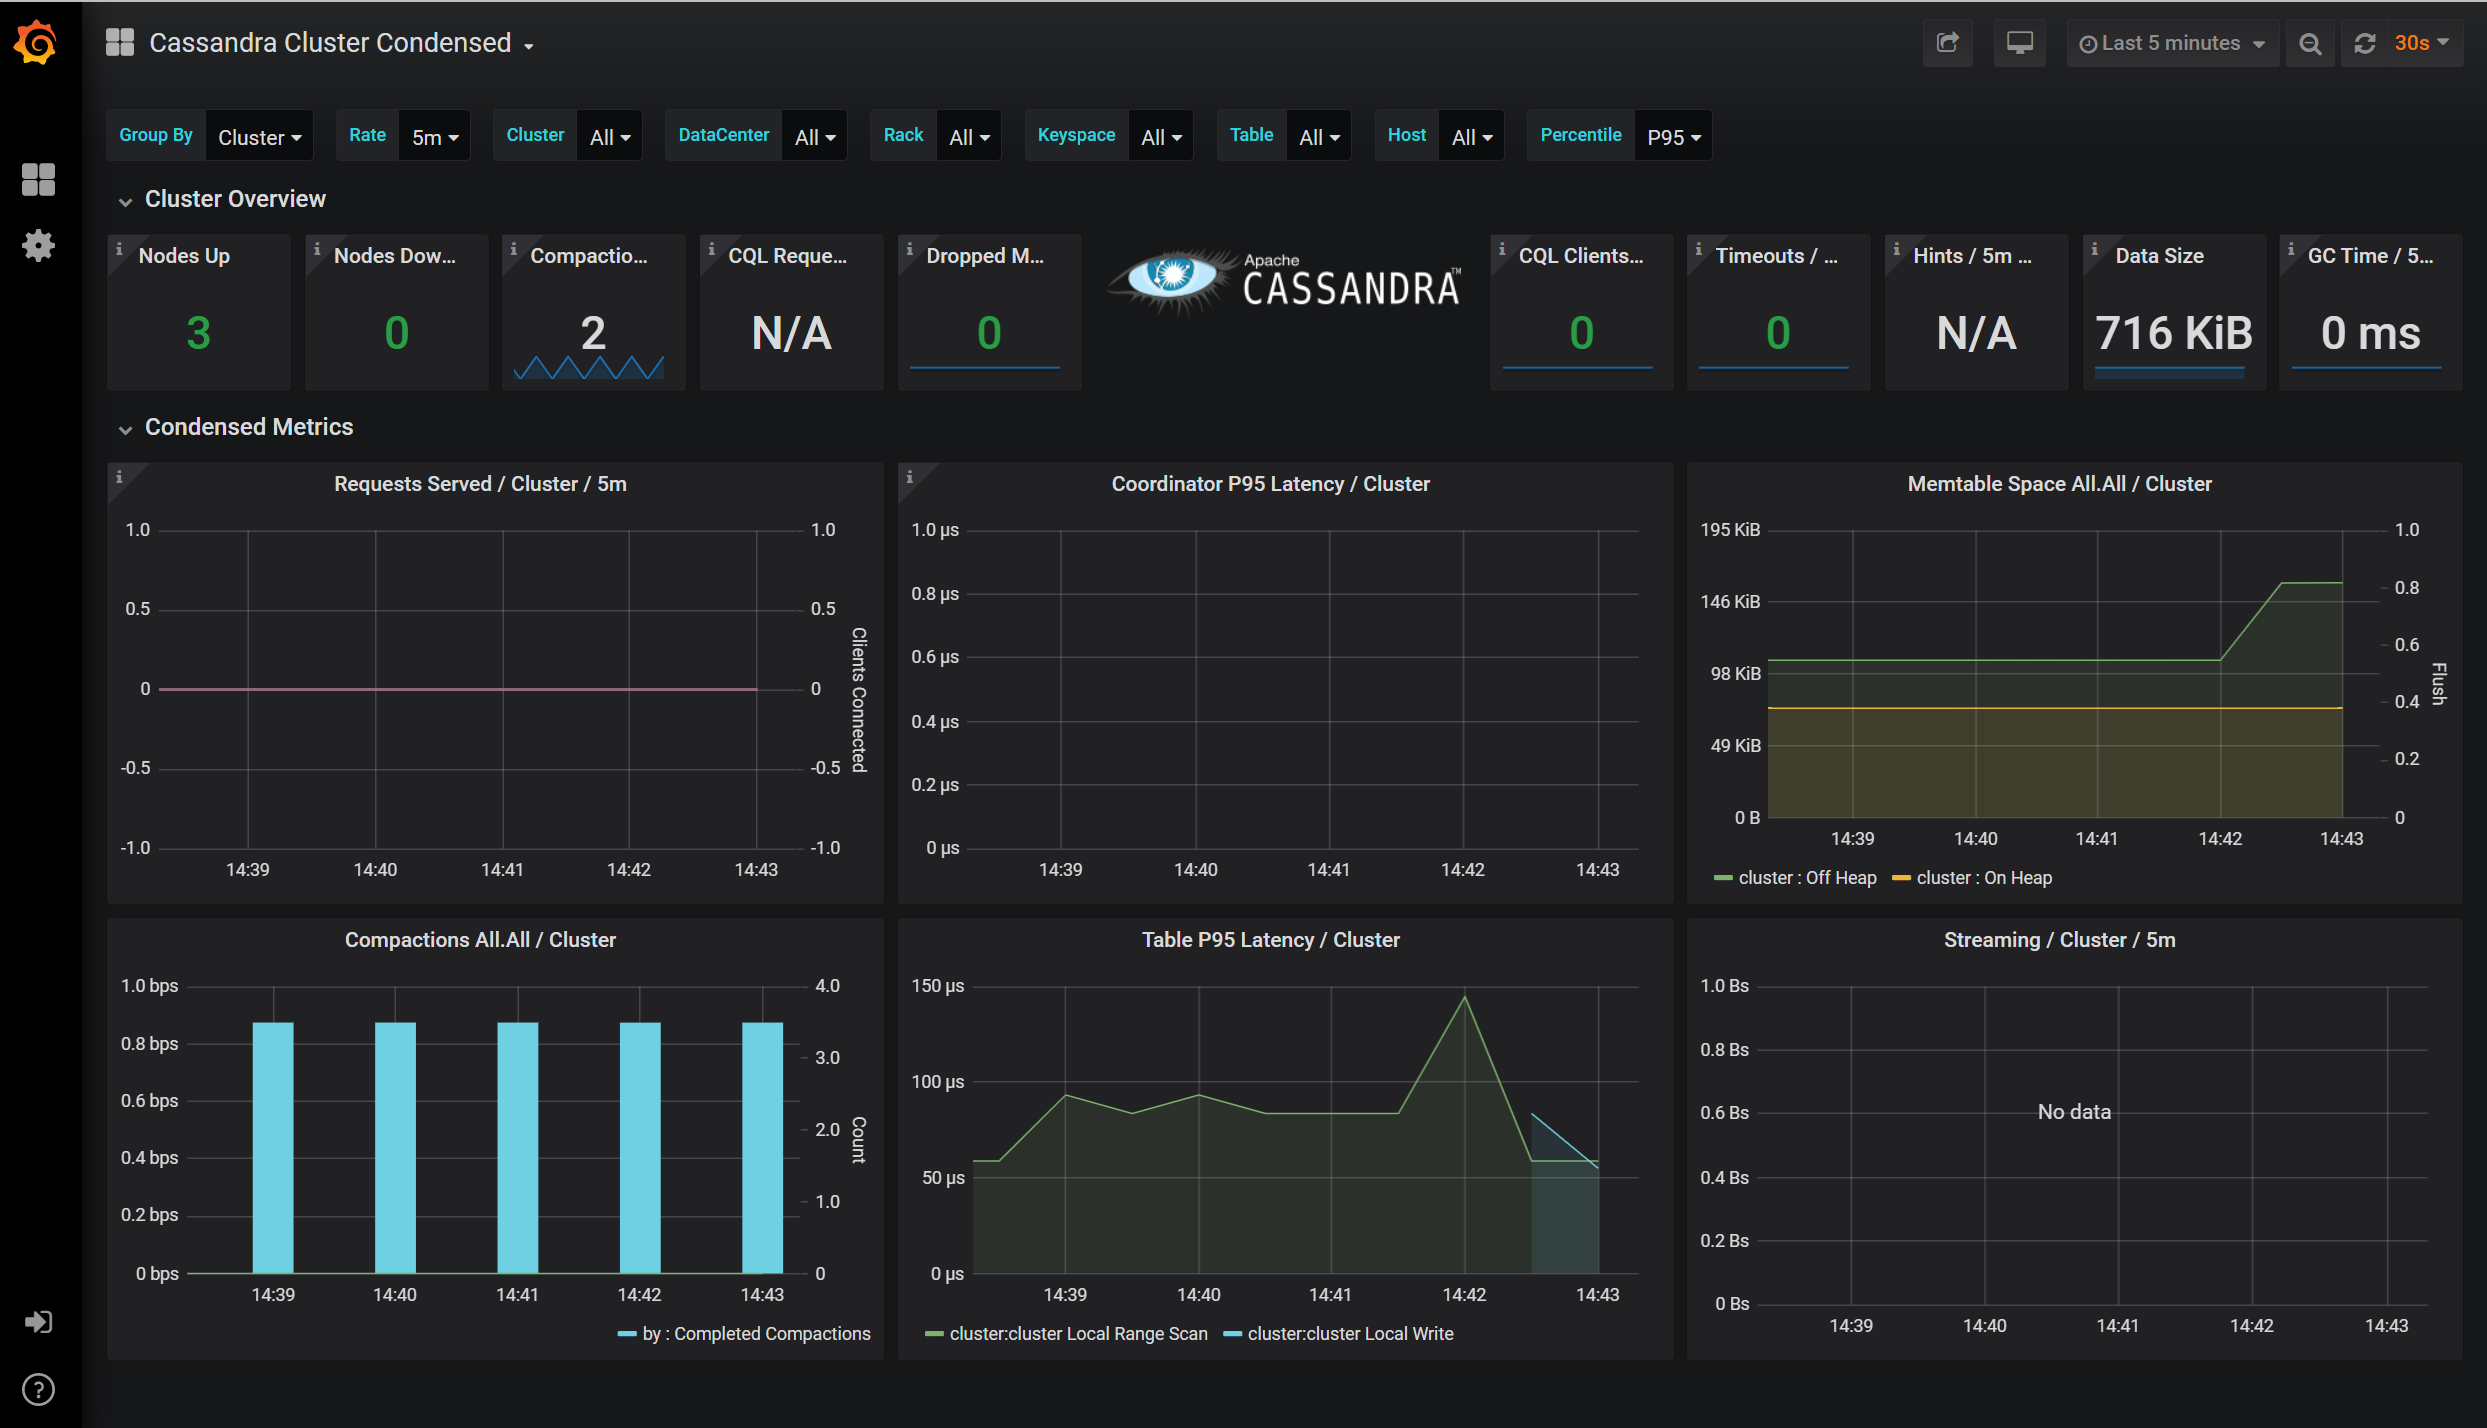
相关内容
本文介绍了如何使用 Grafana 配置仪表板以可视化 Prometheus 中的指标。 请参阅以下文章详细了解 Azure Managed Instance for Apache Cassandra: