Note
Access to this page requires authorization. You can try signing in or changing directories.
Access to this page requires authorization. You can try changing directories.
This tutorial shows how to use the Threads view of Parallel Stacks windows to debug a C# multithreaded application. This window helps you understand and verify the run-time behavior of multithreaded code.
The Threads view is also supported for C++ and Visual Basic, so the same principles described in this article for C# also apply to C++ and Visual Basic.
The Threads view helps you to:
View call stack visualizations for multiple threads, which provides a more complete picture of your app state than the Call Stack window, which just shows the call stack for the current thread.
Help identify issues such as blocked or deadlocked threads.
C# sample
The sample code in this walkthrough is for an application that simulates a day in the life of a gorilla. The purpose of the exercise is to understand how to use the Threads view of the Parallel Stacks window to debug a multithreaded application.
The sample includes an example of a deadlock, which occurs when two threads are waiting on each other.
To make the call stack intuitive, the sample app performs the following sequential steps:
- Creates an object representing a gorilla.
- Gorilla wakes up.
- Gorilla goes on a morning walk.
- Gorilla finds bananas in the jungle.
- Gorilla eats.
- Gorilla engages in monkey business.
Multithreaded call stacks
Identical sections of the call stack are grouped together to simplify the visualization for complex apps.
The following conceptual animation shows how grouping is applied to call stacks. Only identical segments of a call stack are grouped.
Create the sample project
To create the project:
Open Visual Studio and create a new project.
If the start window isn't open, choose File > Start Window.
On the Start window, choose New project.
On the Create a new project window, enter or type console in the search box. Next, choose C# from the Language list, and then choose Windows from the Platform list.
After you apply the language and platform filters, choose the Console App for .NET, and then choose Next.
Note
If you don't see the correct template, go to Tools > Get Tools and Features..., which opens the Visual Studio Installer. Choose the .NET desktop development workload, then choose Modify.
In the Configure your new project window, type a name or use the default name in the Project name box. Then, choose Next.
For .NET, choose either the recommended target framework or .NET 8, and then choose Create.
A new console project appears. After the project has been created, a source file appears.
Open the .cs code file in the project. Delete its contents to create an empty code file.
Paste the following code for your chosen language into the empty code file.
 using System.Diagnostics;

 namespace Multithreaded_Deadlock
 {
     class Jungle
     {
         public static readonly object tree = new object();
         public static readonly object banana_bunch = new object();
         public static Barrier barrier = new Barrier(2);

         public static int FindBananas()
         {
             // Lock tree first, then banana
             lock (tree)
             {
                 lock (banana_bunch)
                 {
                     Console.WriteLine("Got bananas.");
                     return 0;
                 }
             }
         }

         static void Gorilla_Start(object lockOrderObj)
         {
             Debugger.Break();
             bool lockTreeFirst = (bool)lockOrderObj;
             Gorilla koko = new Gorilla(lockTreeFirst);
             int result = 0;
             var done = new ManualResetEventSlim(false);

             Thread t = new Thread(() =>
             {
                 result = koko.WakeUp();
                 done.Set();
             });
             t.Start();
             done.Wait();
         }

         static void Main(string[] args)
         {
             List<Thread> threads = new List<Thread>();
             // Start two threads with opposite lock orders
             threads.Add(new Thread(Gorilla_Start));
             threads[0].Start(true);  // First gorilla locks tree then banana
             threads.Add(new Thread(Gorilla_Start));
             threads[1].Start(false); // Second gorilla locks banana then tree

             foreach (var t in threads)
             {
                 t.Join();
             }
         }
     }

     class Gorilla
     {
         private readonly bool lockTreeFirst;

         public Gorilla(bool lockTreeFirst)
         {
             this.lockTreeFirst = lockTreeFirst;
         }

         public int WakeUp()
         {
             int myResult = MorningWalk();
             return myResult;
         }

         public int MorningWalk()
         {
             Debugger.Break();
             if (lockTreeFirst)
             {
                 lock (Jungle.tree)
                 {
                     Jungle.barrier.SignalAndWait(5000); // For thread timing consistency in sample
                     Jungle.FindBananas();
                     GobbleUpBananas();
                 }
             }
             else
             {
                 lock (Jungle.banana_bunch)
                 {
                     Jungle.barrier.SignalAndWait(5000); // For thread timing consistency in sample
                     Jungle.FindBananas();
                     GobbleUpBananas();
                 }
             }
             return 0;
         }

         public void GobbleUpBananas()
         {
             Console.WriteLine("Trying to gobble up food...");
             DoSomeMonkeyBusiness();
         }

         public void DoSomeMonkeyBusiness()
         {
             Thread.Sleep(1000);
             Console.WriteLine("Monkey business done");
         }
     }
 }
After you update the code file, save your changes and build the solution.
On the File menu, select Save All.
On the Build menu, select Build Solution.
Use the Threads view of the Parallel Stacks window
To start debugging:
On the Debug menu, select Start Debugging (or F5) and wait for the first
Debugger.Break()to be hit.Press F5 once, and the debugger pauses again on the same
Debugger.Break()line.This pauses in the second call to
Gorilla_Start, which occurs within a second thread.Tip
The debugger breaks into code on a per-thread basis. For example, this means that if you press F5 to continue execution, and the app hits the next breakpoint, it may break into code on a different thread. If you need to manage this behavior for debugging purposes, you can add additional breakpoints, conditional breakpoints, or use Break All. For more information on using conditional breakpoints, see Follow a single thread with conditional breakpoints.
Select Debug > Windows > Parallel Stacks to open the Parallel Stacks window, and then select Threads from the View dropdown in the window.
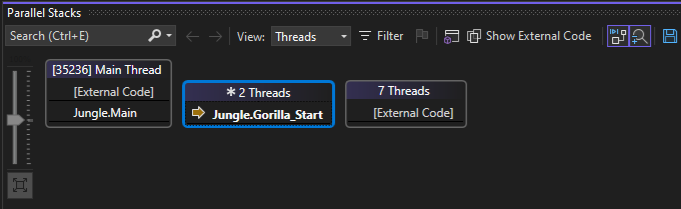
In Threads view, the stack frame and call path of the current thread are highlighted in blue. The current location of the thread is shown by the yellow arrow.
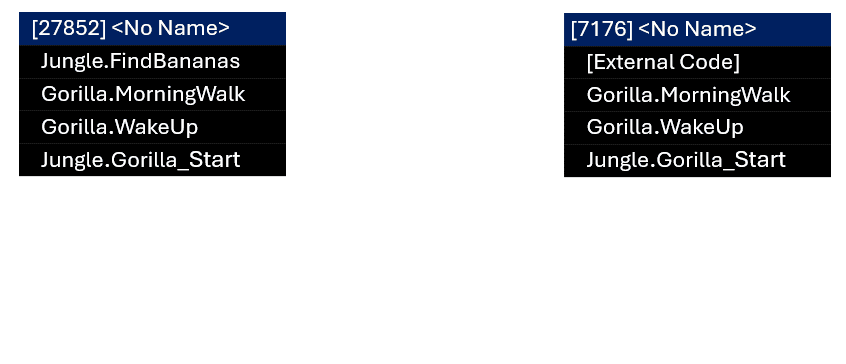
Notice the label for the call stack for
Gorilla_Startis 2 Threads. When you last pressed F5, you started another thread. For simplification in complex apps, identical call stacks are grouped together into a single visual representation. This simplifies potentially complex information, especially in scenarios with many threads.During debugging, you can toggle whether external code is displayed. To toggle the feature, select or clear Show External Code. If you show external code, you can still use this walkthrough, but your results might differ from the illustrations.
Press F5 again, and the debugger pauses in the
Debugger.Break()line in theMorningWalkmethod.The Parallel Stacks window shows the location of the current executing thread in the
MorningWalkmethod.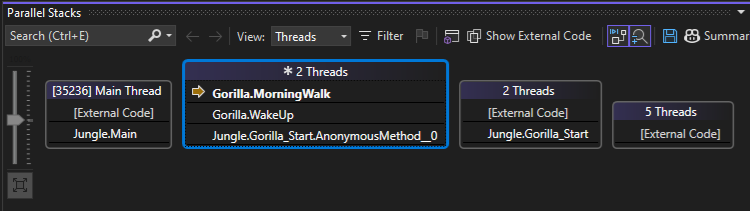
Hover over the
MorningWalkmethod to get information about the two threads represented by the grouped call stack.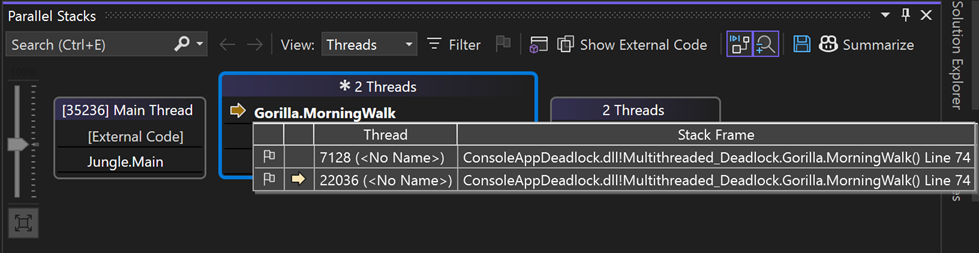
The current thread also appears in the Thread list in the Debug toolbar.
You can use the Thread list to switch the debugger context to a different thread. This does not change the current executing thread, just the debugger context.
Alternatively, you can switch the debugger context by double-clicking a method in the Threads view, or by right-clicking on a method in the Threads view and selecting Switch to Frame > [thread ID].
Press F5 again and the debugger pauses in the
MorningWalkmethod for the second thread.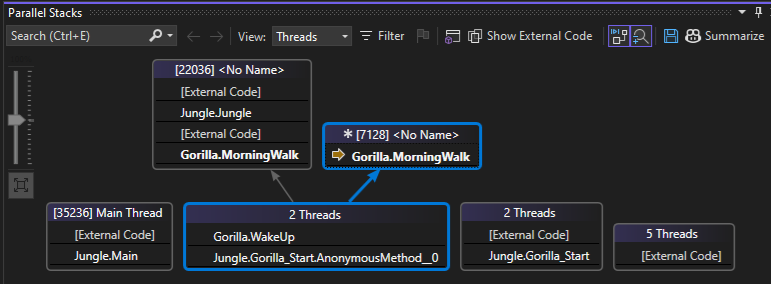
Depending on the timing of thread execution, at this point you see either separate or grouped call stacks.
In the preceding illustration, the call stacks for the two threads are partially grouped. The identical segments of the call stacks are grouped, and arrow lines point to the segments that are separated (that is, not identical). The current stack frame is indicated by the blue highlighting.
Press F5 again, and you will see a long delay occur and the Threads view doesn't show any call stack information.
The delay is caused by a deadlock. Nothing appears in the Threads view because even though threads may be blocked you aren't currently paused in the debugger.
Tip
The Break All button is a good way to get call stack information if a deadlock occurs or all threads are currently blocked.
At the top of the IDE in the Debug toolbar, select the Break All button (pause icon), or use Ctrl + Alt + Break.
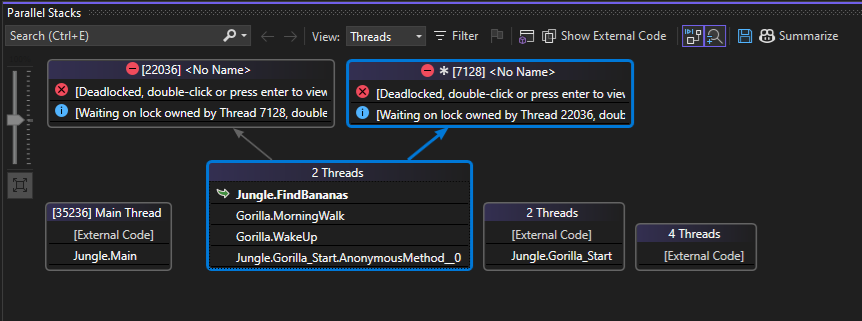
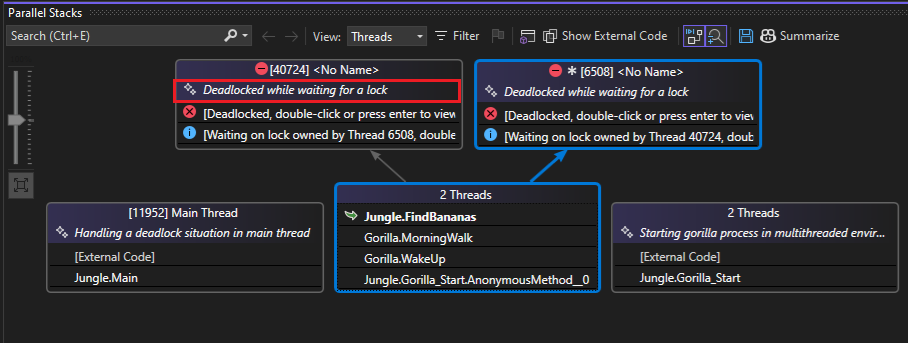
The top of the call stack in the Threads view shows that
FindBananasis deadlocked. The execution pointer inFindBananasis a curled green arrow, indicating the current debugger context but also it tells us that the threads are not currently running.In the code editor, we find the curled green arrow in the
lockfunction. The two threads are blocked on thelockfunction in theFindBananasmethod.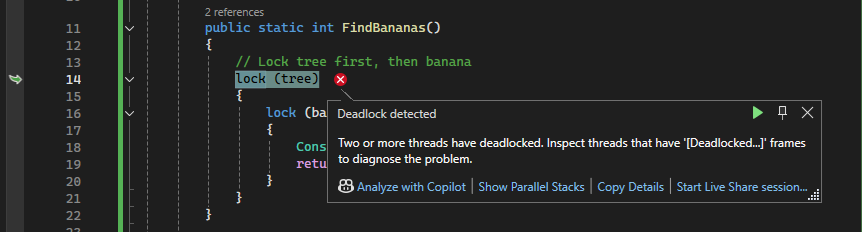
Depending on the order of thread execution, the deadlock appears in either the
lock(tree)orlock(banana_bunch)statement.The call to
lockblocks the threads in theFindBananasmethod. One thread is waiting for the lock ontreeto be released by the other thread, but the other thread is waiting for the lock onbanana_bunchto be released before it can release the lock ontree. This is an example of a classic deadlock that occurs when two threads are waiting on each other.If you're using Copilot, you can also get AI-generated thread summaries to help identify potential deadlocks.


Fix the sample code
To fix this code, always acquire multiple locks in a consistent, global order across all threads. This prevents circular waits and eliminates deadlocks.
To fix the deadlock, replace the code in
MorningWalkwith the following code.public int MorningWalk() { Debugger.Break(); // Always lock tree first, then banana_bunch lock (Jungle.tree) { Jungle.barrier.SignalAndWait(5000); // OK to remove lock (Jungle.banana_bunch) { Jungle.FindBananas(); GobbleUpBananas(); } } return 0; }Restart the app.
Summary
This walkthrough demonstrated the Parallel Stacks debugger window. Use this window on real projects that use multithreaded code. You can examine parallel code written in C++, C#, or Visual Basic.