Understand filtering techniques and considerations
Some report filtering techniques apply at design time, while others are relevant at report consumption time (in reading view). This unit describes filtering techniques that allow report consumers to intuitively narrow down to the data points that interest them.
Other filtering techniques
Beyond filters and slicers, report authors can employ other filtering techniques, such as:
- Visual interactions
- Drillthrough
- Report tooltip
- Bookmarks
- Report options
- Query reduction options
Visual interactions
By default, when report consumers interact with visuals, filters are propagated to other visuals on the report page. This way, visuals behave like slicers. For example, a report consumer can select a column of a column chart visual to filter other visuals on the page. To remove the cross filters, they can either select the column again or select a different visual.
Tip
While cross filtering, you can introduce more cross filters, even from other visuals, by pressing the Ctrl key.
Cross filtering (and cross highlighting) works between any two visuals. However, at design time, you can edit visual interactions between any pair of visuals and in either direction. Additionally, you can disable cross filtering or modify the interaction to use cross highlighting instead.
To gain a better understanding of visual interactions, watch the following video that describes a use case and shows how to configure it.
Drillthrough
Add drillthrough pages to allow report consumers to drill from visuals. By default, the drillthrough action propagates all filters that apply to the visual to the drillthrough page.
Report tooltip
Add report tooltips that will appear when report consumers hover the cursor over visuals. By default, the report tooltip receives all filters that apply to the visual.
Bookmarks
Bookmarks capture a specific view of a report, including filters, slicers, the page selection, and the state of visuals. Report authors and report consumers can create them.
Note
Report consumers can also create bookmarks known as personal bookmarks.
Because bookmarks can capture filter state and when invoked they apply that filter state. You can invoke bookmarks directly from the Bookmarks pane, or you can invoke them indirectly by selecting a button, image, or shape.
You can create a bookmark to capture the default state of slicers. A button on the report page could have the text Reset slicers, and when invoked, it uses the bookmark.
Other techniques
Report authors can configure report or visual settings to control filter options and behavior.
With report options, you can:
- Disable persistent filters. (Persistent filters are covered in Unit 5.)
- Hide visual headers for all visuals or for a specific visual. When the visual header is hidden, report consumers can't hover the cursor over the Filter icon to determine the filters that are applied to the visual. (The Filter icon is covered in Unit 5.)
- Hide the Filter icon for a specific visual.
- Restrict report consumers from changing filter types (for example, basic to advanced) in the Filters pane.
- Remove the search box in the Filters pane.
Report authors can also configure report settings to reduce the number of queries that are sent to the semantic model. Fewer queries result in better responsiveness as report consumers update filters or slicers or cross filter report pages.
Select report filter techniques
Filters and slicers are two different techniques that can achieve the same outcome.
Typically, the decision to use a filter or slicer is a tradeoff between performance and design. Consider that the Filters pane performs better (because Power BI doesn't need to render slicer visuals), and it doesn't take up space on the report page. However, you should also consider that slicers have the formatting flexibility to seamlessly integrate into the report page, creating the most refined experience possible for report consumption. Many ways are available for you to format a slicer, and the most important consideration is to ensure that it fits into the report design with an intuitive placement and user experience that meets requirements.
Here are the advantages associated with using the Filters pane:
- The Filters pane is consistently located on the right side of the report.
- It allows you to configure advanced filter types, like Top N, or allows you to use more complex expressions, like "contains," "doesn't contain," "is blank," and others.
- The search box and sort functions (to order filters within the sections) are powerful tools to use when many filters exist.
- Filters result in faster report rendering because no visual rendering is required.
- You can lock and/or hide filters.
- When the Apply button is enabled, you can submit all filter updates at once, resulting in fewer queries.
- You can filter by using measures (only at visual level).
Here are the disadvantages associated with using the Filters pane:
- The Filters pane offers less design flexibility, though you can style it by using specific fonts and colors.
- Careful consideration should be made to hide certain filters to avoid confusing report consumers.
- It can be easy to lose track of applied visual-level filters.
Here are the advantages associated with using slicers:
- You can place slicers anywhere on the report page to produce an intuitive layout.
- Slicers are highly configurable to achieve the required functionality and style.
- You can configure hierarchical slicers (based on a hierarchy or by using multiple fields that are sourced from the same table).
- They can display their selection (filter context) directly on the report page.
- They can display images when you're using a field that is categorized as an image URL.
- They can filter only certain visuals by editing visual interactions.
- You can filter slicers as you would any visual. For example, you can apply a filter to a slicer to remove the BLANK item.
- You can sort slicer items.
- Synced slicers can filter other pages in the report.
Here are the disadvantages associated with using slicers:
- Slicers can affect the report render performance due to the visual render time.
- They occupy space on the page instead of other data visuals.
- Slicer filtering options are less complex than the advanced filter options that are possible in the Filters pane. For example, you can't configure a Top N slicer.
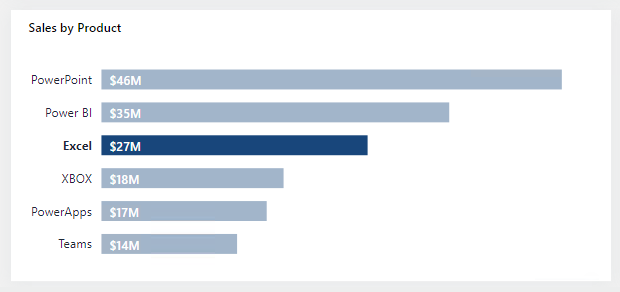
Bear in mind that you can enable filtering by using visuals. For example, a sales by product bar chart can behave like a slicer when report consumers select a single or multiple bars. However, a downside to this approach is that some report consumers might not know that visuals can cross filter other visuals.
In the following bar chart, the report page is filtered by the product Excel.
Filtering tips
Here are some filtering tips to help you produce successful report designs:
- Use either filters or slicers. Avoid using both filter techniques because it can create confusion.
- In the Filters pane, consider locking or hiding visual-level filters to avoid confusing report consumers. (Often, report consumer shouldn't modify or see visual-level filters.)
- Create a bookmark to reset all slicers to default values. Then, add a button to the page to invoke the bookmark. For example, the button could be captioned as Reset slicers.
- When a requirement is in place to lay out many slicers, consider creating a page that is dedicated to showing all slicers. For example, the page could be named Slicers. Sync the slicers to other pages and then set the slicers as hidden on those pages. This design technique requires that report consumers should always go to the Slicers page to modify slicer settings. To help them, you can add a page navigation button at a consistent location on each page so that they can easily return to the Slicers page.
- Consider using other visuals in place of slicers. Be sure to show report consumers how to cross filter by using these visuals.

