Apply filters and slicers to reports
Report filtering is a complex topic because many techniques are available for filtering a report. However, with complexity comes control, allowing you to design reports that meet requirements and expectations. This unit introduces filtering capabilities and describes the techniques you can apply to your report at design time.
Introduction to report filtering
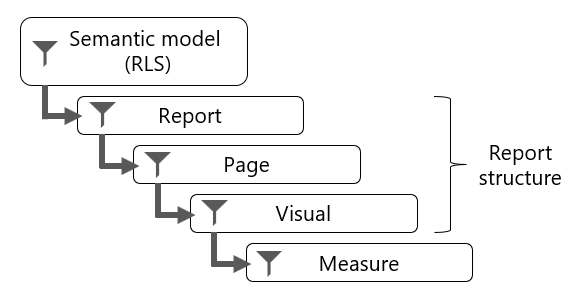
Filtering can occur at five different levels of a report:
- Semantic model, with row-level security (RLS)
- Report
- Page
- Visual
- Measure
Report, page, and visual level filters apply to the structure of the report.
Semantic model
Every report queries a single semantic model, which must be a semantic model. The semantic model can enforce row-level security (RLS) to restrict access to a subset of data, and different users see different data. A report can't determine whether the semantic model enforces RLS, and it can't override RLS.
Important
When you filter RLS-filtered tables, take care to avoid situations where some report consumers see no data (BLANK) in the report. For example, consider a model that enforces RLS to restrict data visibility to specific countries/regions. If you have permission to see Australian data and filter the report by Australia, a report consumer with permission to see only United States data doesn't see any data.
Report structure
The structure of a report is hierarchical. The structure of the report is as follows:
- The top level is the report.
- The second level comprises its pages.
- The third level comprises report objects, which consist of visuals and elements.
In the Filters pane, you can add a filter to any of these levels.
Measure
Measures are calculations created to summarize data in the semantic model. Measure formulas, which are written in Data Analysis Expressions (DAX), can modify filter context by using the CALCULATE or CALCULATETABLE function. These functions are powerful and provide you with the flexibility to add, remove, or modify filters and relationships. A set of DAX functions, known as time intelligence functions, also modify filter context. These functions can override any filters that are applied to the report structure.
At report design time (only in Power BI Desktop), you can create measures. These measures belong to the report, and so they're called report-level measures.
A good example of a measure that overrides report filters is a three-month moving average calculation. To compute the result for March, the filter context for month must expand to encompass January, February, and March. The CALCULATE function or a time intelligence function can modify the filter context to produce the desired result.
To gain a better understanding of report filtering, watch the following video that describes filter techniques at design time and consumption time.
Note
The video mentions datasets, which are now known as semantic models.
Apply filters to the report structure
At report design time, use the Filters pane to apply filters to the report structure.
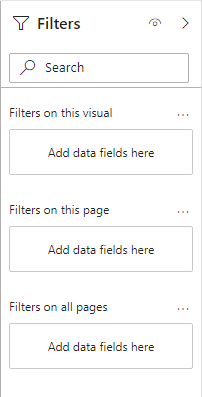
The Filters pane has three sections:
- Filters on all pages
- Filters on this page
- Filters on this visual
The Filters on all pages section defines report-level filters, which apply to all report pages and visuals. Consider that report-level filters are global filters.
The Filters on this page section defines page-level filters, which apply to all visuals on a specific page, adding to any existing report-level filters. For example, if a report-level filter restricts data to the country/region of United States, and a page-level filter restricts data to the state of Washington, then both filters are in effect: Country/region is United States and State-Province is Washington.
The Filters on this visual section defines visual-level filters. This section is only visible when one visual is in focus because visual-level filters apply only to a single visual; they add to any existing report-level and page-level filters. Continuing the previous example, if a visual-level filter restricts data to the city of Seattle, then three filters are in effect: Country/region is United States, State-Province is Washington, and City is Seattle.
Unlike report and page-level filters, a visual-level filter can filter by using a measure. When a measure filters a visual, it's used to eliminate groups. For example, consider a column chart visual that groups by store. A measure filter could eliminate groups (stores) where the total store sales are less than a certain amount.
Filters apply to a single field and use one of following filter types:
- Basic
- Advanced, which allows you to create more complex conditions by using data type-specific operators
- Top N
- Relative date and Relative time
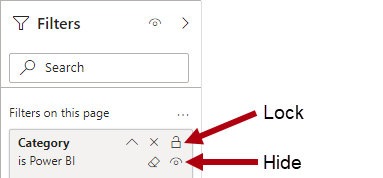
You can lock filters to ensure that report consumers can't remove or modify them. It's a good idea to lock filters that are critical to the design of the report, page, or visual. Additionally, you can hide filters. A hidden filter isn't visible to report consumers. Consider hiding a filter when the report consumer doesn't need to know about it, such as when filters are cleaning up the data, perhaps by removing BLANKs.
You can hide the entire Filters pane to ensure that report consumers can't open it.
Apply filters with slicers
The Slicer is a core visual with one purpose: filter other visuals. It's one of the most common visuals that you add to a report page because it presents an intuitive way for report consumers to filter data. As a report author, you have considerable control over how the visual is laid out and formatted and how it functions.
By default, slicers filter all other visuals on the page. However, you can edit visual interactions to restrict filtering between two visuals. We cover visual interactions later in this module. Sync slicers can also extend to filter visuals on other pages.
Important
It might be tempting to think that slicers apply page-level filters because that's the default result. However, it's important to understand that a slicer is a visual that propagates filters to other visuals on the same page or (when synced) across other pages.
You can configure a slicer by using one or more fields from the same table or a hierarchy. When configured to use multiple fields or a hierarchy, the slicer presents an expandable tree structure of items.
The slicer layout is responsive to the data type of the field. Field data types are either text, numeric, or date. By default, a text field produces a list slicer, a numeric field produces a numeric range "between" filter, and a date field produces a date range "between" filter, allowing value selection with calendar controls.
At design time, you can modify the slicer layout so that lists become dropdown lists. Dropdown lists use much less space on the report page. Numeric and date ranges offer more layouts, allowing you to select a single value that acts as the lower or upper boundary of the filter. The reason why numeric and date slicers have other layouts is because these data types represent continuous values. Therefore, the slicer layouts allow filtering by ranges of continuous values.
Note
To change the slicer style, select Format your visual > Slicer settings > Visual > Options > Style.
A slicer based on a date field offers other layouts to filter by relative date or time. Relative filters allow the report consumer to filter by past, present, or future time periods based on the current date and time. For example, a relative date slicer could filter by the current date (today).
Tip
Dropdown slicer layouts are common; they help minimize the size of the slicer to provide more room on the page for other visuals. Another benefit when using dropdown slicers that might not be immediately apparent is that they only query the semantic model when expanded open. Therefore, they can also help expedite report page rendering.
List and dropdown slicers support format options to control the selection of items. When you enable the Single select option, the slicer allows only a single item selection. That approach makes sense for a slicer like scenario, where the options are Actual, Budget, or Forecast. In this case, it only makes sense to filter by one scenario at a time.


