Reduce cardinality
Cardinality is a term that's used to describe the uniqueness of the values in a column. Cardinality is also used in the context of model relationships, where it describes the direction of the relationship.
Identify cardinality levels in columns
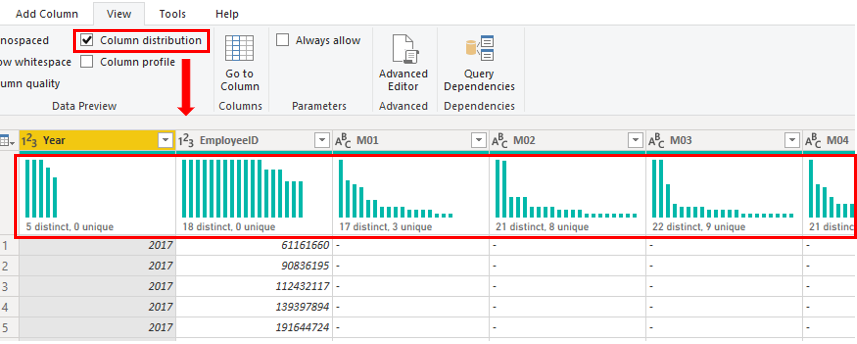
Previously, when you used Power Query to analyze the metadata, the Column distribution option on the View ribbon tab displayed statistics on how many distinct and unique items were in each column in the data.
- Distinct values count - The total number of different values found in a given column.
- Unique values count - The total number of values that only appear once in a given column.
A column that has many repeated values in its range (unique count is low) has a low level of cardinality. Conversely, a column that has many unique values in its range (unique count is high) has a high level of cardinality.
Lower cardinality leads to more optimized performance, so you should try to reduce the number of high cardinally columns in your semantic model.
Reduce relationship cardinality
When you import multiple tables, it's possible that you'll do some analysis by using data from all those tables. Relationships between those tables are necessary to accurately calculate results and display the correct information in your reports. Power BI Desktop helps make creating those relationships easier. In fact, in most cases, you won't need to do anything because the autodetect feature can do it for you. However, you might occasionally need to create relationships or make changes to a relationship. Regardless, it's important to understand relationships in Power BI Desktop and how to create and edit them.
When you create or edit a relationship, you can configure other options. By default, Power BI Desktop automatically configures other options based on its assessment of the model data, which can be different for each relationship based on the data in the columns.
The relationships can have different cardinality. Cardinality is the direction of the relationship, and each model relationship must be defined with a cardinality type. The cardinality options in Power BI are:
- Many-to-one (*:1) - This relationship is the most common. It means that the column in one table can have more than one instance of a value, and the other related table, often known as the lookup table, has only one instance of a value.
- One-to-one (1:1) - The column in one table has only one instance of a particular value, and the other related table has only one instance of a particular value.
- One-to-many (1:*) - The column in one table has only one instance of a particular value, and the other related table can have more than one instance of a value.
- Many-to-many (*:*) - With composite models, you can establish a many-to-many relationship between tables, which removes requirements for unique values in tables. It also removes previous workarounds, such as introducing new tables only to establish relationships.
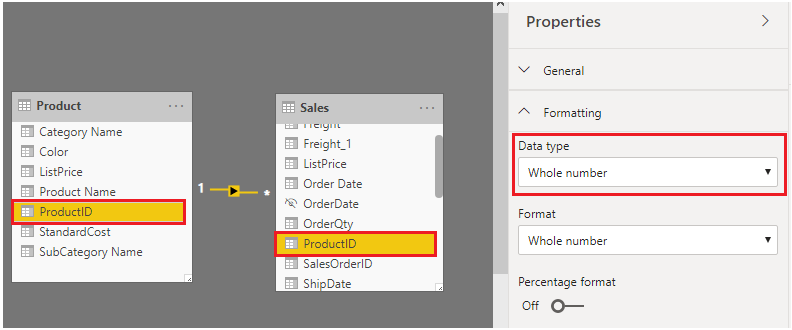
During development, you create and edit relationships in your model, so when you're building new relationships in your model, regardless of what cardinality you have chosen, always ensure that both of the columns that you are using to participate in a relationship have the same data type. Your model will never work if you try to build a relationship between two columns, where one column has a text data type and another column has an integer data type.
In the following example, the ProductID column has the Whole number data type in both the Product and Sales tables. The columns with data type Integer perform better than columns with data type Text.
Improve performance by reducing cardinality levels
Power BI Desktop offers different techniques that you can use to help reduce the data that's loaded into semantic models, such as summarization. Reducing the data that's loaded into your model improves the relationship cardinality of the report. For this reason, it's important that you strive to minimize the data that's loaded into your models. That's especially true for large models, or models that you anticipate will grow to become large over time.
Perhaps the most effective technique to reduce a model size is to use a summary table from the data source. Where a detail table might contain every transaction, a summary table might contain one record per day, per week, or per month. It might be a sum of all of the transaction amounts per day, for instance.
For example, a source sales fact table stores one row for each order line. Significant data reduction could be achieved by summarizing all sales metrics when you group by date, customer, and product, and individual transaction detail isn't needed.
Consider, then, that you can achieve an even more significant data reduction by summarizing at month level. It could achieve a possible 99 percent reduction in model size; but, reporting at day level or an individual order level is no longer possible. Deciding to summarize fact data always involves a tradeoff with the detail of your data. A disadvantage is that you might lose the ability to drill into data because the detail no longer exists. This tradeoff could be mitigated by using a Composite model.
In Power BI Desktop, a Composite model allows you to determine a storage mode for each table. Therefore, each table can have its Storage Mode property set as Import or DirectQuery.
An effective technique to reduce the model size is to set the Storage Mode property for larger fact tables to DirectQuery. This design approach can work well in conjunction with techniques that are used to summarize your data. For example, the summarized sales data could be used to achieve high performance "summary" reporting. You could then create a drillthrough page to display granular sales for a specific (and narrow) filter context, displaying all in-context sales orders. The drillthrough page could include visuals based on a DirectQuery table to retrieve the sales order data (sales order details).
For more information, see Data reduction techniques for Import modeling.

