Use DAX time intelligence functions
DAX includes several time intelligence functions to simplify the task of modifying date filter context. You can write many of these intelligence formulas by using a CALCULATE function that modifies date filters, but that creates more work.
Note
Many DAX time intelligence functions work with standard date periods such as years, quarters, and months. If you have irregular time periods, like financial months that do not match the calendar, or if you need to work with weeks or shorter time periods, the built-in DAX functions will not help. In these cases, use the CALCULATE function with custom date or time filters.
Date table requirement
To work with time intelligence DAX functions, you need to meet the prerequisite model requirement of having at least one date table in your model. A date table is a table that is marked as a Date table. That table must have a column of data type Date (or date/time), known as the date column. The date column must:
- Contain unique values.
- Span full years.
- Not contain BLANKs.
- Not have any missing dates.
For more information, see Create date tables in Power BI Desktop.
Summarizations over time
One group of DAX time intelligence functions is concerned with summarizations over time:
DATESYTD- Returns a single-column table that contains dates for the year-to-date (YTD) in the current filter context. This group also includes theDATESMTDandDATESQTDfunctions for month-to-date (MTD) and quarter-to-date (QTD). You can pass these functions as filters into theCALCULATEfunction.TOTALYTD- Evaluates an expression for YTD in the current filter context. The equivalent QTD and MTD DAX functions ofTOTALQTDandTOTALMTDare also included.DATESBETWEEN- Returns a table that contains a column of dates that begins with a given start date and continues until a given end date.DATESINPERIOD- Returns a table that contains a column of dates that begins with a given start date and continues for the specified number of intervals.
Note
While the TOTALYTD function is simple to use, you're limited to passing in one filter expression. If you need to apply multiple filter expressions, use the CALCULATE function and then pass the DATESYTD function in as one of the filter expressions.
In the following example, you'll create your first time intelligence calculation that uses the TOTALYTD function. The syntax is as follows:
TOTALYTD(<expression>, <dates>, [, <filter>][, <year_end_date>])
The function requires an expression and, as is common to all time intelligence functions, a reference to the date column of a marked date table. Optionally, a single filter expression or the year-end date can be passed in (required only when the year doesn't finish on December 31).
Download and open the Adventure Works DW 2020 M07.pbix file. Then, add the following measure definition to the Sales table that calculates YTD revenue. Format the measure as currency with two decimal places.
Revenue YTD =
TOTALYTD(
    [Revenue],
    'Date'[Date],
    "6-30"
)
The year-end date value of "6-30" represents June 30.
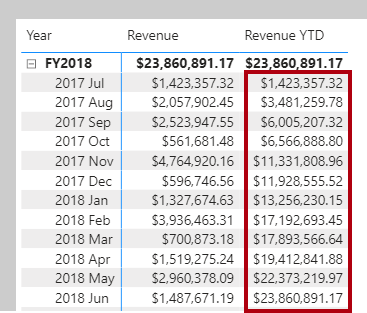
On Page 1 of the report, add the Revenue YTD measure to the matrix visual. Notice that it produces a summarization of the revenue amounts from the beginning of the year through to the filtered month.
Comparisons over time
Another group of DAX time intelligence functions is concerned with shifting time periods:
DATEADD- Returns a table that contains a column of dates, shifted either forward or backward in time by the specified number of intervals from the dates in the current filter context.PARALLELPERIOD- Returns a table that contains a column of dates that represents a period that is parallel to the dates in the specified dates column, in the current filter context, with the dates shifted a number of intervals either forward in time or back in time.SAMEPERIODLASTYEAR- Returns a table that contains a column of dates that are shifted one year back in time from the dates in the specified dates column, in the current filter context.- Many helper DAX functions for navigating backward or forward for specific time periods, all of which returns a table of dates. These helper functions include
NEXTDAY,NEXTMONTH,NEXTQUARTER,NEXTYEAR, andPREVIOUSDAY,PREVIOUSMONTH,PREVIOUSQUARTER, andPREVIOUSYEAR.
Now, you'll add a measure to the Sales table that calculates revenue for the prior year by using the SAMEPERIODLASTYEAR function. Format the measure as currency with two decimal places.
Revenue PY =
VAR RevenuePriorYear = CALCULATE(
    [Revenue],
    SAMEPERIODLASTYEAR('Date'[Date])
)
RETURN
    RevenuePriorYear
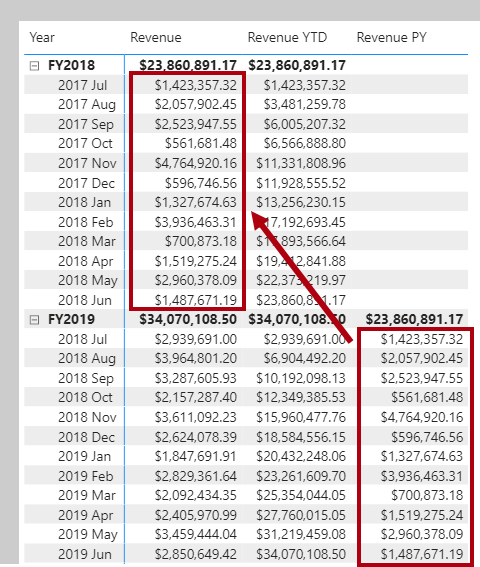
Add the Revenue PY measure to the matrix visual. Notice that it produces results that are similar to the previous year's revenue amounts.
Next, you'll modify the measure by renaming it to Revenue YoY % and then updating the RETURN clause to calculate the change ratio. Be sure to change the format to a percentage with two decimals places.
Revenue YoY % =
VAR RevenuePriorYear = CALCULATE(
    [Revenue],
    SAMEPERIODLASTYEAR('Date'[Date])
)
RETURN
    DIVIDE(
        [Revenue] - RevenuePriorYear,
        RevenuePriorYear
    )
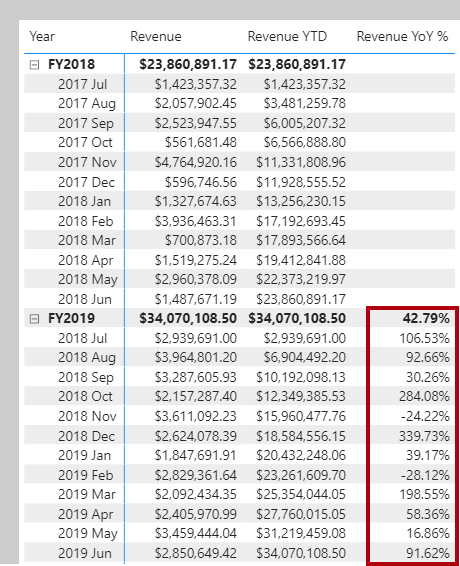
Notice that the Revenue YoY % measure produces a ratio of change factor over the previous year's monthly revenue. For example, July 2018 represents a 106.53 percent increase over the previous year's monthly revenue, and November 2018 represents a 24.22 percent decrease over the previous year's monthly revenue.
Note
The Revenue YoY % measure demonstrates a good use of DAX variables. The measure improves the readability of the formula and allows you to unit test part of the measure logic (by returning the RevenuePriorYear variable value). Additionally, the measure is an optimal formula because it doesn't need to retrieve the prior year's revenue value twice. Having stored it once in a variable, the RETURN clause uses to the variable value twice.


