Understand filter context
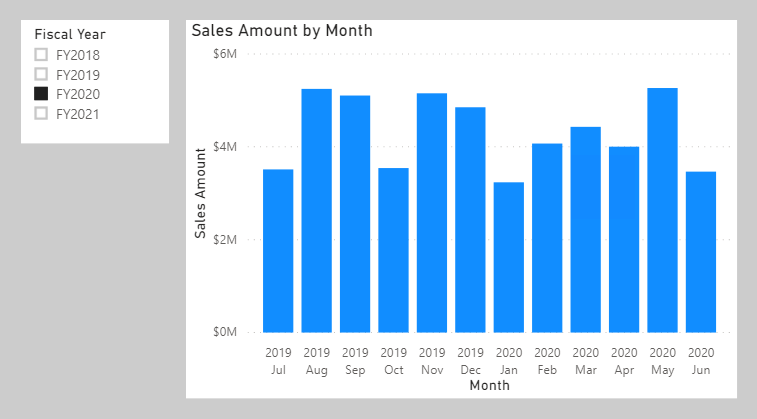
At report design time, filters are applied in the Filters pane or to report visuals. The slicer visual is an example of a visual whose only purpose is to filter the report page (and other pages when it's configured as a synced slicer). Report visuals, which perform grouping, also apply filters. They're implied filters; the difference is that the filter result is visible in the visual. For example, a stacked column chart visual can filter by fiscal year FY2020, group by month, and summarize sales amount. The fiscal year filter isn't visible in the visual result, yet the grouping, which results in a column for each month, behaves as a filter.
Not all filters are applied at report design time. Filters can be added when a report user interacts with the report. They can modify filter settings in the Filters pane, and they can cross-filter or cross-highlight visuals by selecting visual elements like columns, bars, or pie chart segments. These interactions apply other filters to report page visuals (unless interactions have been disabled).
It's important to understand how filter context works. It guides you in defining the correct formula for your calculations. As you write more complex formulas, you learn to identify when you need to add, modify, or remove filters to achieve the desired result.
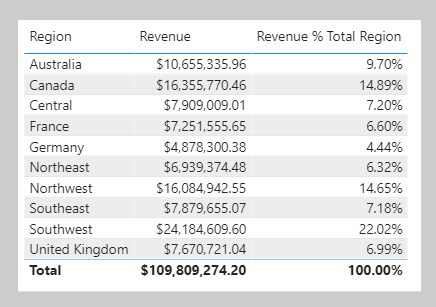
Consider an example that requires your formula to modify the filter context. Your objective is to produce a report visual that shows each sales region together with its revenue and revenue as a percentage of total revenue.
The Revenue % Total Region measure result is achieved by defining a measure expression that's the ratio of revenue divided by revenue for all regions. Therefore, for Australia, the ratio is 10,655,335.96 dollars divided by 109,809,274.20 dollars, which is 9.7 percent.
The numerator expression doesn't need to modify filter context; it should use the current filter context (a visual that groups by region applies a filter for that region). The denominator expression, however, needs to remove any region filters to achieve the result for all regions.
Tip
The key to writing complex measures is understanding these concepts:
- How filter context works.
- When and how to modify or remove filters to achieve a required result.
- How to write a formula to accurately and efficiently modify filter context.
These concepts take practice and time to fully understand. Rarely will students understand the concepts from the beginning of training. Therefore, be patient and persevere with the theory and activities. We recommend that you repeat this module at a later time to help reinforce key lessons.
The next unit introduces the CALCULATE function. It's one of the most powerful DAX functions, allowing you to modify filter context when your formulas are evaluated.

