Use iterator functions
Iterator functions evaluate an expression for each row in a table. They give you flexibility and control over how your model summarizes data.
Single-column summarization functions, such as SUM, COUNT, MIN, and MAX, have equivalent iterator functions with an "X" suffix, like SUMX, COUNTX, MINX, and MAXX. Specialized iterator functions also exist for filtering, ranking, and semi-additive calculations over time.
Every iterator function requires a table and an expression. The table can be a model table or any expression that returns a table. The expression must return a single value for each row.
Single-column summarization functions, like SUM, act as shorthand. Power BI internally converts SUM to SUMX. For example, both of the following measures return the same result and have the same performance:
Revenue = SUM(Sales[Sales Amount])
Revenue =
SUMX(
    Sales,
    Sales[Sales Amount]
)
Iterator functions evaluate the expression for each row in a table, using row context—meaning they process one row at a time to compute the final result. Then the table is evaluated in filter context. For example, if a report visual filters by fiscal year FY2020, the Sales table contains only sales rows from that year.
Important
Using iterator functions with large tables and complex expressions can slow performance. Functions like SEARCH and LOOKUPVALUE can be expensive. When possible, use RELATED for better performance.
Iterator functions for complex summarization
Iterator functions let you aggregate more than a single column. For example, a revenue measure can multiply order quantity, unit price, and a discount factor for each row, then sum the results.
Revenue =
SUMX(
    Sales,
    Sales[Order Quantity] * Sales[Unit Price] * (1 - Sales[Unit Price Discount Pct])
)
Iterator functions can also reference related tables. The discount measure can use the RELATED function to access the list price from the product table:
Discount =
SUMX(
    Sales,
    Sales[Order Quantity]
    * (
        RELATED('Product'[List Price]) - Sales[Unit Price]
    )
)
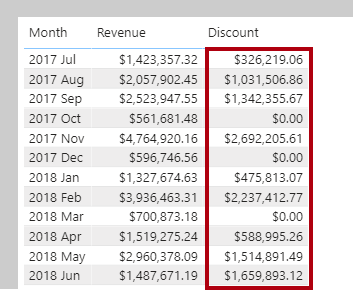
The following image shows a table visual with the Month, Revenue, and Discount columns. Revenue and Discount are the measures previously created.
Iterator functions for higher grain summarization
Iterator functions can also summarize data at different levels of detail (grain). For example, you might want to calculate an average at the line item level or at the sales order level.
In this example, the Sales table contains one row for each line item in a sales order. Each row includes details such as the sales order number, product, quantity sold, unit price, and discount. Multiple rows can have the same sales order number, representing different items within the same order.
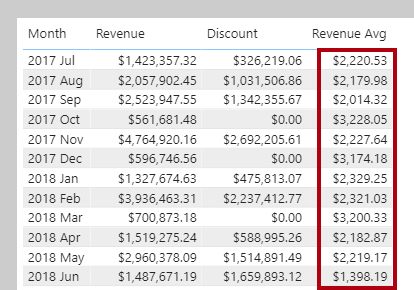
To calculate the average revenue per order line (line item), you can use the AVERAGEX function to iterate over each row in the Sales table. The formula calculates revenue for each line item, then averages the result across all line items in the current filter context:
Revenue Avg Order Line =
AVERAGEX(
    Sales,
    Sales[Order Quantity] * Sales[Unit Price] * (1 - Sales[Unit Price Discount Pct])
)
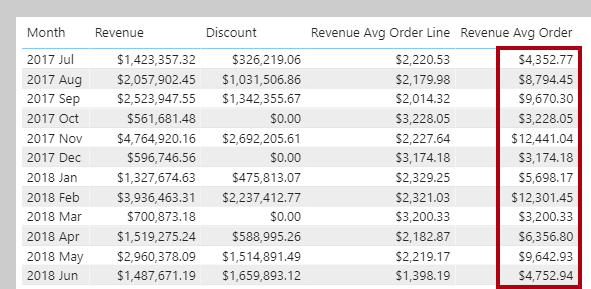
If you want to calculate the average revenue per sales order (rather than per line item), you can use the VALUES function to get a list of unique sales order numbers first. Then, AVERAGEX iterates over each sales order and averages the total revenue for each order:
Revenue Avg Order =
AVERAGEX(
    VALUES('Sales Order'[Sales Order]),
    [Revenue]
)
The VALUES function returns the unique sales orders based on the current filter context, so AVERAGEX iterates over each sales order for each month.
Ranking with iterator functions
The RANKX function calculates ranks by iterating over a table and evaluating an expression for each row.
Order direction can be ascending or descending. Ranking revenue usually uses descending order, so the highest value ranks first. Ranking something like complaints might use ascending order, so the lowest value ranks first. By default, RANKX uses descending order and skips ranks for ties.
For example, a product quantity rank measure can use RANKX and the ALL function to rank products by quantity:
Product Quantity Rank =
RANKX(
    ALL('Product'[Product]),
    [Quantity]
)
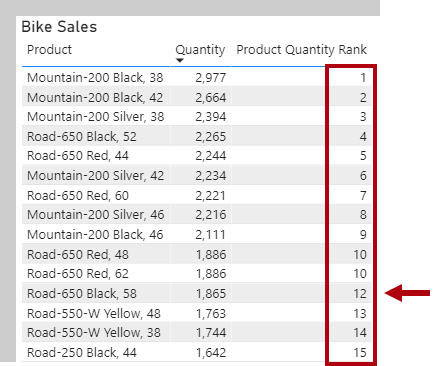
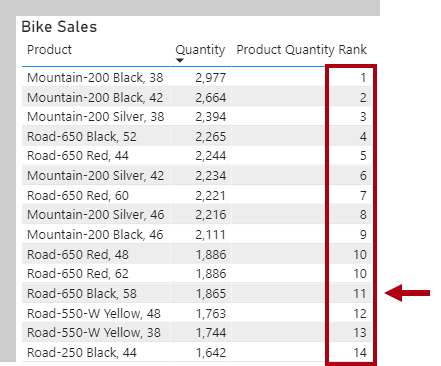
The ALL function removes filters, so RANKX ranks all products. In the following image, two products tie for tenth place, so the next product is ranked twelfth and rank 11 is skipped.
You can also use dense ranking, which assigns the next rank after a tie without skipping numbers. To use dense ranking, the measure can include the DENSE argument:
Product Quantity Rank =
RANKX(
    ALL('Product'[Product]),
    [Quantity],
    ,
    ,
    DENSE
)
Now, after two products tie for tenth place, the next product is ranked eleventh and numbering continues sequentially without skipping rank 11.
In this visual, the total row for the Product Quantity Rank measure shows one, because the total for all products is also ranked and there's only one value.
To avoid ranking the total, the measure can use the HASONEVALUE function to return BLANK unless a single product is filtered:
Product Quantity Rank =
IF(
    HASONEVALUE('Product'[Product]),
    RANKX(
        ALL('Product'[Product]),
        [Quantity],
        ,
        ,
        DENSE
    )
)
Now, the total for Product Quantity Rank is blank.
The HASONEVALUE function checks if the product column has a single value in filter context. This is true for each product group, but not for the total, which represents all products.
Iterator functions provide powerful ways to summarize, aggregate, and rank data in Power BI models. They support complex calculations and let you control the level of detail in your reports.
