Create explicit measures
You can add a measure to any table in your model by writing a DAX formula. A measure formula must return a single value. This section explains how to create explicit measures.
Measures don’t store values in the model. Instead, Power BI calculates them at query time to summarize model data. Measures can’t reference a table or column directly, so you must use a function to summarize the data.
Simple measures
A simple measure aggregates the values of a single column, just like an implicit measure.
For example, you can add a measure to the Sales table. In the Data pane, select the Sales table. On the Table Tools ribbon, select New measure.

The following formula creates a measure called Revenue. This measure uses the SUM function to total the values in the Sales Amount column. If you add this measure to a table alongside the Sales Amount implicit measure, the results are the same.
Revenue =
SUM(Sales[Sales Amount])
Tip
Adding measures and hiding columns helps report authors use the explicit measures instead.
In the Measure tools contextual ribbon, you can format the measure, set data type, and change the home table. The home table refers to where the measure shows when looking at the data pane.

Tip
It's a good practice to set the formatting options right after you create a measure. This ensures your values look consistent in all report visuals.
Consider you might need a measure to calculate Profit as shown in the following code:
Profit =
SUM(Sales[Profit Amount])
In this example, the Profit Amount column is a calculated column. This approach isn’t optimal because you don’t need that column. In the next section, you see how to create a measure that calculates profit directly, which reduces model size and improves refresh times.
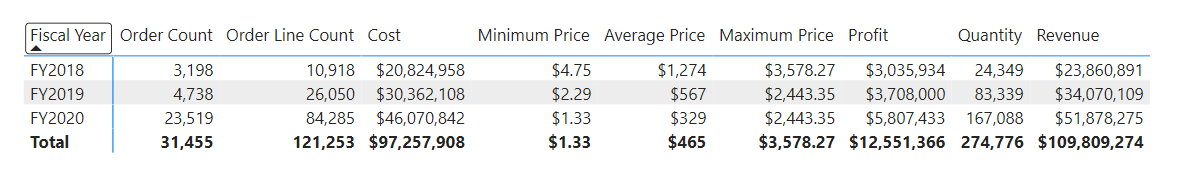
The following code creates two different measures to return Order Line Count and Order Count. The COUNT function counts non-BLANK values in a column. The DISTINCTCOUNT function counts unique values. Since an order can have multiple order lines, the Sales Order column has duplicates. Using DISTINCTCOUNT gives you the correct order count.
Order Line Count =
COUNT(Sales[SalesOrderLineKey])

Order Count =
DISTINCTCOUNT('Sales Order'[Sales Order])
You can also write the Order Line Count measure using COUNTROWS, which counts the number of rows in a table:
Order Line Count =
COUNTROWS(Sales)
All the measures referenced are considered simple measures because they aggregate a single column or single table.
Create compound measures
A compound measure references one or more other measures. For example, you can redefine the Profit measure by referencing other measures. This measure can be used instead of the calculated column previously referenced.
Profit =
[Revenue] - [Cost]
This change to the model presents an important lesson: By removing the calculated column, you optimize the semantic model because it results in a decreased semantic model size and shorter data refresh times. The Profit Amount calculated column wasn't required after all because the Profit measure can directly produce the required result by using existing measures.
Note
Sometimes, it makes sense to define measures that depend on other measures. Always test changes carefully, because updates can affect all dependent measures.
Use Quick measures
Quick measures let you perform common calculations without writing DAX yourself. Power BI generates the DAX expression for you, which helps you learn and build your DAX skills.
For example, you can use a Quick measure to create a Profit Margin measure through the following steps:
- Select Quick measure in the Table tools ribbon.
- Choose Mathematical operations > Division.
- Add the
Profitmeasure into Numerator andRevenueinto Denominator.

The new measure appears in the Data pane, and you can review its DAX formula:
Profit Margin =
DIVIDE([Profit], [Revenue])
Compare calculated columns and measures
Many DAX beginners find calculated columns and measures confusing at first. Both are created in the semantic model using DAX formulas, however, calculated columns and measures behave differently.
| Calculated columns | Measures | |
|---|---|---|
| Purpose | Adds a new column to a table | Defines how to summarize model data |
| Evaluation | Evaluated using row context at data refresh time | Evaluated using filter context at query time |
| Storage | Stores a value for each row in the table (Import mode) | Never stores values in the model |
| Use in visuals | Can filter, group, or summarize data (as implicit measures) | Designed specifically to summarize data |
| Performance impact | Can increase memory usage and model size | More efficient; better performance in large models |
| Ideal for | New fields for slicing or relationships | Dynamic calculations based on filters |
Recognizing these differences helps you choose the right approach for your modeling and reporting needs.