Understand implicit measures
Measures in Power BI models are either implicit or explicit. Implicit measures are automatic behaviors that let visuals summarize column data. Explicit measures, often called measures, are calculations you add to your model. This section explains how implicit measures work and how you can use them.
Identify implicit measures
As a data modeler, you control how a column summarizes by setting the Summarization property. You can choose Don't summarize or select a specific aggregation function. If you set a column to Don't summarize, the sigma symbol disappears in the Data pane.
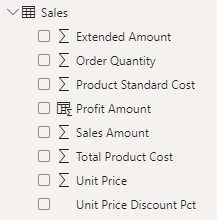
In the Data pane, a column with the sigma symbol (∑) shows two facts:
- The column is numeric.
- Values are summarized when used in a visual that supports summarization.
The following image shows the Sales table with implicit measures, a calculated column, and one column that can't be summarized.
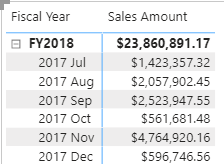
Notice in the example with the Sales table, if you add the Sales Amount field from the Sales table to a matrix visual that groups by fiscal year and month, Power BI summarizes the values implicitly. The Sum aggregation function is selected by default.
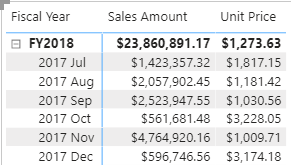
If you add the Unit Price field to the matrix visual, Power BI uses Average as the default summarization, because summing unit prices doesn’t make sense since they’re rates, not totals.
The default summarization is now set to Average (the modeler knows that it's inappropriate to sum unit price values together because they're rates, which are non-additive).
Implicit measures allow the report author to start with a default summarization technique and lets them modify it to suit their visual requirements. Numeric columns support the widest range of aggregation functions to choose from, including:
- Sum
- Average
- Minimum
- Maximum
- Count (Distinct)
- Count
- Standard deviation
- Variance
- Median
Summarize non-numeric columns
Non-numeric columns like text, dates, and boolean (true/false) values can also be summarized in your visuals. While the sigma symbol (∑) only appears next to numeric fields in the Data pane, these columns are still being aggregated.
- Text columns: First, Last, Count, Count (Distinct)
- Date columns: Earliest, Latest, Count, Count
This flexibility is useful when you want to answer questions such as:
- "How many unique products are there?" (Count distinct on a text column)
- "What was the earliest order date?" (Earliest on a date column)
- "How many orders were marked as complete?" (Count on a boolean column)
You can choose the aggregation option that best fits your analysis when you add a non-numeric field to your visual.
Considerations for implicit measures
Implicit measures are easy to use and flexible. They let report authors start with a default summarization and change it to fit their needs. Implicit measures let report authors quickly visualize data without needing to write calculations. As a data modeler, you spend less time creating explicit measures.
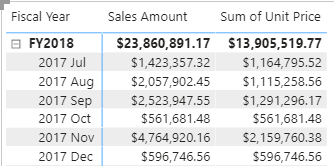
However, even if you set a default summarization, report authors can change it to something that might not make sense. For example, they could set Unit Price to Sum, which produces misleading results, as shown in the following image. The Unit Price values are large because they're the sum of unit prices instead of the static unit price per product.
The biggest limitation is that implicit measures only work for simple scenarios. They can summarize column values using a single aggregation function, but they can’t handle more complex calculations. For example, if you need to calculate the ratio of each month’s sales amount over the yearly sales amount, you must create an explicit measure with a DAX formula.


