Create calculated columns
Occasionally, you need more columns than exist in your data. Ideally, you add these columns directly to the data source, which supports easier maintenance and allows the column logic to be reused in other models or reports. However, if you need to add the column once connected to the data in Power BI, you can either create a custom column in Power Query Editor or add a calculated column to the semantic model. No matter how you add the column, the result is the same from a report user's perspective.
In general, custom columns in Power Query are preferred because they're loaded into the model in a more compact and optimal way. Calculated columns are recommended only when adding columns to a calculated table or when the formula:
- Depends on summarized model data.
- Requires specialized modeling functions available only in DAX, such as
RELATED,RELATEDTABLE, or functions for parent-child hierarchies.
Create calculated columns
A DAX formula can be used to add a calculated column to any table in the model. The formula must return a single value (scalar) for each row.
Calculated columns in import models increase storage size and can prolong data refresh times, especially when they depend on other tables that are refreshed. Therefore, be cautious when using too many calculated columns and consider if a measure can be used instead.
In the following examples, several calculated columns are created to support fiscal analysis to demonstrate the versatility of calculated columns.
Fiscal Year
This column determines the fiscal year for each date. The fiscal year starts in July, so dates from July to December are assigned to the next calendar year. The formula concatenates "FY" with the year, incrementing the year by one for dates in the second half of the year.
Due Fiscal Year =
"FY"
    & YEAR('Due Date'[Due Date])
        + IF(
            MONTH('Due Date'[Due Date]) > 6,
            1
        )
The following steps describe how Microsoft Power BI evaluates the calculated column formula:
- The addition operator (+) is evaluated before the text concatenation operator (&).
- The
YEARfunction returns the whole number value of the due date year. - The
IFfunction returns the value when the due date month number is 7-12 (July to December); otherwise, it returns BLANK. (For example, because the Adventure Works financial year is July-June, the last six months of the calendar year will use the next calendar year as their financial year.) - The year value is added to the value that is returned by the
IFfunction, which is the value one or BLANK. If the value is BLANK, it's implicitly converted to zero (0) to allow the addition to produce the fiscal year value. - The literal text value
"FY"concatenated with the fiscal year value, which is implicitly converted to text.
Fiscal Quarter
This column assigns a fiscal quarter to each date, based on the fiscal year structure where Quarter 1 is July–September. The formula appends Q and the quarter number to the fiscal year label.
Due Fiscal Quarter =
'Due Date'[Due Fiscal Year] & " Q"
    & IF(
        MONTH('Due Date'[Due Date]) <= 3,
        3,
        IF(
            MONTH('Due Date'[Due Date]) <= 6,
            4,
            IF(
                MONTH('Due Date'[Due Date]) <= 9,
                1,
                2
            )
        )
    )
Month Key
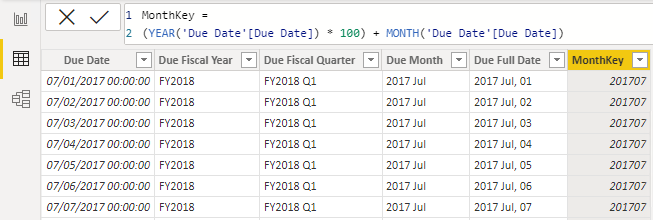
The MonthKey formula multiplies the due date year by the value 100 and then adds the month number of the due date. It produces a numeric value that can be used to sort the Due Month text values in chronological order.
MonthKey =
(YEAR('Due Date'[Due Date]) * 100) + MONTH('Due Date'[Due Date])
Full Date Label
The FORMAT function converts the Due Date column value to text by using a format string. In this case, the format string produces a label that describes the year, abbreviated month name, and day:
Due Full Date =
FORMAT('Due Date'[Due Date], "yyyy mmm, dd")
Note
Many user-defined date/time formats exist. For more information, see Custom date and time formats for the FORMAT function.
After these additions, the Due Date table contains six columns: the original date column and five calculated columns. These columns support both time intelligence functions and readability for report consumers.
Understand row context
Power BI evaluates a calculated column’s formula for each row in the table, which is called row context. Row context just means “the current row.” For example, here’s the Due Fiscal Year calculated column:
Due Fiscal Year =
"FY"
    & YEAR('Due Date'[Due Date])
        + IF(
            MONTH('Due Date'[Due Date]) <= 6,
            1
        )
When Power BI runs this formula, 'Due Date'[Due Date] gives the value from the current row. If you’ve used Excel tables, this idea might feel familiar.
Row context only applies to the current table. If you need values from another table, you have two main options:
- If a relationship exists between the two tables, use the
RELATEDorRELATEDTABLEfunction.RELATEDgets a value from the one-side of a relationship.RELATEDTABLEgets a table of values from the many-side. - If there's no relationship, use the
LOOKUPVALUEfunction.
Try to use RELATED when you can. It usually works faster than LOOKUPVALUE because of how Power BI stores and indexes data.
Here’s an example. This formula adds a Discount Amount column to the Sales table:
Discount Amount =
(
    Sales[Order Quantity]
        * RELATED('Product'[List Price])
) - Sales[Sales Amount]
Power BI calculates this formula for each row in the Sales table. It gets Order Quantity and Sales Amount from the current row. To get List Price from the Product table, it uses the RELATED function to find the right value for each sale.
Row context always applies when Power BI evaluates calculated column formulas. It also comes into play with iterator functions, which let you create more advanced summaries. You learn about iterator functions later in this module.
