Configure measures
While report authors can summarize any column in Power BI visuals, they can't achieve complex summarization requirements, like a year-to-date (YTD) calculation. In this case, you need to create a measure.
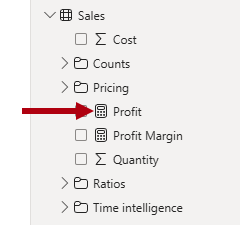
A measure is a named DAX formula that's added to a model table. It achieves summarization, and it appears in the Data pane with a calculator icon. Measure names must be unique within the model. Measures can be simple, such as SUM or AVERAGE. Measures can also be complex and calculate the Sales Amount minus Product Cost to find the Profit.
These calculations extend the data in your semantic model by providing the essential calculations required for effective data visualization, enabling you to uncover deeper insights and trends within your data.
Note
If the model is queried by using Multi-Dimensional Expressions (MDX), which is the case when you use Analyze in Excel, then you must also create measures.
If you don't have DAX skills, you can use Copilot for Power BI to generate a measure based on a prompt. You can also use the Quick measures feature.
Use Quick measures
Quick measures allow you to create a measure by selecting a calculation template and dragging fields to configure it. Power BI Desktop then creates a measure based on your configuration.

Like model columns, you can set description, synonym, display folder, and "is hidden" properties for measures. You can also set formatting properties. The Home table property allows assigning the measure to any model table.
Tip
You can also use Copilot to autogenerate a description value for the measure, which it does by inspecting the DAX formula. For more information, see the Copilot for Power BI documentation.