Configure hierarchies
Hierarchies are optional. By creating them, you provide clues to report authors about relationships between columns in a table. If you don't create the hierarchy, report authors can still achieve the same result by adding multiple columns to a visual, but it involves more knowledge and effort.
You can add one or more hierarchies to any model table. The hierarchy levels must be based on columns from that table, and they provide a navigation path across those columns.
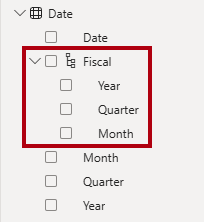
For example, you can add a hierarchy named Fiscal to the Date table with levels based on the Year, Quarter, and Month columns.
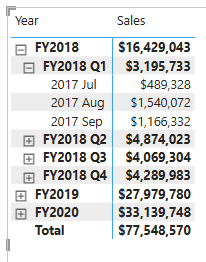
The following screenshot shows a matrix visual that has the Fiscal hierarchy on its rows.
Like model columns, you can set description, synonym, display folder, and "is hidden" properties for hierarchies.

