Configure columns
There are many column properties that you can set. Like with tables, you can set the name, description, synonyms, and "is hidden" properties. It's common to hide columns that are used by relationships, especially when they're based on aren't meaningful key values.
Column names must be unique within the model table, and if the column is visible, you should set a user-friendly name. If you change the column name in Power BI Desktop, a new step is appended to the Power Query query to modify the column name there.
You can assign columns to a display folder, which helps organize the fields for a table. Consider using display folders when your table comprises many visible fields.
Configure column formatting
Every column has a Data type property, which is inherited from the Power Query query. It's concerned with how values are stored. If you change the data type in Power BI Desktop, a new step is appended to the query to modify the data type there.
Related, though different, is the Format property. This property is concerned with how the values are presented in visuals. For example, a column with a fixed decimal number data type might be formatted as a currency.
Set sort order
Sometimes, the natural order of the column values doesn't meet your requirements. Text values naturally sort alphabetically, while numbers and dates naturally sort from smallest (or earlier) to largest (or later). When you need the values to sort differently, you can refer to a column in the same table that contains values suited to sorting the column.
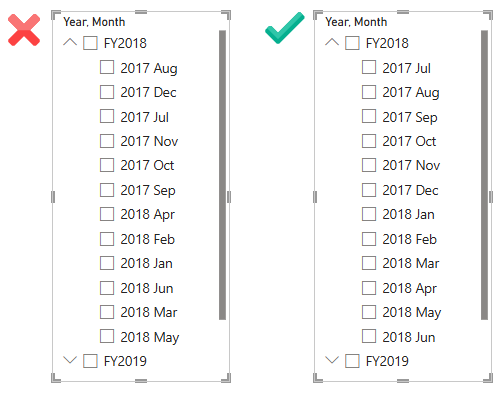
For example, in the Date table, the Month column contains the English name of the months, like 2017 Aug (for August 2017). The natural sort order results in months listed alphabetically, not chronologically (in which case August is ordered before all other months). In this case, you can add the MonthKey column to the table, which stores a numeric value comprising the year and month number.
You can then set the Sort by Column property of the Month column to use the MonthKey column. You should then hide the MonthKey column because it shouldn't be used directly by report authors.
Categorize data
You can set the Data category property to describe the content of a column.
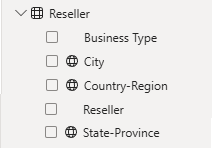
Setting this property is especially useful when a column stores a spatial value, either in text or as a decimal latitude or longitude value. Columns that are categorized with a spatial value appear in the Data pane with a spatial icon, and Power BI can more accurately geocode and visualize the data when used in map visuals.
You can also categorize columns that contain a URL.
When the URL contains a general web link, set the Data category property to Web URL. When used in a table or matrix visual, the report author can configure the format options to condense the URL into a compact and easily recognizable link icon.
When the URL contains a link to an image, set the property to Image URL. When used in a table, matrix, slicer, or multi-row card visual, the report author can configure the format options to display the images.
Set summarization
You can set the Summarize by property for numeric columns to determine how they summarize (or not) by default. Options include Sum, Min, Max, Average, Count, and Discount Count (or None).
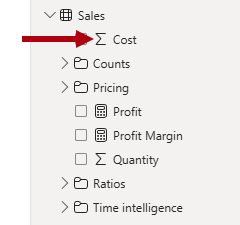
Summarizable columns appear in the Data pane with a sigma symbol (Ʃ), and report authors can determine how they're summarized when used by a visual.
Tip
When you want to control how report authors (or Q&A) summarize a numeric column, create a measure (described in a later unit) and hide the column.


