Note
Access to this page requires authorization. You can try signing in or changing directories.
Access to this page requires authorization. You can try changing directories.
The data governance health report allows your team to track your health progress at a glance, and identify areas that need more work. This article covers how you can access this report and what the provided information means for your data governance health.
Note
If you don't use data health controls, the data governance health report won't be refreshed. Ensure that you set up the schedule to run data health controls for refreshing the health controls scores and the data governance health report.
Prerequisites
- You need data health reader permissions to be able to view Data Estate Health information.
View data governance health report
- Open the Microsoft Purview portal and select Unified Catalog.
- Select the Health Management dropdown.
- Select Reports
- Select the Data governance report.
Here you have the main data governance report on the Overview tab. The report covers the overall health of your governance domains, and provides details about your data products.

Use the filters to see information for specific governance domains, data products, or data products in a certain status (for example: draft).
Overview
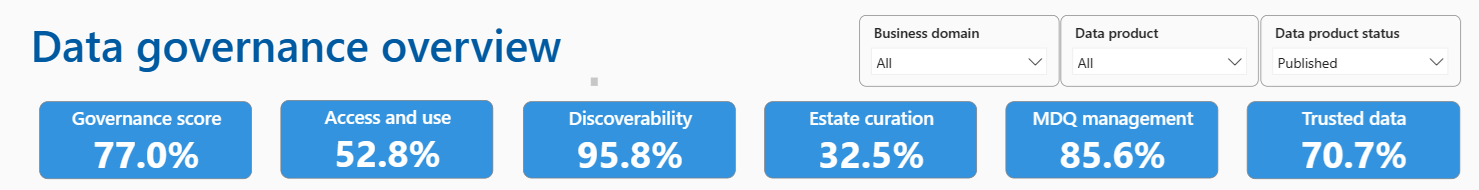
The main overview covers the controls for your governance domains.
Controls and actions
The top controls and actions help you understand your overall governance health at a glance, and cover both controls and actions.
| Control or action | Description | Example |
|---|---|---|
| Governance score | Average of the ownership, cataloging, and classification controls. | |
| Access and use | Average of the self-service access enablement and compliant data use controls. | (Self-serv score is 100 + Compliaant score is 5.6) / 2 = 52.8% is the Access and use score control group score. |
| Discoverability | Average of these two checks: number of governance domains with Unified Catalogs and the number data products that have data assets mapped. | |
| Estate curation | Percentage of data assets that have classifications applied. | Estate curation score is 32.5% because only 32.5% of data assets have been classified during scan. |
| MDQ management | Average of data product useability (products with long descriptions and attached glossary terms), and percentage of data products with linked assets. | (MDQ data product usability is 87.9 + MDQ Linked asset is 83.3) /2 = 85.6% is the MDQ management score. |
| Trusted data | Average of three controls: Percentage of data products with owners, percentage of data products that have data quality scoring enabled, percentage of data products that have been certified. | (% of data products with owner is 97.6 + % data product with data quality score is 68.4 + % of data product certified is 46.2) = 70.7% is the Trusted data score. |
Tip
If you use the filters, these KPIs reflect scores for the governance domains or data products selected.
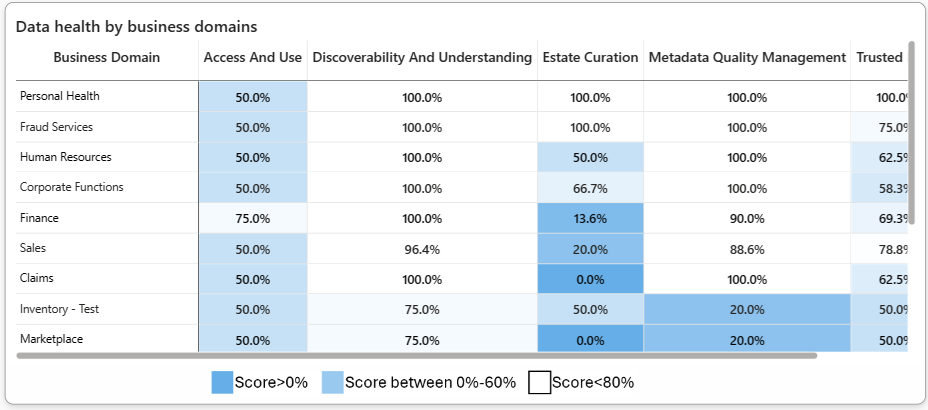
Data health by governance domain
The data health by governance domain chart gives you individual control scores for your governance domains without needing to use the filters. At a glance, you can see which of your governance domains are healthy and which need more attention.
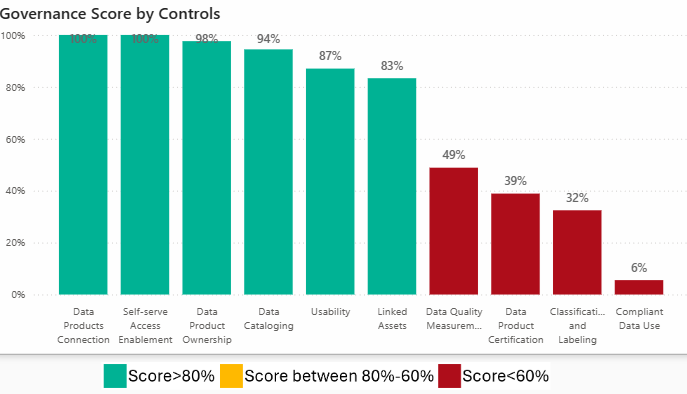
Governance score by controls
This column chart highlights your governance strengths and weaknesses by showing overall score for each control in Unified Catalog. Prioritize low or flagging scores to increase your data governance coverage across your data estate.
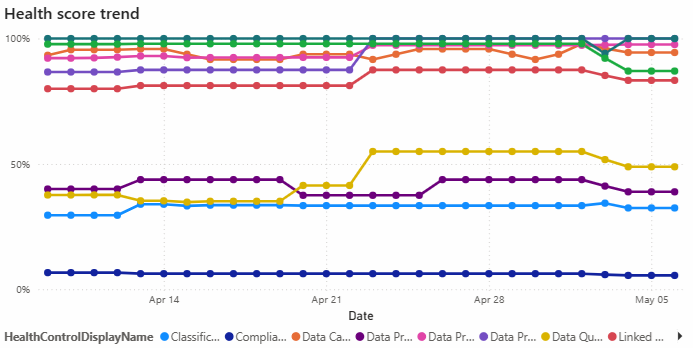
Health score trend
This table visualizes your daily health progression for all of the main health controls.
Use this table to track how well your team is managing your data estate over time to track your progress to healthy data governance.
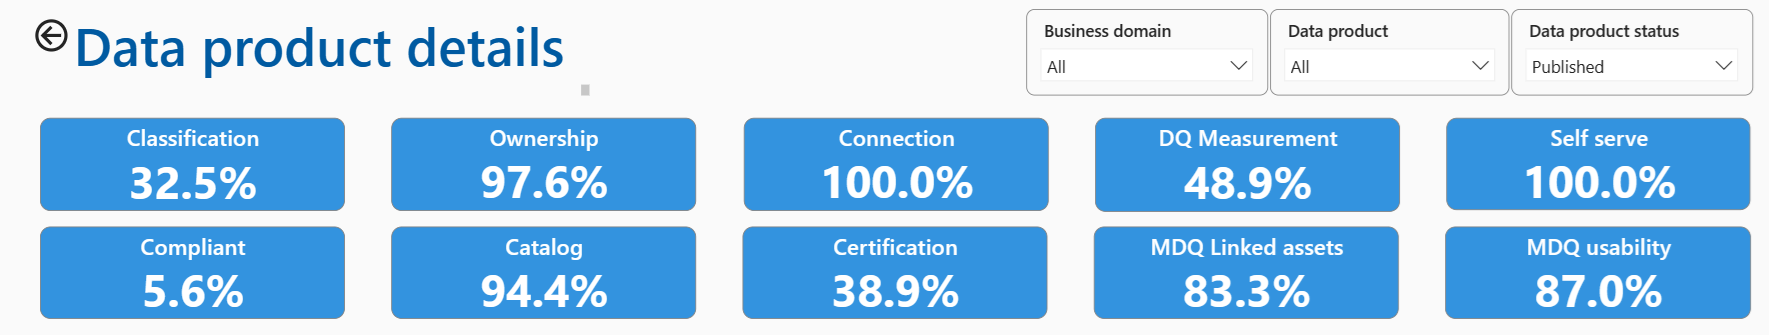
Data product details
Select the Data product details tab at the bottom of the page to see action and control information for your data products.

Data product controls and actions
The top controls and actions help you understand your overall governance health at a glance, and cover both controls and actions.
| Control or action | Description | Example in the image above |
|---|---|---|
| Classification | Percentage of data products that have classified assets attached. | 32.5% of data assets are classified by Data Map scans. |
| Ownership | Percentage of data products that have an active owner. | 97.6% of data products have at least one owner. |
| Connection | Percentage of data products that have at least one asset attached. | 100% of data products have at least one data asset attached. |
| DQ measurement | Aggregation of data quality scores across the data products. | 48.9% of data assets have a data quality score. |
| Self serve | Percentage of data products with self-service access setup. | 100% of data products have a self-serve access policy attached. |
| Compliant | Percentage of data products with the purpose of use policy added. | 5.6% of data products have a compliant policy attached. |
| Catalog | Percentage of data products with a description, published glossary terms, and a use case. | 94.4% of data products have descriptions, use cases, and at least one glossary term associated. |
| Certification | Percentage of data products that have been verified. | 38.9% of data products are verified. |
| MDQ linked assets | Percentage of data products with at least one asset and at least one published glossary term. | 83.3% of data products have at least one data asset and one glossary term linked. |
| MDQ usability | Percentage of data products that have a description over 100 characters long, the parent domain has a description 100 characters long, and the associated term has a description 100 characters long. | 87% of data products have descriptions and use cases that are at least 100 characters long. |
You can use the filters to narrow your view to only certain governance domains, data products, or data products with a certain status.
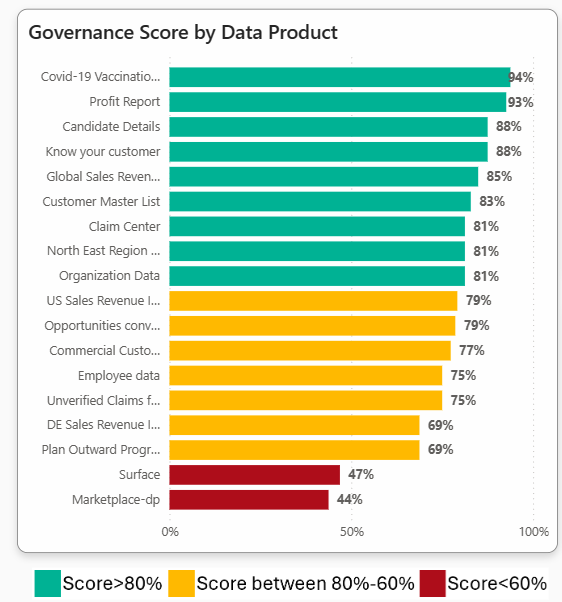
Governance score by data product
This bar chart highlights your strongest and weakest data products by showing the overall governance score for each data product. Prioritize low-scoring but high-use data products to bring the most value to Unified Catalog.
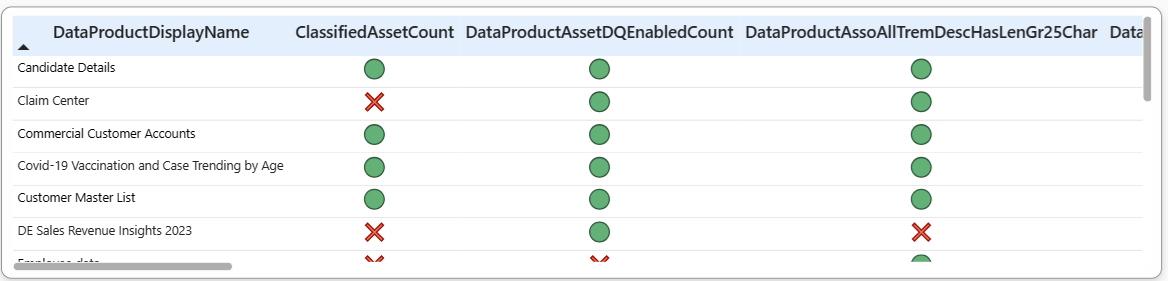
Individual control checks
This table shows the pass/fail status for each individual control check available to your data product. You can check controls for low-scoring data products to see which areas will need improvement.
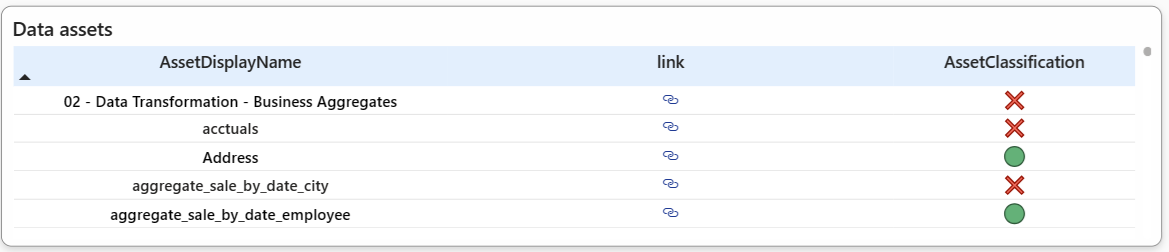
Data assets
This table shows the pass/fail status for individual assets in Unified Catalog. If a single asset is referenced by multiple data products, resolving any outstanding governance issues for that asset will raise your score overall.
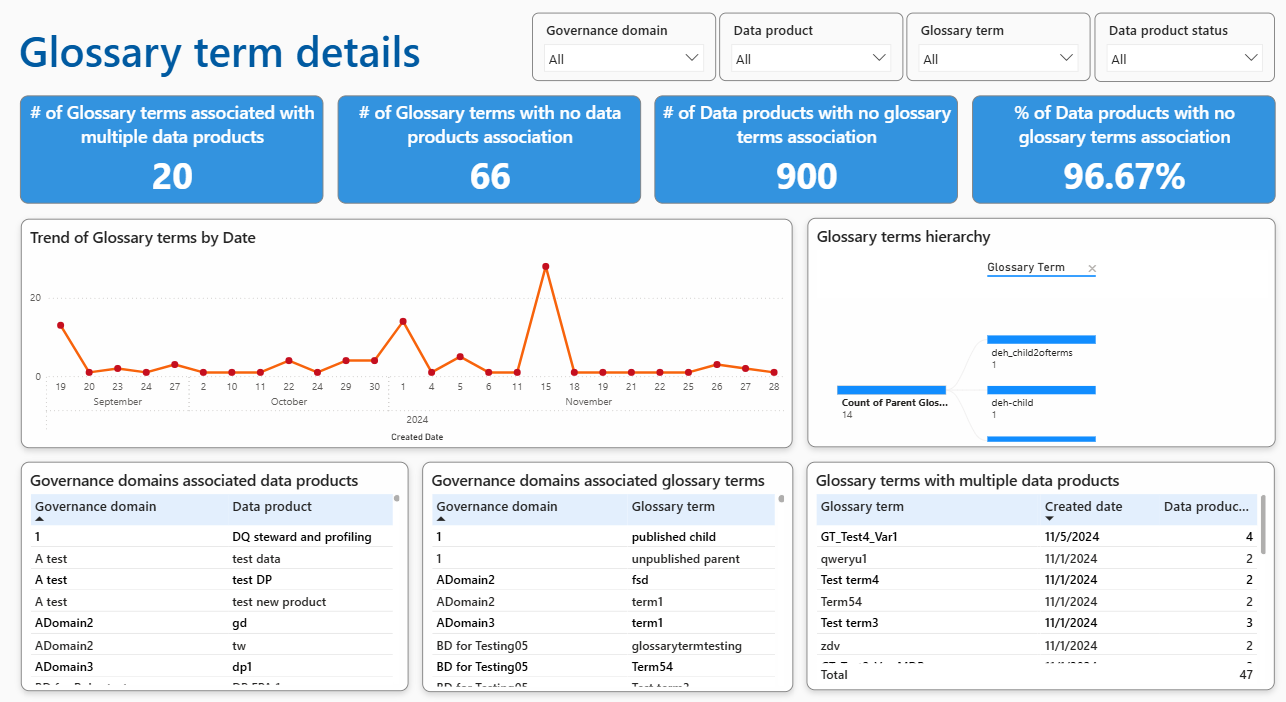
Glossary terms report (preview)
Glossary terms provide vocabulary for business users. These terms allow users to discover and work with data in the vocabulary that is familiar to them versus using abstract technical terminology inherited from physical data sources. Terms are created under governance domains to create context specific to each part of your organization. Both sales and marketing might use the same term to mean different things, and your governance domains help your team to differentiate between those meanings. Once created, terms map to data products, to provide context for those data products, and to provide specific data governance based on business context. Terms are an active part of Microsoft Purview that provide data governance by now containing policies. The glossary terms report (preview) helps data stewards to browse:
- Glossary terms trends.
- Glossary terms hierarchy.
- Data product associated with glossary terms.
- Governance domain association with glossary terms.