Note
Access to this page requires authorization. You can try signing in or changing directories.
Access to this page requires authorization. You can try changing directories.
Distributed tracing is a method used to profile and monitor applications, especially applications built using a microservices architecture. It allows you to trace an event in the system from one service to another and retrieve end-to-end diagnostics about performance and latency. The W3C Trace Context recommendation defines how context information is sent and modified among services in distributed tracing scenarios. This article provides practical applications and use cases for distributed tracing and explains how to implement it across multiple services in Power Platform.
Trace identifiers
In the W3C Trace Context standard, each trace is assigned a globally unique 16-byte trace-id. Every activity within the trace is assigned a unique 8-byte span-id. trace-id represents the overall transaction, and span-id represents individual operations within that transaction. Each activity records the trace-id, its own span-id, and the span-id of its parent, establishing parent-child relationships between activities.
In the W3C standard, traceparent is a header used to track requests as they move through different services or systems. It contains a unique trace-id, a parent-id that represents the immediate caller, and trace-flags for sampling decisions.
Example scenario
Let's consider an example in which a browser starts a transaction, multiple microservices interact, and a call is made to the Dataverse Web API:
| Source | trace-id and span-id |
|---|---|
| Browser | trace-parent: 00-11111111111111111111111111111111-2222222222222222-01 |
| Kubernetes | trace-parent: 00-11111111111111111111111111111111-3333333333333333-01 |
| Dataverse | trace-parent: 00-11111111111111111111111111111111-4444444444444444-01 |
Browser initiates transaction: The browser sends a request to a web server. The request is assigned a
trace-idand aspan-id, span-id-1.Microservices interaction: The web server processes the request and makes a call to a microservice. The call is assigned a new
span-id(span-id-2) and retains the sametrace-id. The microservice calls another microservice, creating anotherspan-id(span-id-3), and so on. In each case,trace-idremains the same, but a newspan-idis generated for each operation.Call to Dataverse Web API: One of the microservices makes a call to the Dataverse Web API. Again, the call is assigned a new
span-id(span-id-4) and retains the sametrace-id.
trace-id and parent-child relationships
trace-id joins all transactions with a parent-child relationship. Each span-id represents a unique operation within the trace, and the parent span-id links it to its parent operation. This hierarchical structure lets you trace the entire transaction from the initial request to the final response, even as it traverses multiple services and systems.
trace-id and Operation Id mapping
Application Insights maps the W3C trace-id field to Operation Id, allowing you to easily query a set of related actions that occur as part of the end-to-end trace.

Practical applications and benefits
The W3C Trace Context standard for distributed tracing offers several practical applications and benefits:
End-to-end visibility: Trace context provides end-to-end visibility into a transaction, helping you understand how requests propagate through your system.
Performance monitoring: It lets you monitor the performance of individual services and identify bottlenecks.
Error diagnosis: It helps you diagnose errors by tracing the path of a request and identifying where failures occur.
Dependency tracking: It allows you to track dependencies between services and understand how they interact.
By implementing distributed tracing with the W3C Trace Context standard, you can gain valuable insights into your application's behavior, improve its performance, and enhance the overall user experience.
Potential use cases
The following table describes potential use cases for distributed tracing in Power Platform. Each use case illustrates how distributed tracing can be applied to different scenarios, enabling you to monitor and diagnose performance issues across multiple services.
| Example | Description | Notes |
|---|---|---|
| Autonomous agent | A data event triggers an autonomous agent. The possible long-lived transaction persists the trace parent. The transaction could cross multiple processes and services, including possible hand-off to a customer service agent. | Power Automate can request distributed tracing from the Dataverse plug-in. Each step of the process adds Application Insights telemetry. You can query the end-to-end transaction in Application Insights or by using KQL queries. |
| End user web, mobile, or agent transaction | A user starts a transaction to update customer data. Trace entries are added to Application Insights from the request and trace messages from Dataverse. | The Kubernetes service starts a distributed transaction. It calls the Dataverse Web API to update customer details. |
| Customer support agent | A customer contacts the call center. A call center operator uses Copilot in Dynamics 365 Customer Service and a model-driven app to update the customer's details. Each component in the update writes to Application Insights. | The transaction starts with the call center operator. The model-driven app requests a distributed transaction from Dataverse. |
Dataverse Web API integration
Let's explore how the Dataverse Web API can be integrated with W3C Trace Context for distributed tracing.
The calling service initiates a trace with a unique trace-id and span-id. The trace-parent value can be passed to the Web API either in the body of an HTTP POST request or as part of an HTTP query string; for example:
- Option 1: POST body:
postData(environmentUrl + "api/data/v9.0/" + customApiName, token, ...) - Option 2: Tag query string:
postData(environmentUrl + "api/data/v9.0/" + customApiName + "?tag=01-0af...")
Using either method, you can configure a Dataverse plug-in to incorporate Application Insights tracing, generating new span-ids and trace messages.
Dataverse integration
Now let's explore how to implement this pattern using the generally available features of Dataverse.
To apply distributed tracing to calls to the Dataverse Web API:
- Use Dataverse messages to extend the message pipeline.
- Create a custom API with Dataverse plug-ins that use the Application Insights SDK to add the required parent-child relationships.
Invoke from other Power Platform services
Let's say that you want to allow other Power Platform services, like Copilot Studio, Power Apps, or Power Automate cloud flows, to be included in the overall distributed tracing solution. Consider invoking a function from an app, flow, code, or another function to call the Dataverse custom APIs, as discussed in this section.
Dataverse messages for entities or custom APIs
You can define custom Dataverse messages that allow you to interact with entities or custom APIs in the Dataverse environment. Dataverse messages allow you to streamline your data management processes and ensure seamless integration with your observability needs. Learn more in Create your own messages.
Add steps to a plug-in
After you create a Dataverse message type or use a predefined entity type in an environment, use a plug-in to configure execution at different stages of the data processing pipeline and allow distributed tracing. Learn more in Use plug-ins to extend business processes.
The pipeline stages can include prevalidation, preoperation, and post-operation steps. By adding steps to a plug-in, you control the flow of data and ensure that actions are taken at the right time.
Pre-validation: Occurs before the main operation is executed. It validates the data and ensures that it meets the required criteria.
Pre-operation: Occurs after the prevalidation step but before the main operation is executed. It performs any necessary preparations or modifications to the data.
Post-operation: Occurs after the main operation is executed. It performs any necessary cleanup or other actions based on the results of the main operation.
You can configure the plug-ins to execute these steps either synchronously or asynchronously, depending on your application's requirements.
Unsecure and secure configuration values
You can use the Unsecure Configuration and Secure Configuration fields in the Plug-in Registration tool to control aspects of the plug-in's behavior.
Unsecure Configuration: Unsecure settings are visible to all users and can include settings such as log level, enable/disable tracing, and other nonsensitive information.
Secure Configuration: Secure settings are only visible to users with the appropriate permissions and can include sensitive information such as connection strings, API keys, and other confidential data.
For distributed tracing scenarios, use the Unsecure Configuration field to manage whether tracing is turned on and to set the logging level. Use the Secure Configuration field to store connection string information required by the plug-in.

Learn more in Register a plug-in.
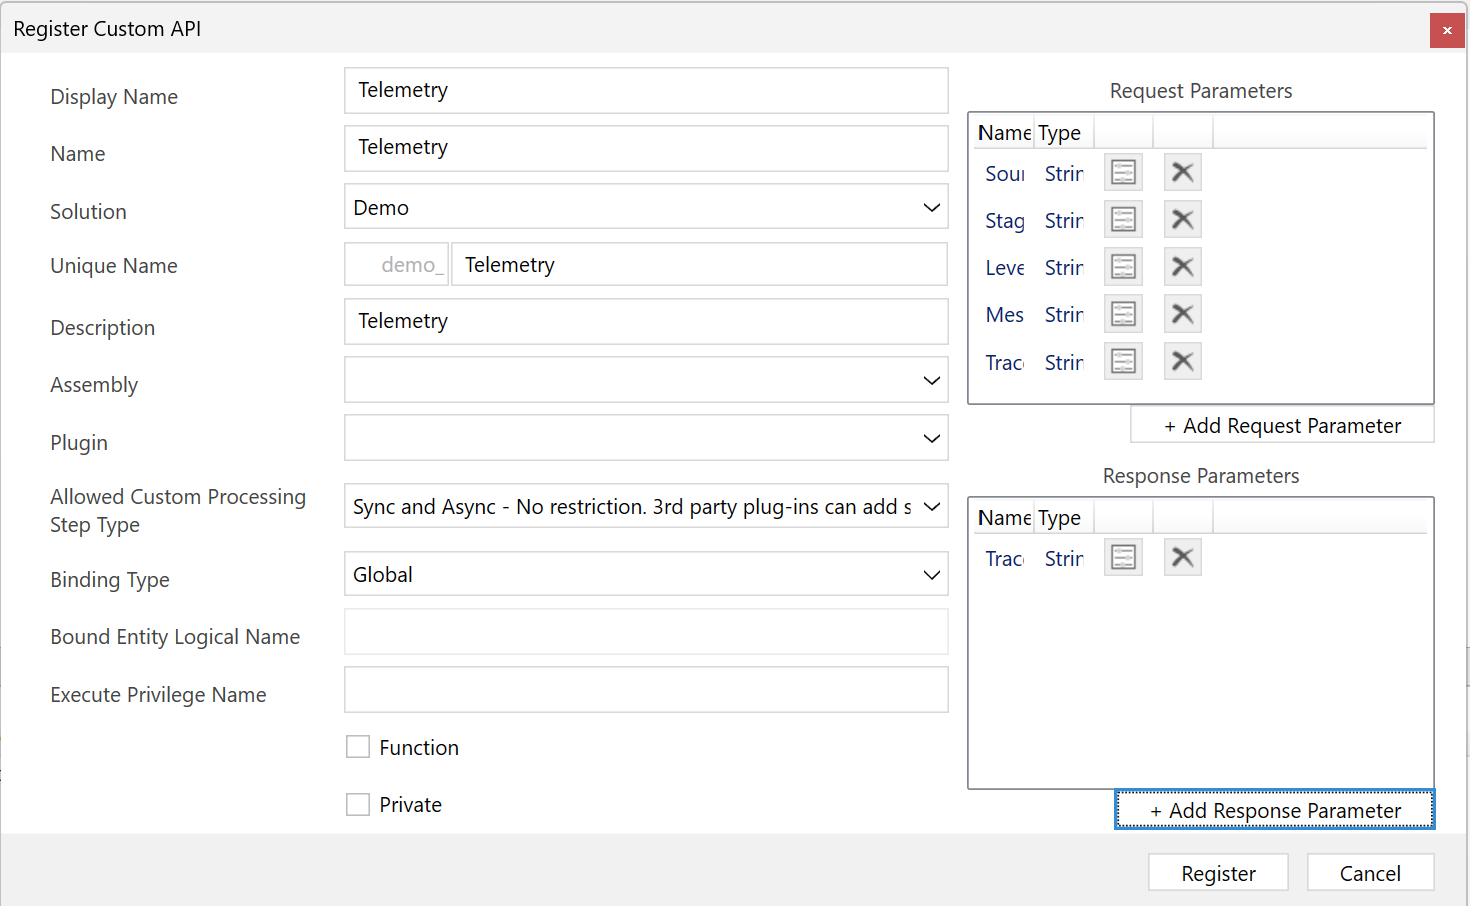
Custom API with request and response parameters
Dataverse allows you to create and use custom APIs with specific request and response parameters to meet your application's needs.
InputParameters: Define the input data required by the custom API. They can include various data types such as strings, integers, and complex objects.OutputParameters: Define the output data returned by the custom API. They can include various data types and structures, allowing you to provide detailed and meaningful responses to API consumers.
Tip
For distributed tracing, you can tag the query string value for passing a Shared Variable from the API.
Custom processing steps (sync and async)
When using custom processing steps, you can define whether the steps should be executed synchronously or asynchronously. This flexibility allows you to optimize the performance and responsiveness of your application.
- Synchronous processing: The steps are executed sequentially. The next step doesn't start until the current step is completed. This approach ensures that each step is completed before moving on to the next one.
- Asynchronous processing: The steps are executed independently. The next step can start before the current step is completed. This approach allows for parallel processing and can improve the overall performance of your application.
By defining custom processing steps, you can add monitoring and other functionalities to existing entities or custom API messages, ensuring that your application operates efficiently and effectively.
Dataverse C# plug-ins
Build and deploy Dataverse C# plug-ins that use the Application Insights SDK to create the correct parent-child relationship between services. Learn more in Write a plug-in.
Comparison of custom plug-in and out-of-the-box ILogger
Dataverse provides an out-of-the-box ILogger that can be configured at the environment level. The built-in ILogger is designed to offer a standardized logging mechanism across different environments, ensuring consistency and ease of use. However, it might not provide the same level of granularity and customization as the custom plug-in ILogger.
The custom plug-in ILogger in Dataverse offers more detailed levels of information, such as Trace, Debug, and Information. It allows developers to capture more specific and relevant data during the execution of plug-ins. ILogger uses values from the message request or the Share Variable tag parameter to specify the calling trace parent for better tracking and correlation of logs.
Learn more in Write telemetry to your Application Insights resource using ILogger.
Key C# concepts for parsing activity and specifying parent ID
When you use the custom plug-in ILogger, it's essential to understand key C# concepts for parsing activity and specifying the parent ID. Here's an example of how to create a new activity for a trace message:
// Create a new activity for the trace message
var activity = new Activity("CustomActivity");
activity.SetParentId(traceParent);
activity.Start();
// Create a trace telemetry record
var traceTelemetry = new TraceTelemetry(message, ConvertLogLevel(level))
{
    Message = message,
    Context = { Operation = { ParentId = dependencyTelemetry.Id, Id = activity.Id } }
};
// Track the trace telemetry
telemetryClient.TrackTrace(traceTelemetry);
Tip
The Dataverse OpenTelemetry sample project contains an example of a Dataverse plug-in integration with OpenTelemetry. OpenTelemetry is a collection of W3C standards, APIs, SDKs, and tools that you can use to instrument, generate, collect, and export telemetry data.
Contributors
Microsoft maintains this article. The following contributors wrote this article.
Principal authors:
- Grant Archibald, Senior Program Manager