Note
Access to this page requires authorization. You can try signing in or changing directories.
Access to this page requires authorization. You can try changing directories.
Monitor and troubleshoot your automation activities to ensure seamless operation. This article provides advice on maintaining and optimizing your automation processes to keep them reliable and efficient.
Capture desktop flow run action logs
To monitor and troubleshoot your desktop flow runs, capture action logs. Action logs provide detailed information about the execution of each action in your desktop flow, including input and output values, errors, and warnings.
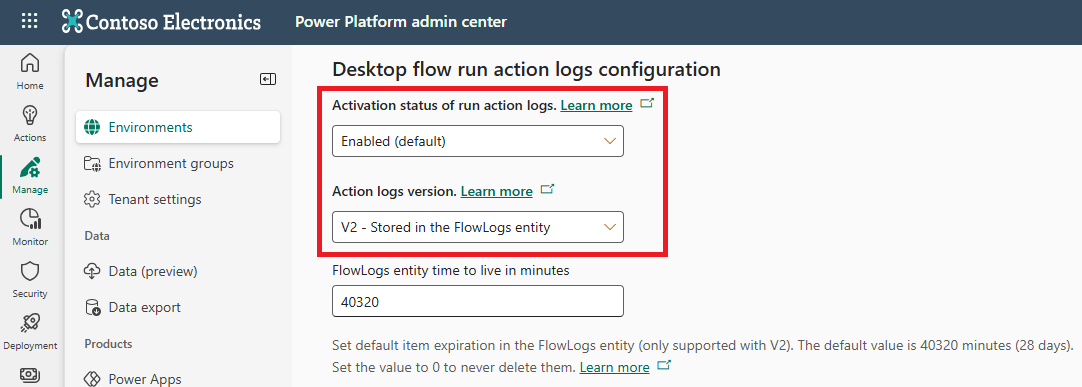
Configure the desktop flow action log version to V2. Logs V2 uses Elastic Tables, provides automatic data retention, and can scale up to gigabytes of action logs per run. Learn more about Desktop flow action logs configuration.
Logs V2 also provides near real-time updates of actions as your desktop flow runs. Learn more about progressive action logging.
Use the Log message action to log custom text messages with a severity level of Info, Warning, or Error in the flow run action details.
Use the Display message action to show messages on the user's screen that are also logged in the flow run details. These messages are useful for interacting with attended flow runs and debugging.
Use your own custom logging mechanism. For example, use the Microsoft Dataverse, SharePoint, or File actions to log custom messages to a cloud or local location.
Use log messages to track flow progress and record important details such as input values, output values, intermediate results, or error messages.
Use the Get last error action to capture and log the last error in the flow.

Use Automation center reports
There are two types of reports: environment-level reports and tenant-level reports.
Environment level reports
The Automation center in the Power Automate portal is a centralized hub to monitor and manage automation activity within an environment. It shows all automation-related data, including a process map, recommendations, execution logs, performance metrics, and an integrated copilot.
Other out-of-the-box reports include:
- Cloud flow activity: View a summary of daily cloud flow activity.
- Desktop flow activity: Monitor and manage your desktop automations and machines.
- Desktop flow runs: Troubleshoot issues using an overview of your desktop automations.
- Capacity utilization: Get an overview of capacity utilization and recommendations to manage automations and desktop infrastructure efficiently.
Tenant level reports
The Monitor page in the Power Platform admin center provides detailed analytics to help you understand the health of your enterprise automations and offers proactive recommendations to improve the health and efficiency of your flows across environments. The Monitor page also highlights resources with degraded operational health that might need improvement.

Build your own reports using Microsoft Fabric
For more advanced or custom monitoring, reporting, and analysis, integrate with Microsoft Fabric. The Link to Microsoft Fabric feature in Power Platform lets you access all your Power Automate data in Microsoft OneLake, the built-in data lake for Microsoft Fabric.

Learn how to generate automation-centric data analytics with Fabric and create automation-related SQL queries on the SQL Analytical Endpoint in Fabric.