Note
Access to this page requires authorization. You can try signing in or changing directories.
Access to this page requires authorization. You can try changing directories.
This article provides code samples that show how to create tables and control formatting by using the PowerPoint JavaScript API.
Create an empty table
To create an empty table, call the ShapeCollection.addTable() method and specify how many rows and columns the table needs. The following code sample shows how to create a table with 3 rows and 4 columns.
await PowerPoint.run(async (context) => {
    const shapes = context.presentation.getSelectedSlides().getItemAt(0).shapes;

    // Add a table (which is a type of Shape).
    const shape = shapes.addTable(3, 4);
    await context.sync();
});
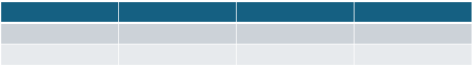
The previous sample doesn't specify any options, so the table defaults to formatting provided by PowerPoint. The following image shows an example of an empty table created with default formatting in PowerPoint.
Specify values
You can populate the table with string values when you create it. To do this provide a 2-dimensional array of values in the TableAddOptions object. The following code sample creates a table with string values from "1" to "12". Note the following:
- An empty cell must be specified as an empty string "". If a value is undefined or missing,
addTablethrows an error. - The outer array contains a list of rows. Each row is an inner array containing a list of string cell values.
- The function named
insertTableOnCurrentSlideis used in other samples in this article.
async function run() {
    const options: PowerPoint.TableAddOptions = {
        values: [
            ["1", "2", "", "4"], // Cell 3 is blank.
            ["5", "6", "7", "8"],
            ["9", "10", "11", "12"]
        ],
    };

    await insertTableOnCurrentSlide(3, 4, options);
}

async function insertTableOnCurrentSlide(rowCount: number, columnCount: number, options: PowerPoint.TableAddOptions) {
    await PowerPoint.run(async (context) => {
        const shapes = context.presentation.getSelectedSlides().getItemAt(0).shapes;

        // Add a table (which is a type of Shape).
        const shape = shapes.addTable(rowCount, columnCount, options);
        await context.sync();
    });
}
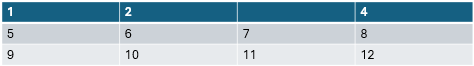
The previous sample creates a table with values as shown in the following image.
Specify cell formatting
You can specify cell formatting when you create a table, including border style, fill style, font style, horizontal alignment, indent level, and vertical alignment. These formats are specified by the TableCellProperties object.
Uniform cell formatting
Uniform cell formatting applies to the entire table. For example, if you set the uniform font color to white, all table cells will use the white font. Uniform cell formatting is useful for controlling the default formatting you want on the entire table.
Specify uniform cell formatting for the entire table using the TableAddOptions.uniformCellProperties property. The following code sample shows how to set all table cells to dark slate blue fill color and bold white font.
const rowCount = 3;
const columnCount = 4;
const options: PowerPoint.TableAddOptions = {
    values: [
        ["1", "2", "", "4"],
        ["5", "6", "7", "8"],
        ["9", "10", "11", "12"]
    ],
    uniformCellProperties: {
        fill: { color: "darkslateblue" },
        font: { bold: true, color: "white" }
    }
};
await insertTableOnCurrentSlide(rowCount, columnCount, options);
The previous sample creates a table as shown in the following image.

Specific cell formatting
Specific cell formatting applies to individual cells and overrides the uniform cell formatting, if any. Set individual cell formatting by using the TableAddOptions.specificCellProperties property. The following code sample shows how to set the fill color to black for the cell at row 1, column 1.
Note the specificCellProperties must be a 2D array that matches the 2D size of the table exactly. The sample first creates the entire empty 2D array of objects. Then it sets the specific cell format at row 1, column 1, after the options object is created.
const rowCount = 3;
const columnCount = 4;
// Compact syntax to create a 2D array filled with empty and distinct objects.
const specificCellProperties = Array(rowCount).fill("").map(_ => Array(columnCount).fill("").map(_ => ({})));
const options: PowerPoint.TableAddOptions = {
    values: [
        ["1", "2", "", "4"],
        ["5", "6", "7", "8"],
        ["9", "10", "11", "12"]
    ],
    uniformCellProperties: {
        fill: { color: "darkslateblue" },
        font: { bold: true, color: "white" }
    },
    specificCellProperties // Array values are empty objects at this point.
};
// Set fill color for specific cell at row 1, column 1.
options.specificCellProperties[1][1] = {
    fill: { color: "black" }
};
await insertTableOnCurrentSlide(rowCount, columnCount, options);
The previous sample creates a table with a specific format applied to the cell in row 1, column 1 as shown in the following image.

The previous sample uses the font property which is of type FontProperties. The font property allows you to specify many properties, such as bold, italic, name, color, and more. The following code sample shows how to specify multiple properties for a font for a cell.
options.specificCellProperties[1][1] = {
    font: {
        color: "orange",
        name: "Arial",
        size: 50,
        allCaps: true,
        italic: true
    }
};
You can also specify a fill property which is of type FillProperties. The fill property can specify a color and the transparency percentage. The following code sample shows how to create a fill for all table cells using the color "dark red" and a 50% transparency.
uniformCellProperties: {
    fill: {
        color: "darkred",
        transparency: 0.5
    }
}
Borders
Use the TableCellProperties.borders object to define borders for cells in the table. The following code sample shows how to set the borders of a cell in row 1 by column 1 to a red border with weight 3.
const columnCount = 3;
const rowCount = 3;
// Compact syntax to create a 2D array filled with empty and distinct objects.
const specificCellProperties = Array(rowCount).fill(undefined).map(_ => Array(columnCount).fill(undefined).map(_ => ({})));
const options: PowerPoint.TableAddOptions = {
    values: [
        ["1", "2", "3"],
        ["4", "5", "6"],
        ["7", "8", "9"]
    ],
    uniformCellProperties: {
        fill: {
            color: "lightcyan",
            transparency: 0.5
        },
    },
    specificCellProperties
};
options.specificCellProperties[1][1] = {
    font: {
        color: "red",
        name: "Arial",
        size: 50,
        allCaps: true,
        italic: true
    },
    borders: {
        bottom: {
            color: "red",
            weight: 3
        },
        left: {
            color: "red",
            weight: 3
        },
        right: {
            color: "red",
            weight: 3
        },
        top: {
            color: "red",
            weight: 3
        }
    }
};
await insertTableOnCurrentSlide(rowCount, columnCount, options);
Horizontal and vertical alignment
Use the TableCellProperties.horizontalAlignment property to control text alignment in a cell. The following example shows how to set horizontal alignment to left, right, and center for three cells in a table. For a list of all alignment options, see the ParagraphHorizontalAlignment enum.
const rowCount = 3;
const columnCount = 3;
// Compact syntax to create a 2D array filled with empty and distinct objects.
const specificCellProperties = Array(rowCount).fill("").map(_ => Array(columnCount).fill("").map(_ => ({})));
const options: PowerPoint.TableAddOptions = {
    values: [
        ["Left aligned, top", "\n\n", ""],
        ["Centered", "\n\n", ""],
        ["Right aligned, bottom", "\n\n", ""]
    ],
    uniformCellProperties: {
        fill: { color: "lightblue" },
        borders: {
            bottom: {
                color: "black",
                weight: 3
            },
            left: {
                color: "black",
                weight: 3
            },
            right: {
                color: "black",
                weight: 3
            },
            top: {
                color: "black",
                weight: 3
            }
        }
    },
    specificCellProperties // Array values are empty objects at this point.
};
options.specificCellProperties[0][0] = {
    horizontalAlignment: PowerPoint.ParagraphHorizontalAlignment.left,
    verticalAlignment: PowerPoint.TextVerticalAlignment.top
};
options.specificCellProperties[1][0] = {
    horizontalAlignment: PowerPoint.ParagraphHorizontalAlignment.center,
    verticalAlignment: PowerPoint.TextVerticalAlignment.middle
};
options.specificCellProperties[2][0] = {
    horizontalAlignment: PowerPoint.ParagraphHorizontalAlignment.right,
    verticalAlignment: PowerPoint.TextVerticalAlignment.bottom
};
await insertTableOnCurrentSlide(3, 3, options);
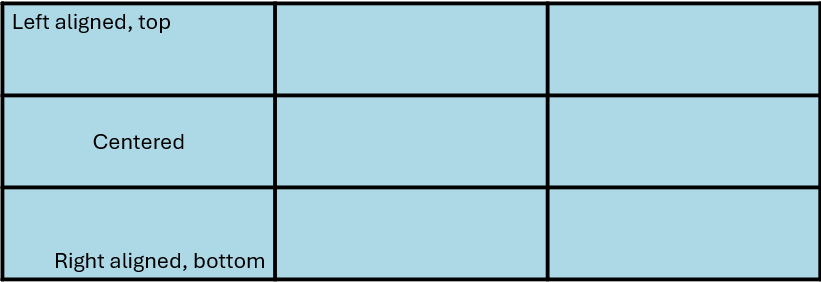
The previous sample creates a table with left/top, centered, and right/bottom text alignment as shown in the following image.
Specify row and column widths
Specify row and column widths using the TableAddOptions.rows and TableAddOptions.columns properties. The rows property is an array of TableRowProperties that you use to set each row's rowHeight property. Similarly, the columns property is an array of TableColumnProperties you use to set each column's columnWidth property. The width or height is set in points.
The height or width that you set may not be honored by PowerPoint if it needs to fit the text. For example, if the text is too wide for a column, PowerPoint will increase the row height so that it can wrap the text to the next line. Similarly, the column width will increase if the specified size is smaller than a single character in the specified font size.
The following code example shows how to set row height and column width for a new table. Note that the rows and columns properties must be set to an array of objects equal to their count.
const columnCount = 3;
const rowCount = 3;
const options: PowerPoint.TableAddOptions = {
    values: [
        ["Width 72pt", "Width 244pt", "Width 100pt"],
        ["", "", ""],
        ["", "^\n\nHeight 200 pt\n\nv", ""]
    ],
    // Initialize columns with an array of empty objects for each column.
    columns: Array(columnCount).fill("").map(_ => ({})),
    rows: Array(columnCount).fill("").map(_ => ({})),
    uniformCellProperties: {
        fill: { color: "lightcyan" },
        horizontalAlignment: PowerPoint.ParagraphHorizontalAlignment.center,
        verticalAlignment: PowerPoint.TextVerticalAlignment.middle,
        borders: {
            bottom: {
                color: "black",
                weight: 3
            },
            left: {
                color: "black",
                weight: 3
            },
            right: {
                color: "black",
                weight: 3
            },
            top: {
                color: "black",
                weight: 3
            }
        }
    }
};
options.columns[0].columnWidth = 72;
options.columns[1].columnWidth = 244;
options.columns[2].columnWidth = 100;
options.rows[2].rowHeight = 200;
await insertTableOnCurrentSlide(rowCount, columnCount, options);
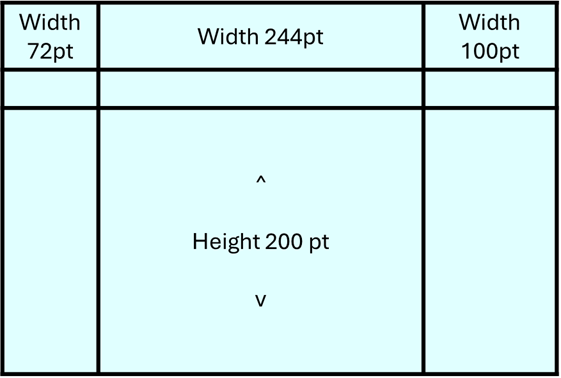
The previous sample creates a table with three custom column widths, and one custom row height, as shown in the following image.
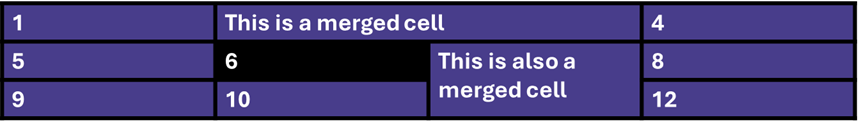
Specify merged areas
A merged area is two or more cells combined so that they share a single value and format. In appearance the merged area spans multiple rows or columns. A merged area is indexed by its upper left table cell location (row, column) when setting its value or format. The upper left cell of the merged area is always used to set the value and formatting. All other cells in the merged area must be empty strings with no formatting applied.
To specify a merged area, provide the upper left location where the area starts (row, column) and the length of the area in rows and columns. The following diagram shows an example of these values for a merged area that is 3 rows by 2 columns in size. Note that merged areas can't overlap with each other.
Use the TableAddOptions.mergedAreas property to specify one or more merged areas. The following code sample shows how to create a table with two merged areas. About the code sample, note the following:
The values property must only specify the value for the upper left corner of the merged area. All other cell values in the merged area must specify empty strings ("").
Each merged area must specify the upper left corner location (row, column) and the length in cells of the merged area in terms of row count and column count.
const rowCount = 3;
const columnCount = 4;
// Compact syntax to create a 2D array filled with empty and distinct objects.
const specificCellProperties = Array(rowCount).fill("").map(_ => Array(columnCount).fill("").map(_ => ({})));
const options: PowerPoint.TableAddOptions = {
    values: [
        ["1", "This is a merged cell", "", "4"],
        ["5", "6", "This is also a merged cell", "8"],
        ["9", "10", "", "12"]
    ],
    uniformCellProperties: {
        fill: { color: "darkslateblue" },
        font: { bold: true, color: "white" },
        borders: {
            bottom: {
                color: "black",
                weight: 3
            },
            left: {
                color: "black",
                weight: 3
            },
            right: {
                color: "black",
                weight: 3
            },
            top: {
                color: "black",
                weight: 3
            }
        }
    },
    mergedAreas: [{ rowIndex: 0, columnIndex: 1, rowCount: 1, columnCount: 2 },
    { rowIndex: 1, columnIndex: 2, rowCount: 2, columnCount: 1 }
    ],
    specificCellProperties // Array values are empty objects at this point.
};
// Set fill color for specific cell at row 1, column 1.
options.specificCellProperties[1][1] = {
    fill: { color: "black" }
};
await insertTableOnCurrentSlide(rowCount, columnCount, options);
The previous sample creates a table with two merged areas as shown in the following image.
Get and set table cell values
After a table is created, you can get or set string values in the cells. Note that this is the only part of a table you can change. You can't change borders, fonts, widths, or other cell properties. If you need to update a table, delete it and recreate it. The following code sample shows how to find an existing table and set a new value for a cell in the table.
await PowerPoint.run(async (context) => {
    // Load shapes.
    const shapes = context.presentation.getSelectedSlides().getItemAt(0).shapes;
    shapes.load("items");
    await context.sync();
    // Find the first shape of type table.
    const shape = shapes.items.find((shape) => shape.type === PowerPoint.ShapeType.table)
    const table = shape.getTable();
    table.load();
    await context.sync();
    // Set the value of the specified table cell.
    const cell = table.getCellOrNullObject(1, 1);
    cell.text = "A new value";
});
You can also get the following read-only properties from the table.
- rowCount
- columnCount
The following sample shows how to get the table properties and log them to the console. The sample also shows how to get the merged areas in the table.
await PowerPoint.run(async (context) => {
    // Load shapes.
    const shapes = context.presentation.getSelectedSlides().getItemAt(0).shapes;
    shapes.load("items");
    await context.sync();
    // Find the first shape of type table.
    const shape = shapes.items.find((shape) => shape.type === PowerPoint.ShapeType.table)
    const table = shape.getTable();
    // Load row and column counts.
    table.load("rowCount, columnCount");
    // Load the merged areas.
    const mergedAreas = table.getMergedAreas();
    mergedAreas.load("items");
    await context.sync();
    // Log the table properties.
    console.log(mergedAreas);
    console.log(table.rowCount);
    console.log(table.columnCount);
});
Collaborate with us on GitHub
The source for this content can be found on GitHub, where you can also create and review issues and pull requests. For more information, see our contributor guide.
Office Add-ins