Note
Access to this page requires authorization. You can try signing in or changing directories.
Access to this page requires authorization. You can try changing directories.
These are the latest features in the Stable release of Microsoft Edge DevTools.
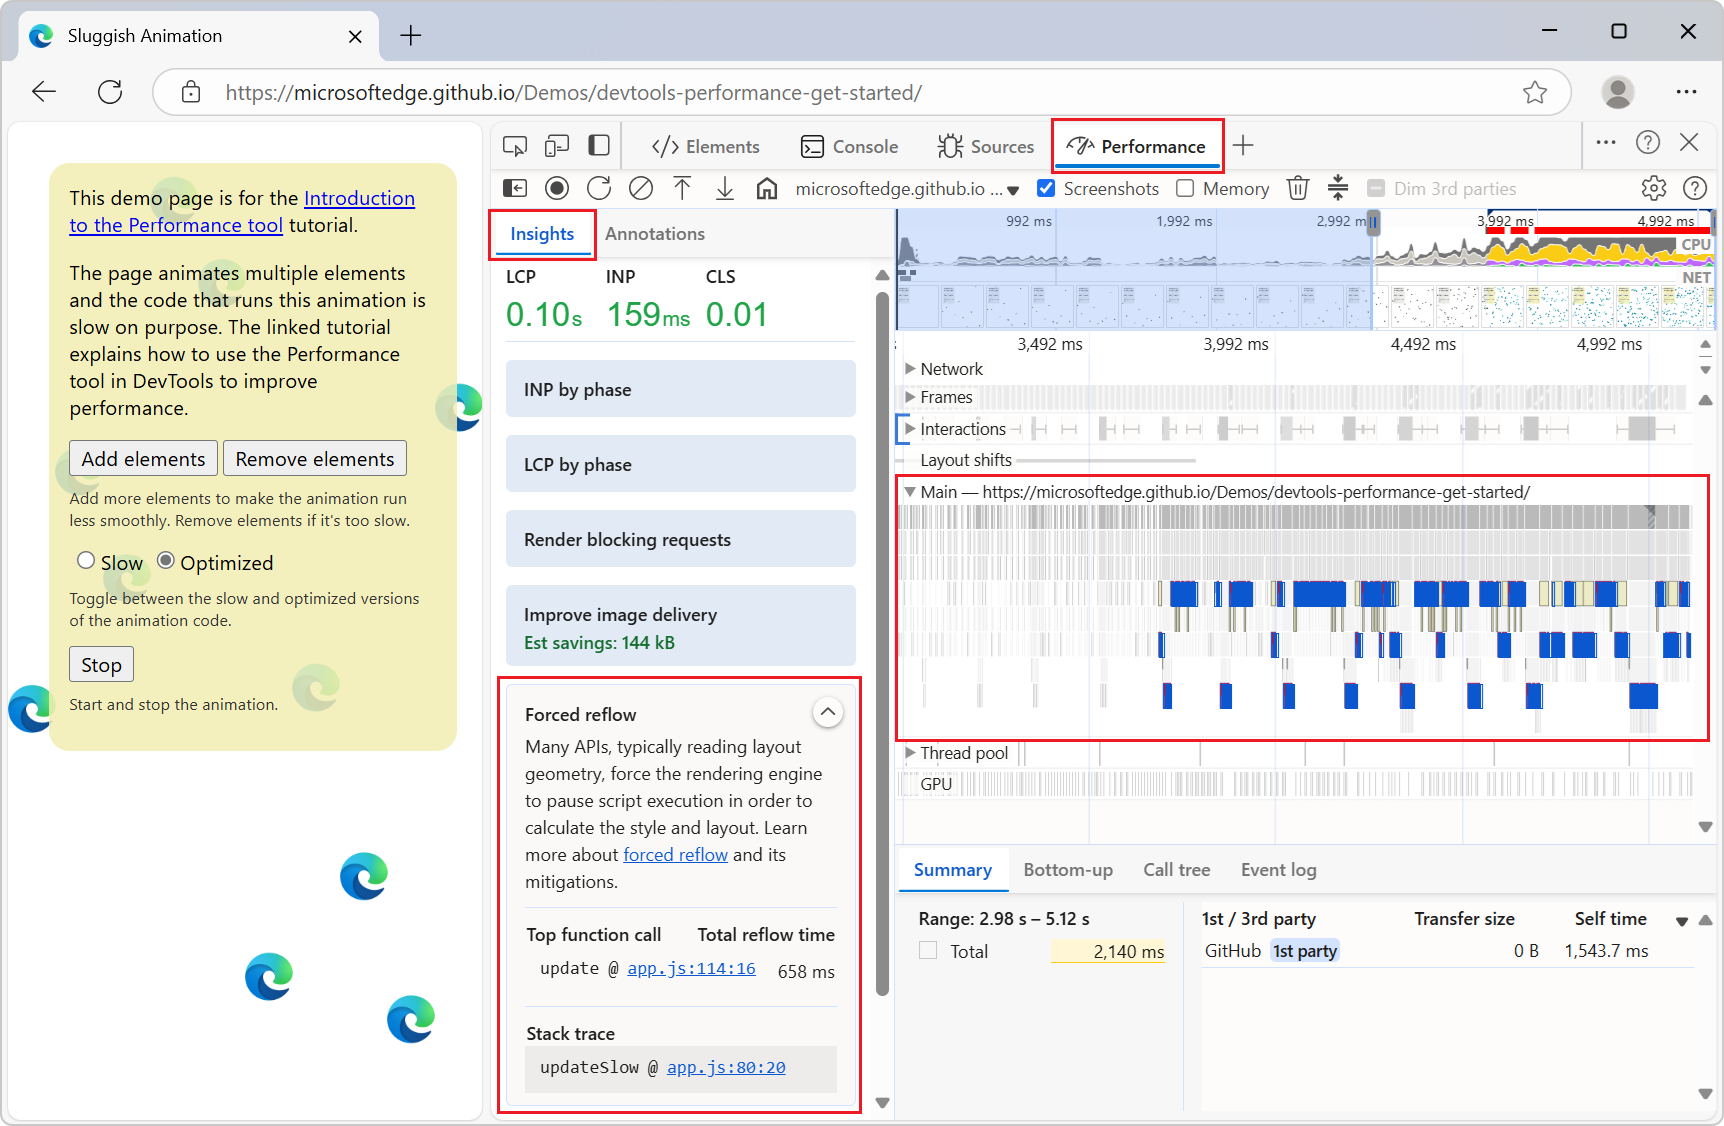
Forced reflow in the Performance Insights sidebar
The Performance Insights sidebar includes a new section called Forced Reflow. This insight highlights the most time-consuming function call, showing its total reflow time and related stack traces. By clicking on this insight, you can see the function call and its stack trace highlighted in the Main frame:
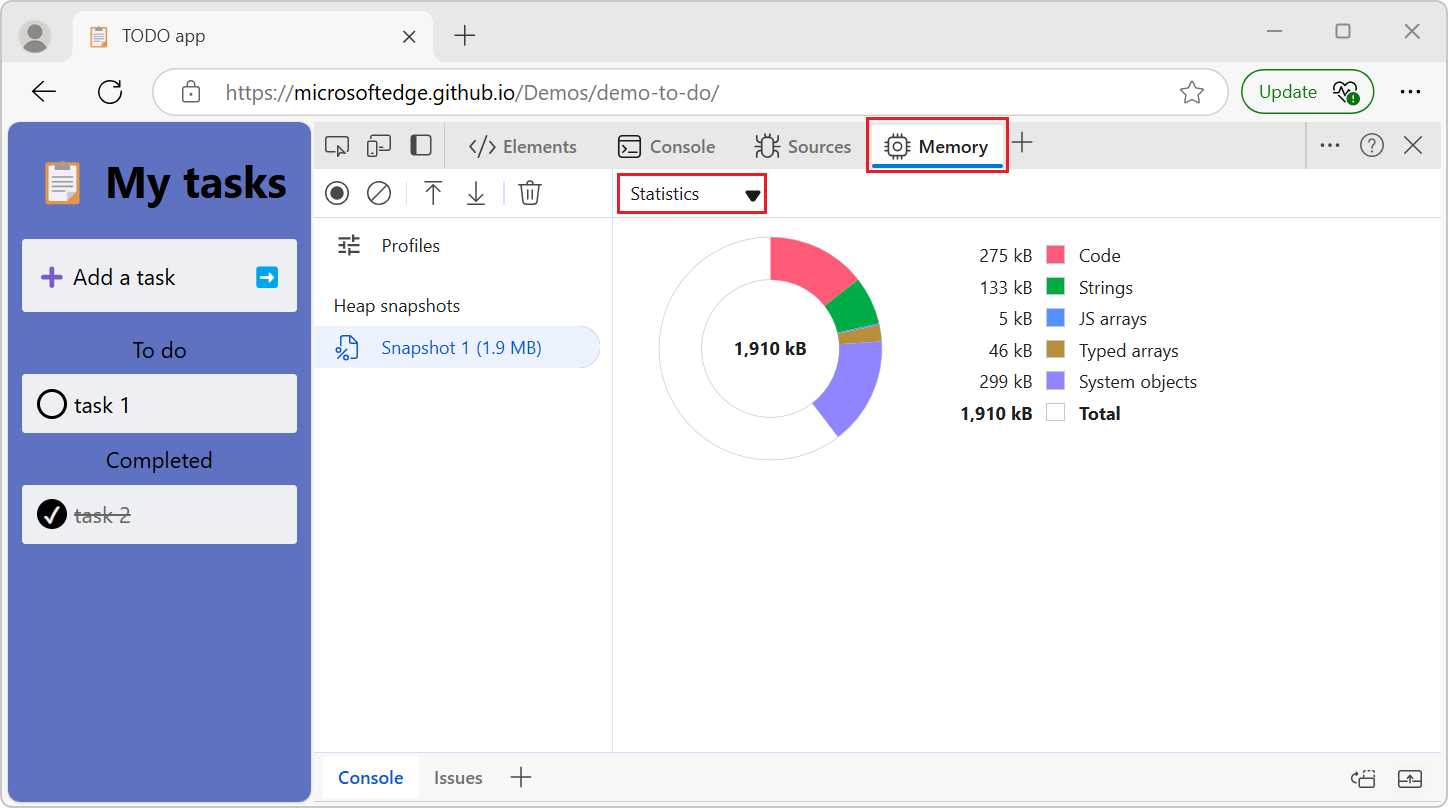
Heap snapshot statistics account for every byte
Previously, when you took a heap snapshot in the Memory tool, the Statistics pie chart didn't show every byte that's in the categories, resulting in blank parts of the chart:
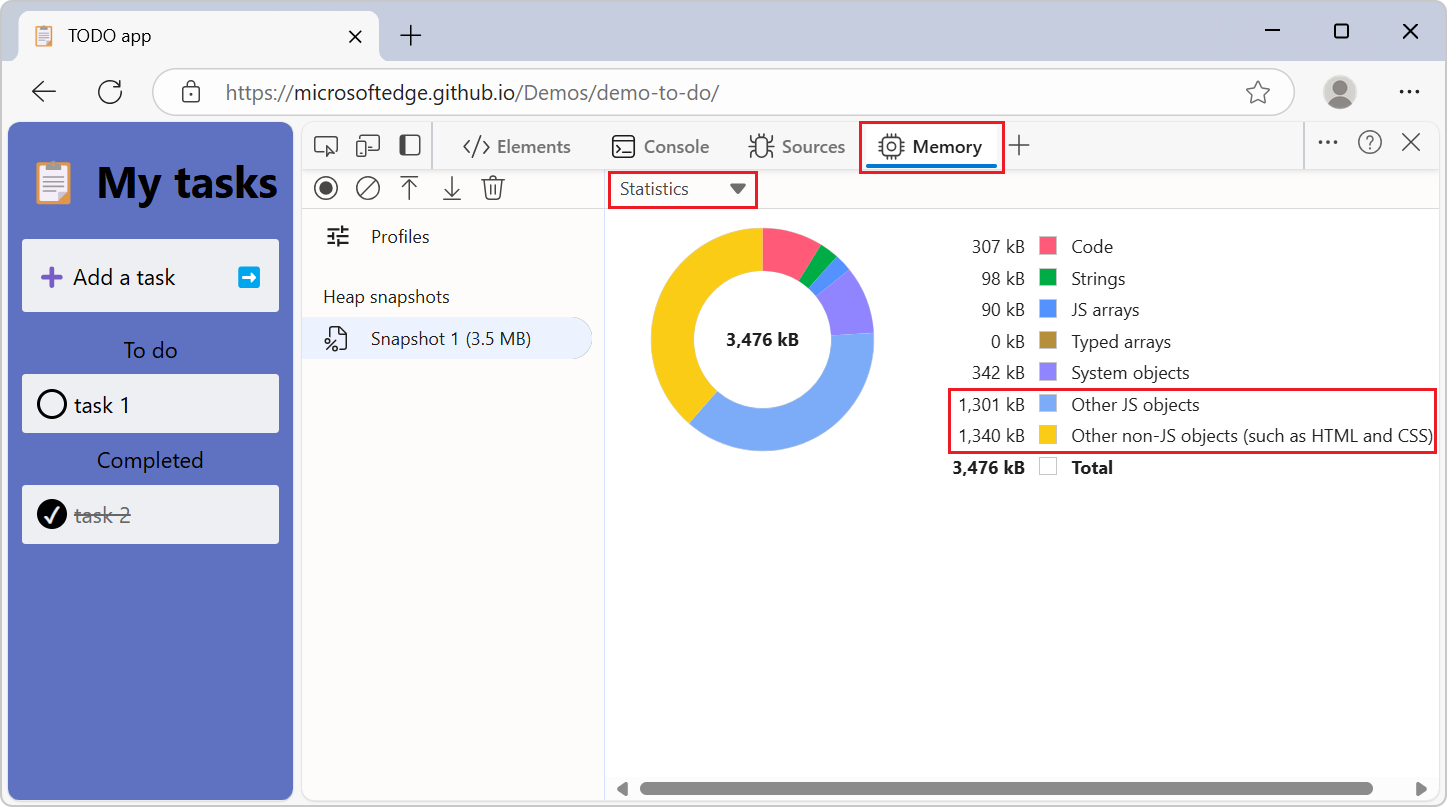
To fix this, two new catch-all categories have been added, to account for the rest of the bytes in the heap snapshot:
- Other JS objects
- Other non-JS objects (such as HTML and CSS)
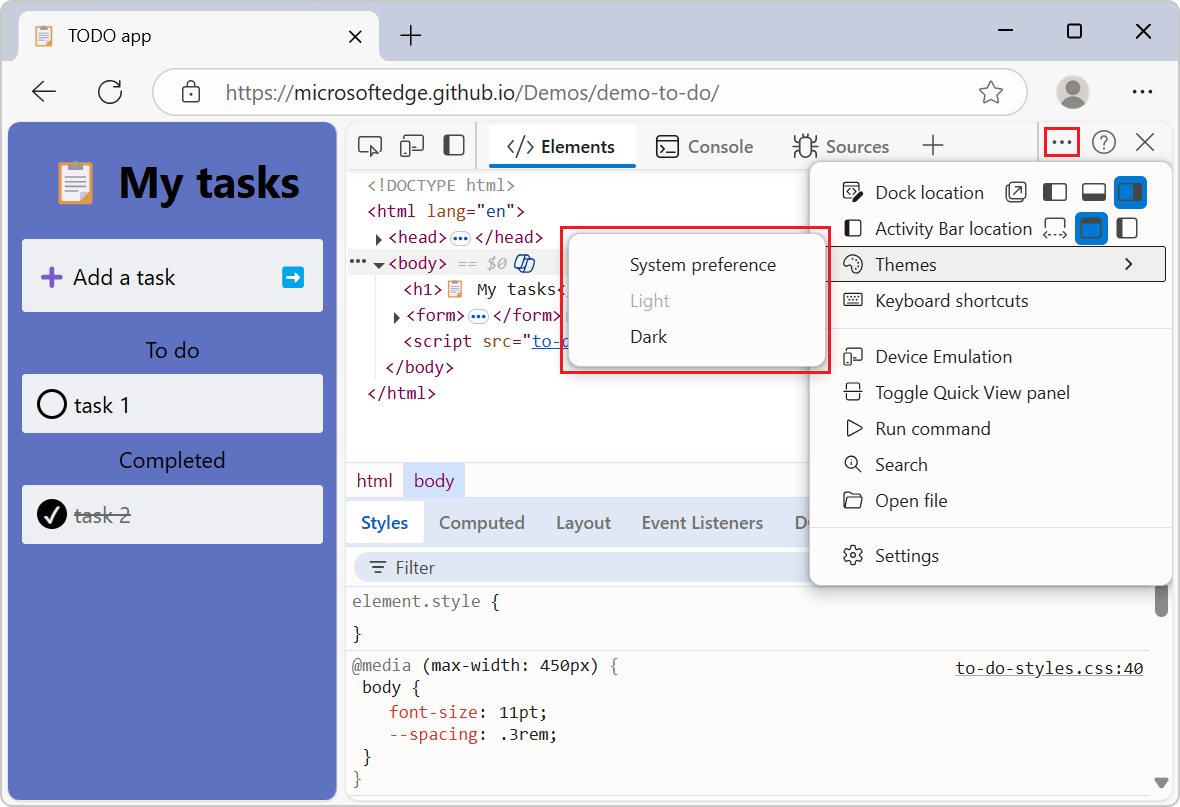
Simplified DevTools Themes menu
The theme options have been simplified by removing the redundant nesting options. When you go to Customize and control DevTools > Themes, the options have been simplified to System preference, Light, and Dark:
Announcements from the Chromium project
Microsoft Edge 134 also includes the following updates from the Chromium project:
- Privacy and security panel
- Performance panel improvements
- Elements panel improvements
- Copy all console messages
- Byte units in the Memory panel