Note
Access to this page requires authorization. You can try signing in or changing directories.
Access to this page requires authorization. You can try changing directories.
The Analytics page in Copilot Studio provides an aggregated insight into the overall health of your agent with event triggers across analytics sessions.

There are three core areas to focus on when reviewing and improving agent effectiveness:
- Run outcomes: Knowing the end result of a session started by a trigger helps you begin to identify where your agent is succeeding and where it needs improvement.
- Trigger use: Seeing which triggers are used and how often helps you understand what your agent is doing and why.
- Tool use: Learning how often tools are used and how often they succeed can help you understand if those tools are useful and successful.
To change the time range, select the range dropdown at the top of the Activity page. You can view analytics for sessions that occurred in the last 90 days.
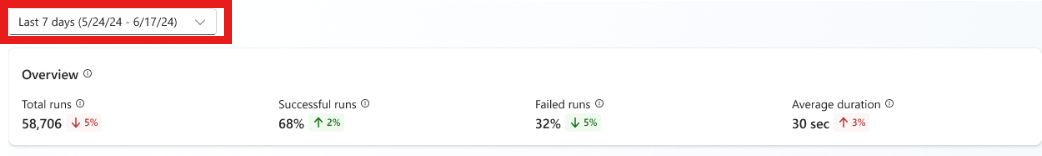
Run outcomes
The Run outcomes section shows a chart that tracks the type of outcome for each session.
You can also see a breakdown of session durations. Select See details on the Run outcomes chart. A side panel opens with the average duration for successful runs and failed sessions and how the length of sessions changed over time.
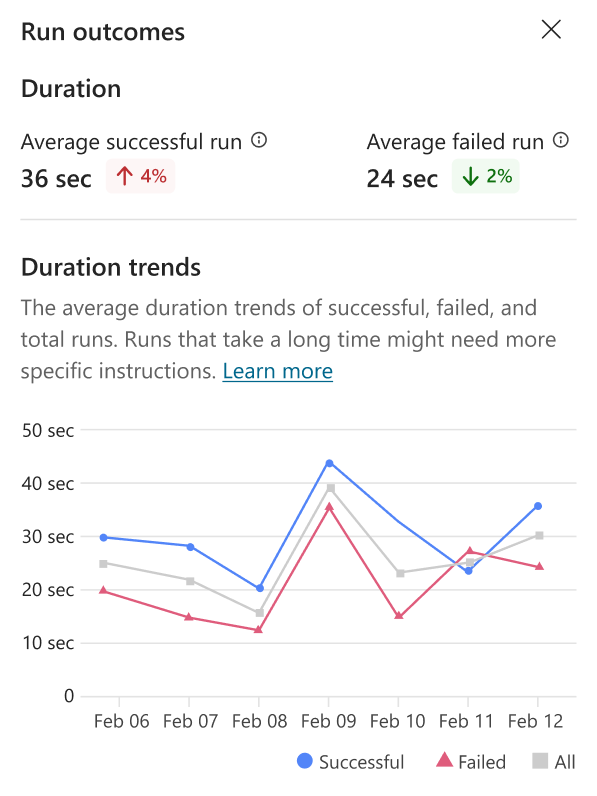
Long session durations can cause delays in workflows your agent is a part of. You can improve your agent's speed by providing more specific instructions at the trigger or agent level.
Trigger use
The Trigger use section shows a chart and metrics that track how often each trigger initiated a session. The chart shows the change in trigger use over time.
Select See details to view a breakdown of all triggers used during the selected time period, the most common events that triggered a run, and which events resulted in the most failed runs.
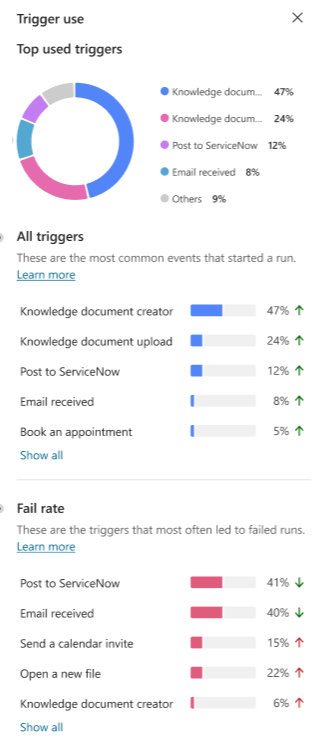
You can use this information to target specific runs for improvements, and understand which kind of events your agents responds to the most.
Tool use
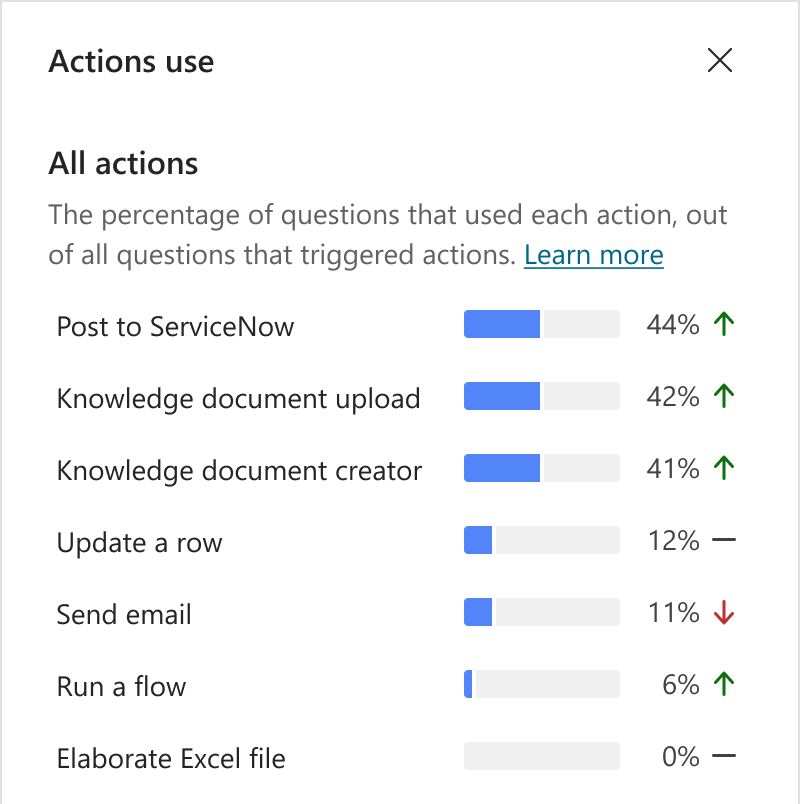
The Tool use section shows a chart and metrics that track how often your tools are called over time, and how often your agent uses those tools successfully.
It also shows trend indicators for how often your agent uses each tool and the percentage of called tools used successfully.
The chart displays the top five tools used over the date period defined at the top of the Analytics page.
To open a side panel with a list of all tools used in the specified time period, along with trend indicators, select See details on the chart.
Knowledge source use
The Knowledge source use section shows a chart and metrics that track how often your knowledge sources are used by your agent. It also shows trend indicators for how often your sources are being used, how many errors are being generated, and how many times the source is being used.
The chart displays the top five knowledge sources used over the date range defined at the top of the Analytics page.
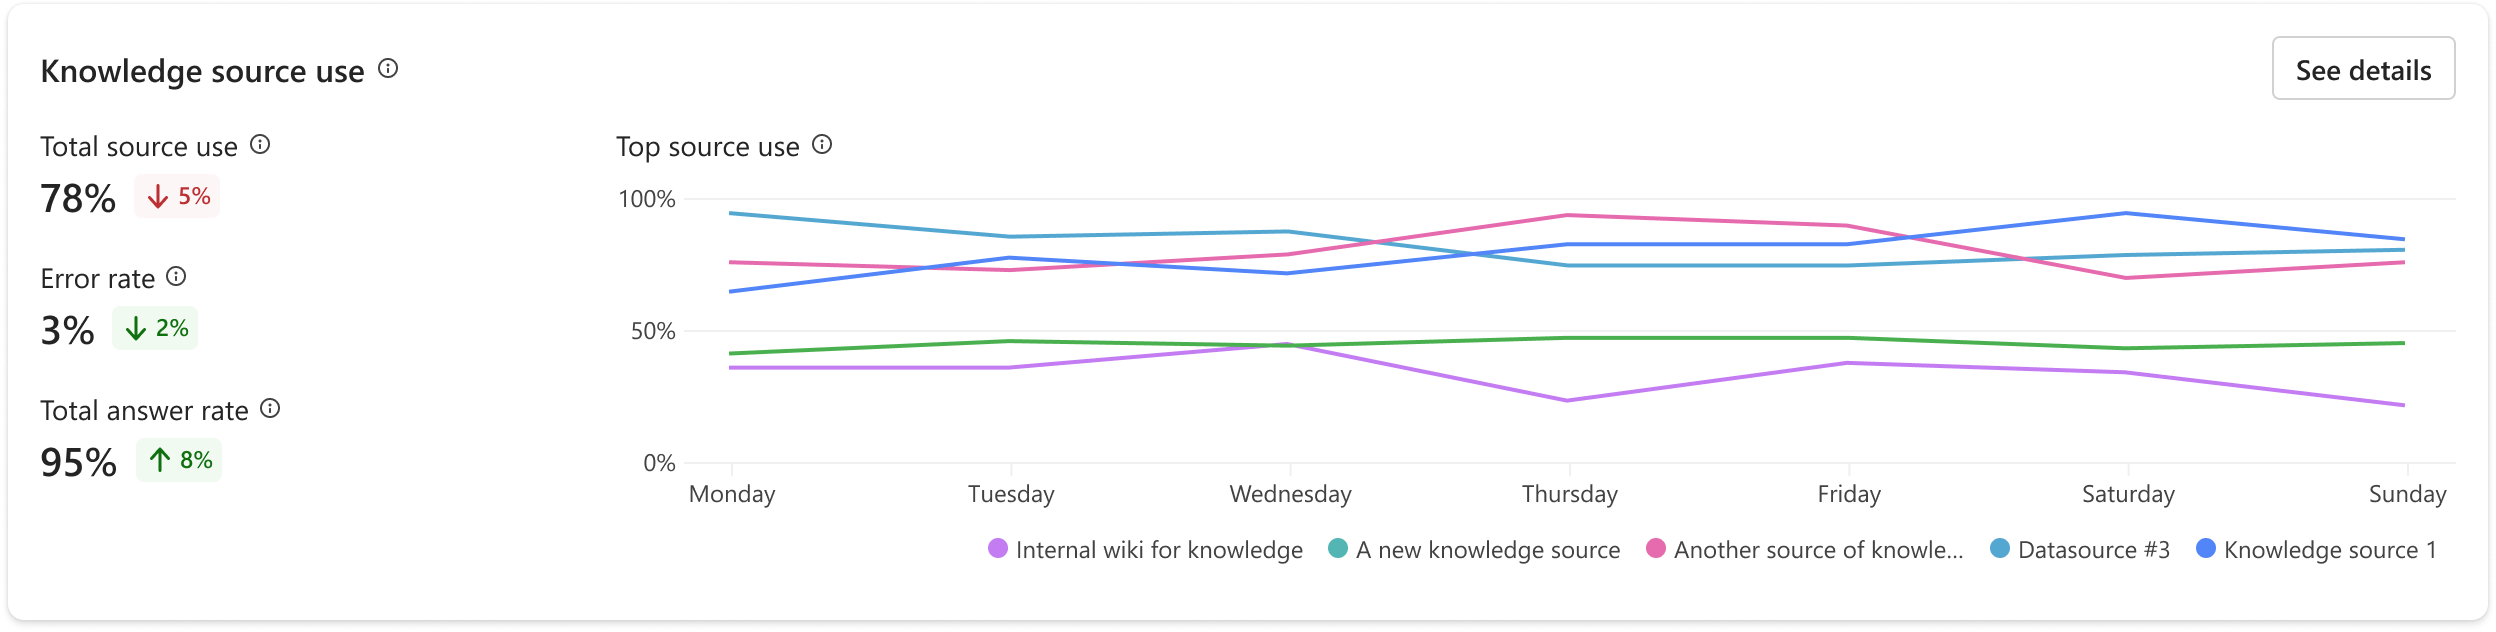
Select See details to open a side panel with knowledge source usage and error rates over your selected time period. You can use these charts to identify which knowledge sources work well to help users, and which to target for improvements.
- Knowledge source use shows the percentage of sessions that used each knowledge source the agent has access to.
- Errors shows the percentage of sessions that used each knowledge source type (for example, SharePoint) that resulted in an error.