Note
Access to this page requires authorization. You can try signing in or changing directories.
Access to this page requires authorization. You can try changing directories.
[This article is prerelease documentation and is subject to change.]
The Analytics page in Copilot Studio provides an aggregated insight into the overall effectiveness of your agent across analytics sessions.

There are four core areas to focus on when reviewing and improving agent effectiveness:
- Outcomes and engagement: Knowing the end result of a conversation helps you begin to identify where your agent is succeeding and where it needs improvement.
- Answer rate and quality: Understanding when agent struggles to provide answers to user questions and how it uses knowledge sources can help you find ways to improve your agent's answer rate and quality.
- Tool use: Learning how often tools are used and how often they succeed can help you understand if those tools are useful and successful for users.
- Satisfaction: Reviewing user feedback helps you to identify new user scenarios and issues and make improvements based directly on what your users are asking for.
You can view analytics for events that occurred in the last 90 days.
Outcomes and engagement
The Outcomes and engagement section shows a chart that tracks the type of outcome for each session between your agent and users.

To open a side panel with a pie chart breakdown of session outcomes, along with the top topics that led to each outcome, select See details on the chart.
A session falls into one of the following two states:
- Unengaged: A session starts when a user interacts with your agent or the agent sends a proactive message to the user. The session begins in an unengaged state.
- Engaged: A session becomes engaged when one of the following occurs:
- a nonsystem topic is triggered
- the session is escalated
- the fallback topic is triggered
- the conversational boosting topic is triggered
Once the session becomes engaged, it remains engaged. An engaged session has one of the following outcomes:
- Escalated: A session ends and is considered escalated when the Escalate topic is triggered or a Transfer to agent node is run (the current analytics session ends, whether the conversation transfers to a live agent or not).
- Resolved confirmed: A session is considered resolved confirmed when End of Conversation topic is triggered, and the user confirms that the interaction was a success.
- Implied resolved: A session is implied resolved when the session is considered completed without user confirmation. What causes an implied resolved state depends on whether your agent uses classic or generative orchestration:
- Classic orchestration: A session is considered implied resolved when the End of Conversation topic is triggered, and the user lets the session time out without providing a confirmation.
- Generative orchestration: A session is considered implied resolved when a session ends after 15 minutes of inactivity, and there are no remaining active plans. An active plan is a plan that is waiting for a user's input.
- Abandoned: A session ends and is considered abandoned when an engaged session times out after 15 minutes and didn't reach a resolved or escalated state.
You can also set the outcome for tools with the conversationOutcome parameter using the tool code editor. For example, conversationOutcome: ResolvedConfirmed for confirmed success or conversationOutcome: ResolvedImplied for implied success.
See the guidance documentation Measuring copilot engagement for suggestions and best practices on how to measure and improve engagement.
Answer rate and quality (preview)
Important
This article contains Microsoft Copilot Studio preview documentation and is subject to change.
Preview features aren't meant for production use and may have restricted functionality. These features are available before an official release so that you can get early access and provide feedback.
If you're building a production-ready agent, see Microsoft Copilot Studio Overview.
With generative answers, your agent can use AI to generate answers to user queries using knowledge sources and the instructions you provide. However, your agent might not be able to answer all user queries. The Answer rate and quality section tracks, organizes, and analyzes unanswered queries and answer quality to give you guidance for improving your agent's answering performance.
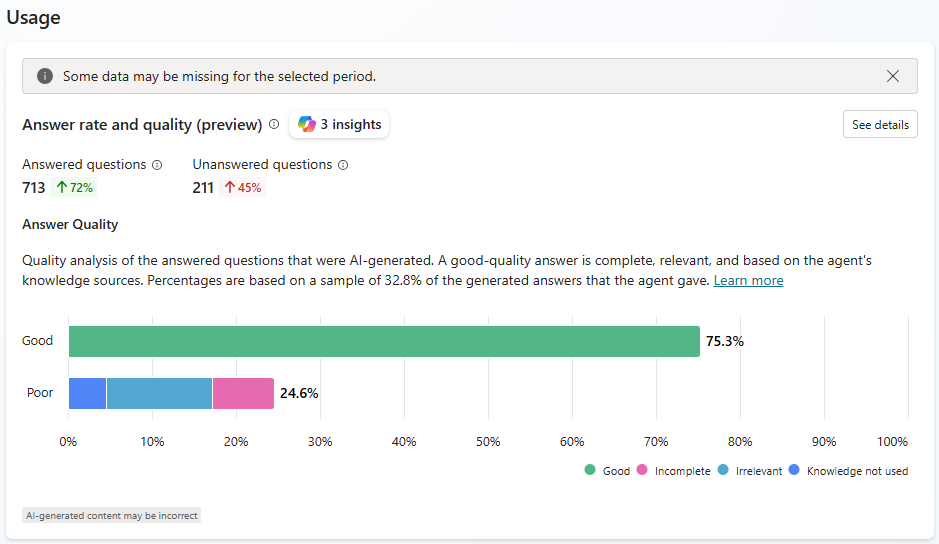
The Answer rate shows the number of answered and unanswered questions within the selected time period, as well as the percentage change over time.
Answer quality measures the quality of answers using AI. Copilot Studio looks at a sample set of answered question and analyzes different quality, including completeness, relevance, and level of groundedness of a response. If the answer meets a set standard, Copilot Studio labels the answer as Good quality. Copilot Studio labels answers that don't meet that standard as Poor quality. For Poor answers, Copilot Studio assigns a reason for the quality rating, and shows the percentage of answers assigned to each category.
Select See details to open a side panel with question answer rates, knowledge source usage, and error rates over your selected time period. You can use these charts to identify which knowledge sources work well to help users, and which to target for improvements.
- Unanswered questions shows the reasons why the agent didn't answer a user query.
- Knowledge source use shows the percentage of sessions that used each knowledge source the agent has access to.
- All sources shows the percentage of questions that used each knowledge source.
- Errors shows the percentage of queries that resulted in a knowledge-related error for each knowledge source type (for example, SharePoint).
Insights (preview)
Analytics uses AI to provide custom insights about how successfully your agent answers user queries. Copilot Studio analyses unanswered queries, clusters them into groups by theme, then generates contextual insights based on actions that can improve the performance of each group. Copilot Studio generates clusters for this insight type daily, using all unanswered user queries from the last seven days. You can view the top five insights.
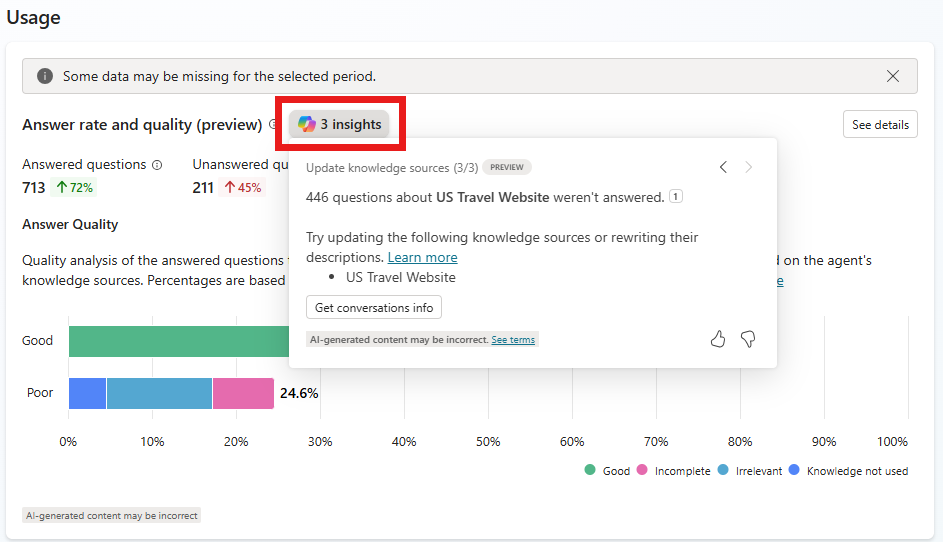
Select Insights in the Answer rate and quality section.
Use the < and > arrows to switch between insights.
Select citations to see more details about the insight.
You can also select Get conversations info to download a CSV list of conversation IDs where these unanswered user queries appear.
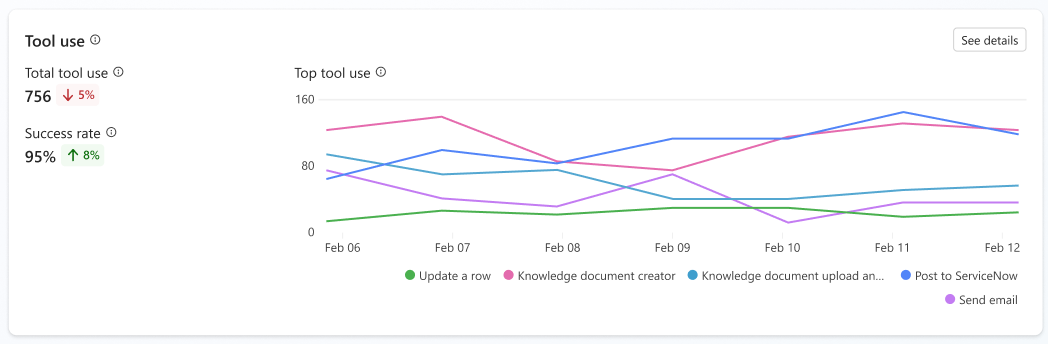
Tool use
The Tool use section shows a chart and metrics that track how often your tools are started over time, and how often your agent used those tools successfully. It also shows trend indicators for how often your agent uses each tool and the percentage of called tools used successfully.
The chart displays the top five tools used over the date period defined at the top of the Analytics page.
To open a side panel with a list of all tools used in the specified time period, along with trend indicators, select See details on the chart.
Satisfaction
The Satisfaction section shows user feedback gathered from reactions to agent responses and survey results for a session. Satisfaction metrics are available for:
- Test chat
- Demo website
- Teams and Microsoft 365 Copilot
- Custom website
- Webchat SDK and test chat
User feedback is On by default. You can turn off this feature, if desired. You can also add or edit a disclaimer for users about how their feedback is used:
Open the agent, then go to Settings, and find the User feedback section.
Turn Let users give feedback when using this agent either On or Off.
Add or edit a disclaimer so users know how their feedback is used. You can also provide privacy information and tips.
Reactions
The Reactions chart counts the number of times users selected either the thumbs up (positive) or thumbs down (negative) buttons available on each response they received from your agent.
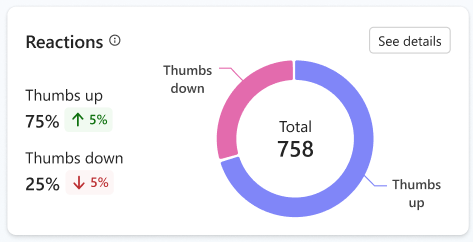
After a user provides a reaction, they can leave a comment. To view comments, select See details. Select All, Thumbs up, or Thumbs down to filter comments.
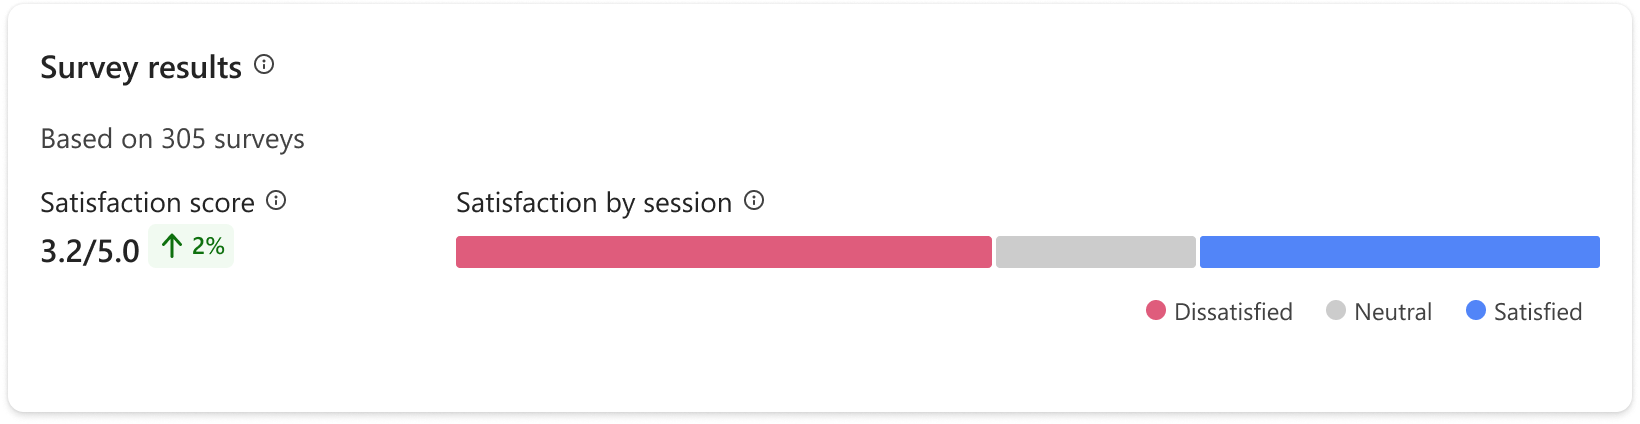
Survey results
The Survey results section shows a chart and metrics that track the average customer satisfaction (CSAT) scores for sessions in which customers respond to an end-of-session request to take a survey.