Note
Access to this page requires authorization. You can try signing in or changing directories.
Access to this page requires authorization. You can try changing directories.
Fabric notebooks allow you to create and share documents containing live code, equations, visualizations, and narrative text. It's useful for a wide range of tasks, such as data cleaning and transformation, numerical simulation, statistical modeling, data visualization, and machine learning.
Kqlmagic extends the capabilities of the Python kernel in Fabric notebooks so you can run Kusto Query Language (KQL) queries natively from notebook cells. You can combine Python and KQL to query and visualize data using the rich Plotly library integrated with the render operator.
For more information on notebooks, see How to use Microsoft Fabric notebooks.
In this tutorial, you learn how to use Kqlmagic to run advanced queries and visualizations from data in a KQL database. It uses pre-created datasets and notebooks in both the Real-Time Intelligence and the Data Engineering environments in Microsoft Fabric.
In this tutorial, you learn how to:
- Create a KQL database
- Get data
- Import a notebook with Kqlmagic
- Run the notebook
Prerequisites
- A workspace with a Microsoft Fabric-enabled capacity
- A KQL database with editing permissions
1. Create a KQL database
In this step, you create an empty KQL database named NYCTaxiDB in your workspace or in an existing Eventhouse.
Select your workspace from the left navigation bar.
Follow one of these steps to start creating a KQL database:
- Select New item and then Eventhouse. In the Eventhouse name field, enter NYCTaxiDB, then select Create. A KQL database is generated with the same name.
- In an existing eventhouse, select Databases. Under KQL databases select +, in the KQL Database name field, enter NYCTaxiDB, then select Create.
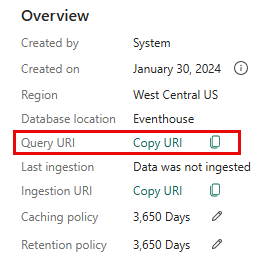
Select the NYCTaxiDB database, expand Database details, copy the Query URI and paste it somewhere, like a notepad, to use in a later step.
2. Get data
In this step, you use a script to first create a table with specified mapping, and then get data from a public blob into this table.
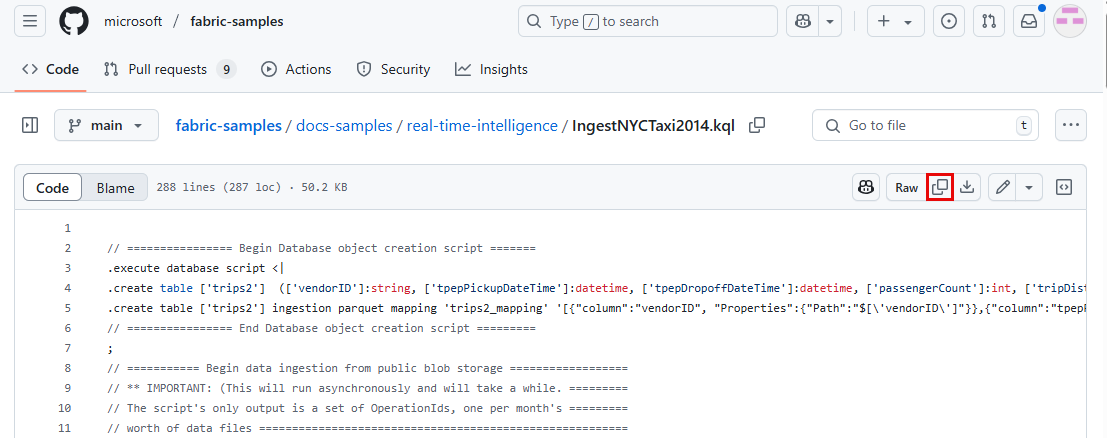
Copy the KQL script from the Fabric samples repository on GitHub
Browse to your KQL database.
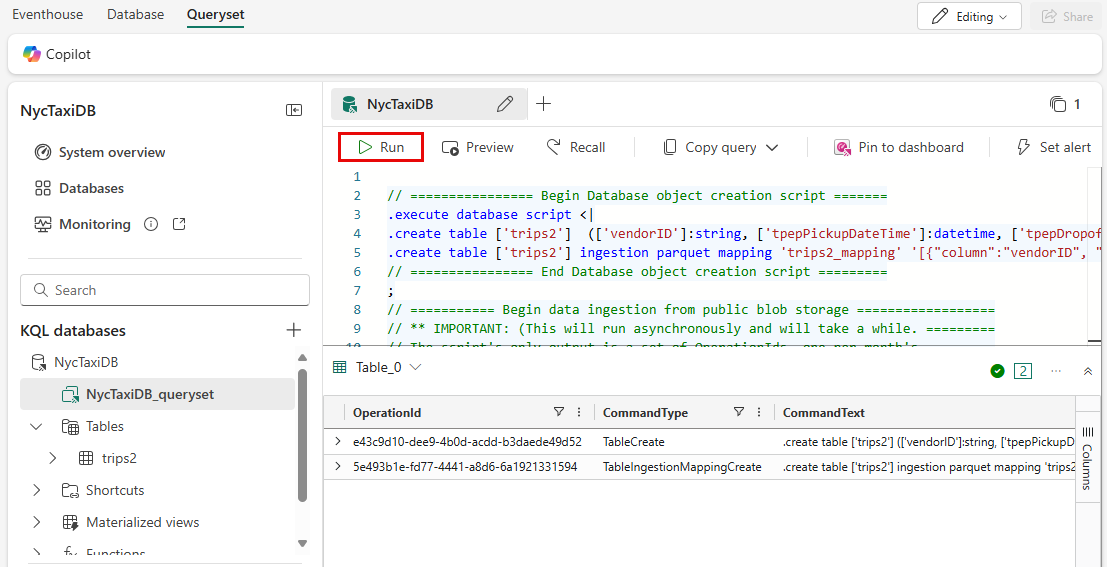
Select Query with code to open an empty tab in the NYCTaxiDB_queryset.
Paste the KQL script from step 1. and select the Run button.
The first query creates the table and schema mapping. The output of this query shows the table and mapping creation information, including the type of command and the result of Completed when finished. The second query loads your data. It might take a few minutes for the data loading to complete.
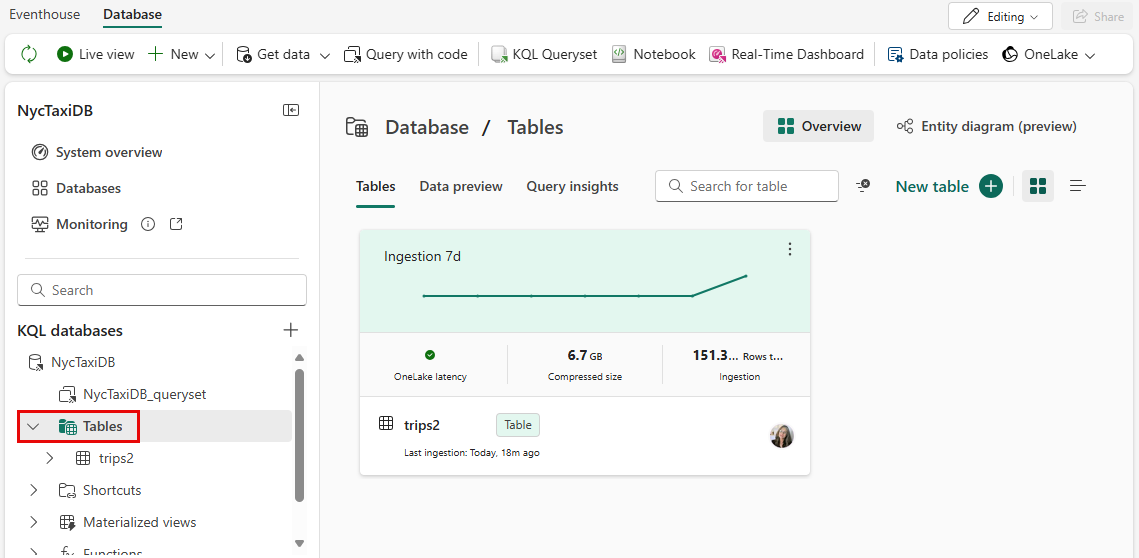
Refresh the queryset and select Tables to see an overview of the newly created table named trips2. From here you can expand the table schema, preview the data, and view query insights.


3. Download the NYC Taxi demo notebook
Use a sample notebook to query and visualize the sample data you loaded in your KQL database.
Open the Fabric samples repository on GitHub and download the NYC Taxi KQL Notebook..
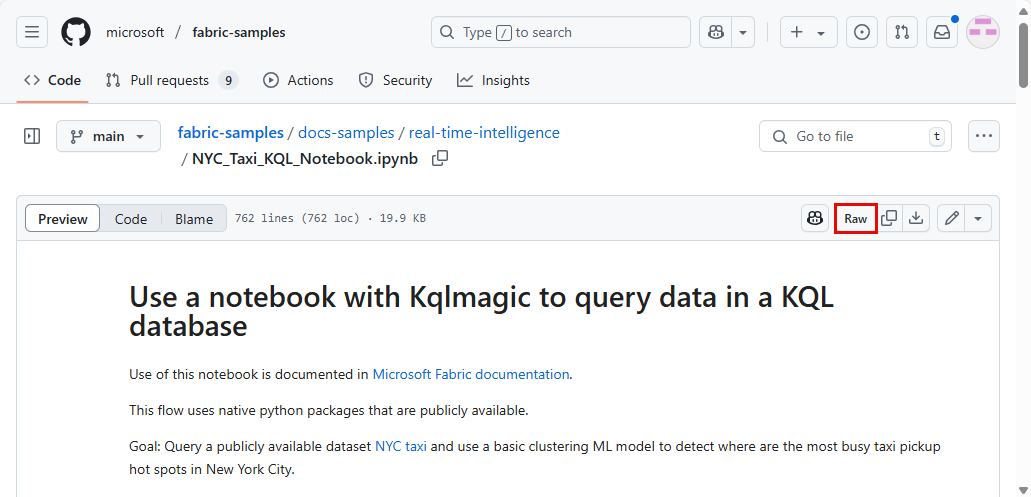
Download the notebook locally to your device.
Note
The notebook must be saved in the
.ipynbfile format.

4. Import the notebook
The rest of this workflow uses Kqlmagic to query and visualize the data in your KQL database.
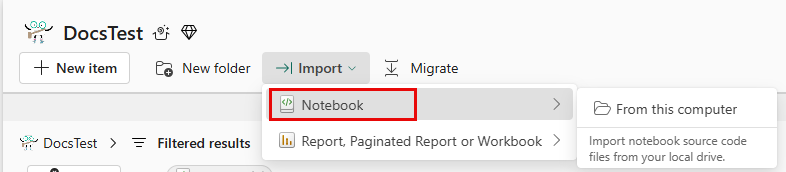
In your Workspace, select Import > Notebook < From this computer.
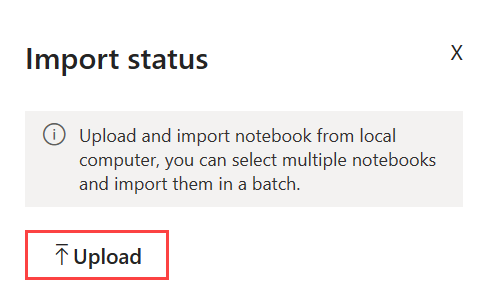
In the Import status pane, select Upload.
Select the NYC Taxi KQL Notebook that you downloaded in step 3.
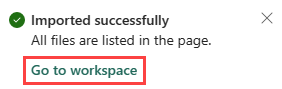
Once the import is complete, select Go to workspace and open this notebook.
5. Run the notebook
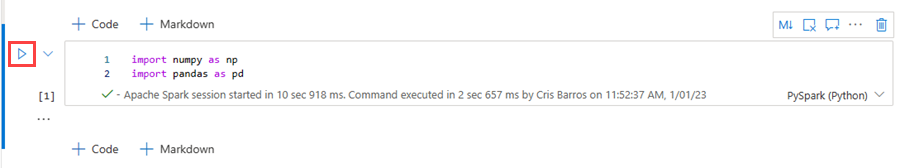
Select the play button to run each cell sequentially, or select the cell and press Shift+ Enter. Repeat this step for each package.
Note
Wait for the completion check mark to appear before running the next cell.
Run the remaining cells sequentially to create a heatmap of NYC taxi pickups. For more information on Kqlmagic, see Use a Jupyter Notebook and Kqlmagic extension to analyze data
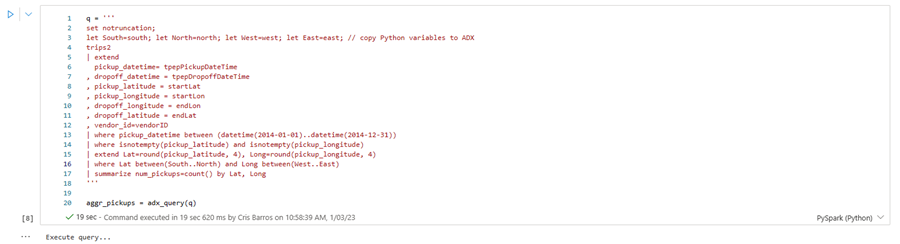
The following cell aggregates all pickups within the specified geographic boundary.
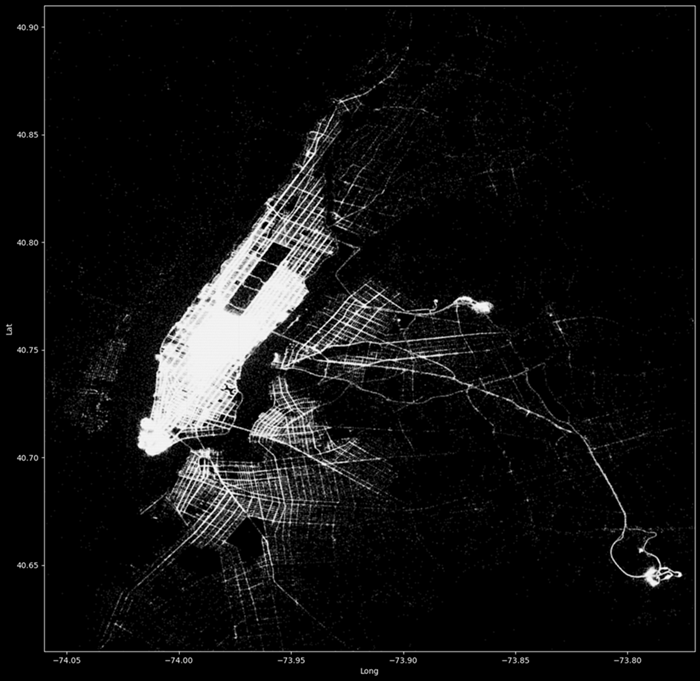
Run the following cell to draw a heatmap of NYC taxi pickups.

In the resulting heatmap, you can see that most of the taxi pickups are in the lower Manhattan area. In addition, there are also many taxi pickups at JFK and La Guardia airport.


6. Clean up resources
Clean up the items created by navigating to the workspace in which they were created.
In your workspace, hover over the notebook you want to delete, select the More menu [...] > Delete.
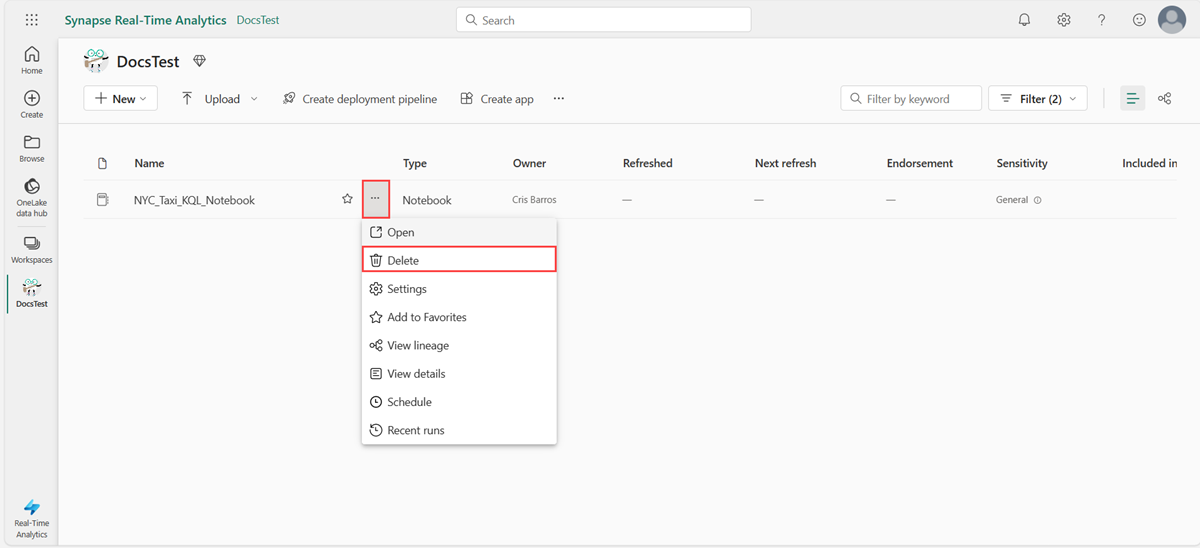
Select Delete. You can't recover your notebook once you delete it.
