Note
Access to this page requires authorization. You can try signing in or changing directories.
Access to this page requires authorization. You can try changing directories.
An Eventhouse is a scalable environment for processing and analyzing large volumes of real-time data. It supports structured streaming for continuous data ingestion and analysis, and uses Kusto Query Language (KQL) to easily gain insights from your data. The Eventhouse page serves as the central hub for all your interactions within the Eventhouse environment. It's your gateway to seamlessly manage and monitor an eventhouse, navigate through databases, and perform various Eventhouse-related actions.
In this article, you learn about how to manage and gain insights about an eventhouse in Real-Time Intelligence.
For advanced analytic insights, see View Workspace monitoring and Eventhouse monitoring overview.
Prerequisites
- A workspace with a Microsoft Fabric-enabled capacity
- An eventhouse in your workspace
Navigate to an Eventhouse page
Browse to your workspace homepage in Real-Time Intelligence.
Select an eventhouse from your list of items in the workspace.

This page is divided into the following sections:
A. Eventhouse ribbon: The ribbon provides quick access to essential actions within the Eventhouse.
B. Explorer pane: The explorer pane provides an intuitive interface for navigating between Eventhouse views and working with databases.
C. Main view area: The main view area displays the system overview details for the eventhouse.
D. Details area: The details area provides additional information about the eventhouse.
Eventhouse ribbon
The Eventhouse ribbon is your quick-access action bar, offering a convenient way to perform essential tasks within an Eventhouse. From here, you can refresh your main view, enable minimum consumption, add databases, add plugins, and collapse or expand the details area.
Enable always-on
Always-on prevents your eventhouse from suspending the service due to inactivity. For highly time-sensitive systems, it prevents the latency of re-activating the eventhouse.
- From the ribbon, select Always-On
- In the Always-On pane, select the option to Enable the feature
Enable minimum consumption
In addition to Always-On you can optionally set the Minimum consumption. This sets a minimum available capacity unit (CU) size for an eventhouse. After you enable Always-On, you have the option to enable Minimum consumption
In the Always-On pane, select Minimum consumption
In the Minimum consumption pane, select the size corresponding to the minimum available CU size you want to apply to this eventhouse, and then select Done.
The following table maps the size to the minimum capacity units allotted to the eventhouse:
Minimum CUs SSD capacity (GB) of free storage 4.25 50 8.5 200 13 800 18 3500-4000 26 5250-6000 34 7000-8000 50 10500-12000 Custom ~200/CU (Ex: 100 CU = ~20,000 GB) 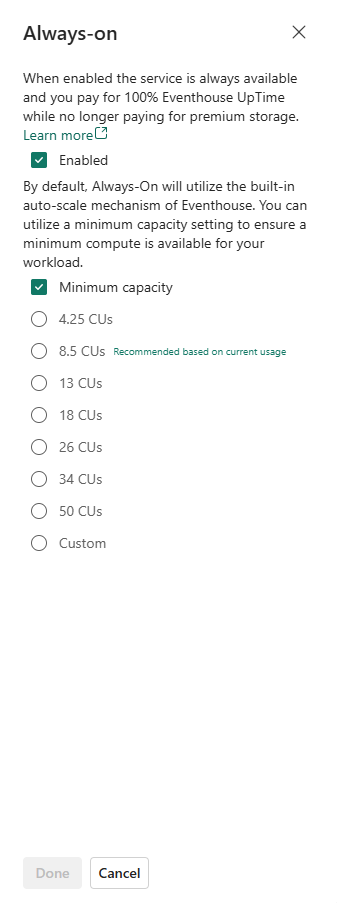
Explorer pane
The Eventhouse explorer provides an intuitive interface for navigating between Eventhouse views and for working with databases.
View eventhouse details
The eventhouse details area displays the region, last ingestion date, minimum consumption setting, and plugins. You can expand or collapse the details area using the button, or from the ribbon.
In the details area, you can copy the following eventhouse URI values:
| URI type | Usage |
|---|---|
| Query URI | URI that can be used to add database shortcuts or by connectors and APIs to run queries or management commands. |
| Ingestion URI | URI that is for use by connectors and APIs to ingest data. |
| Always-on | Minimum available capacity unit (CU) size for your eventhouse. |
View system overview
The system overview page provides a snapshot of the current state of the eventhouse.
From the Eventhouse explorer, select System overview.
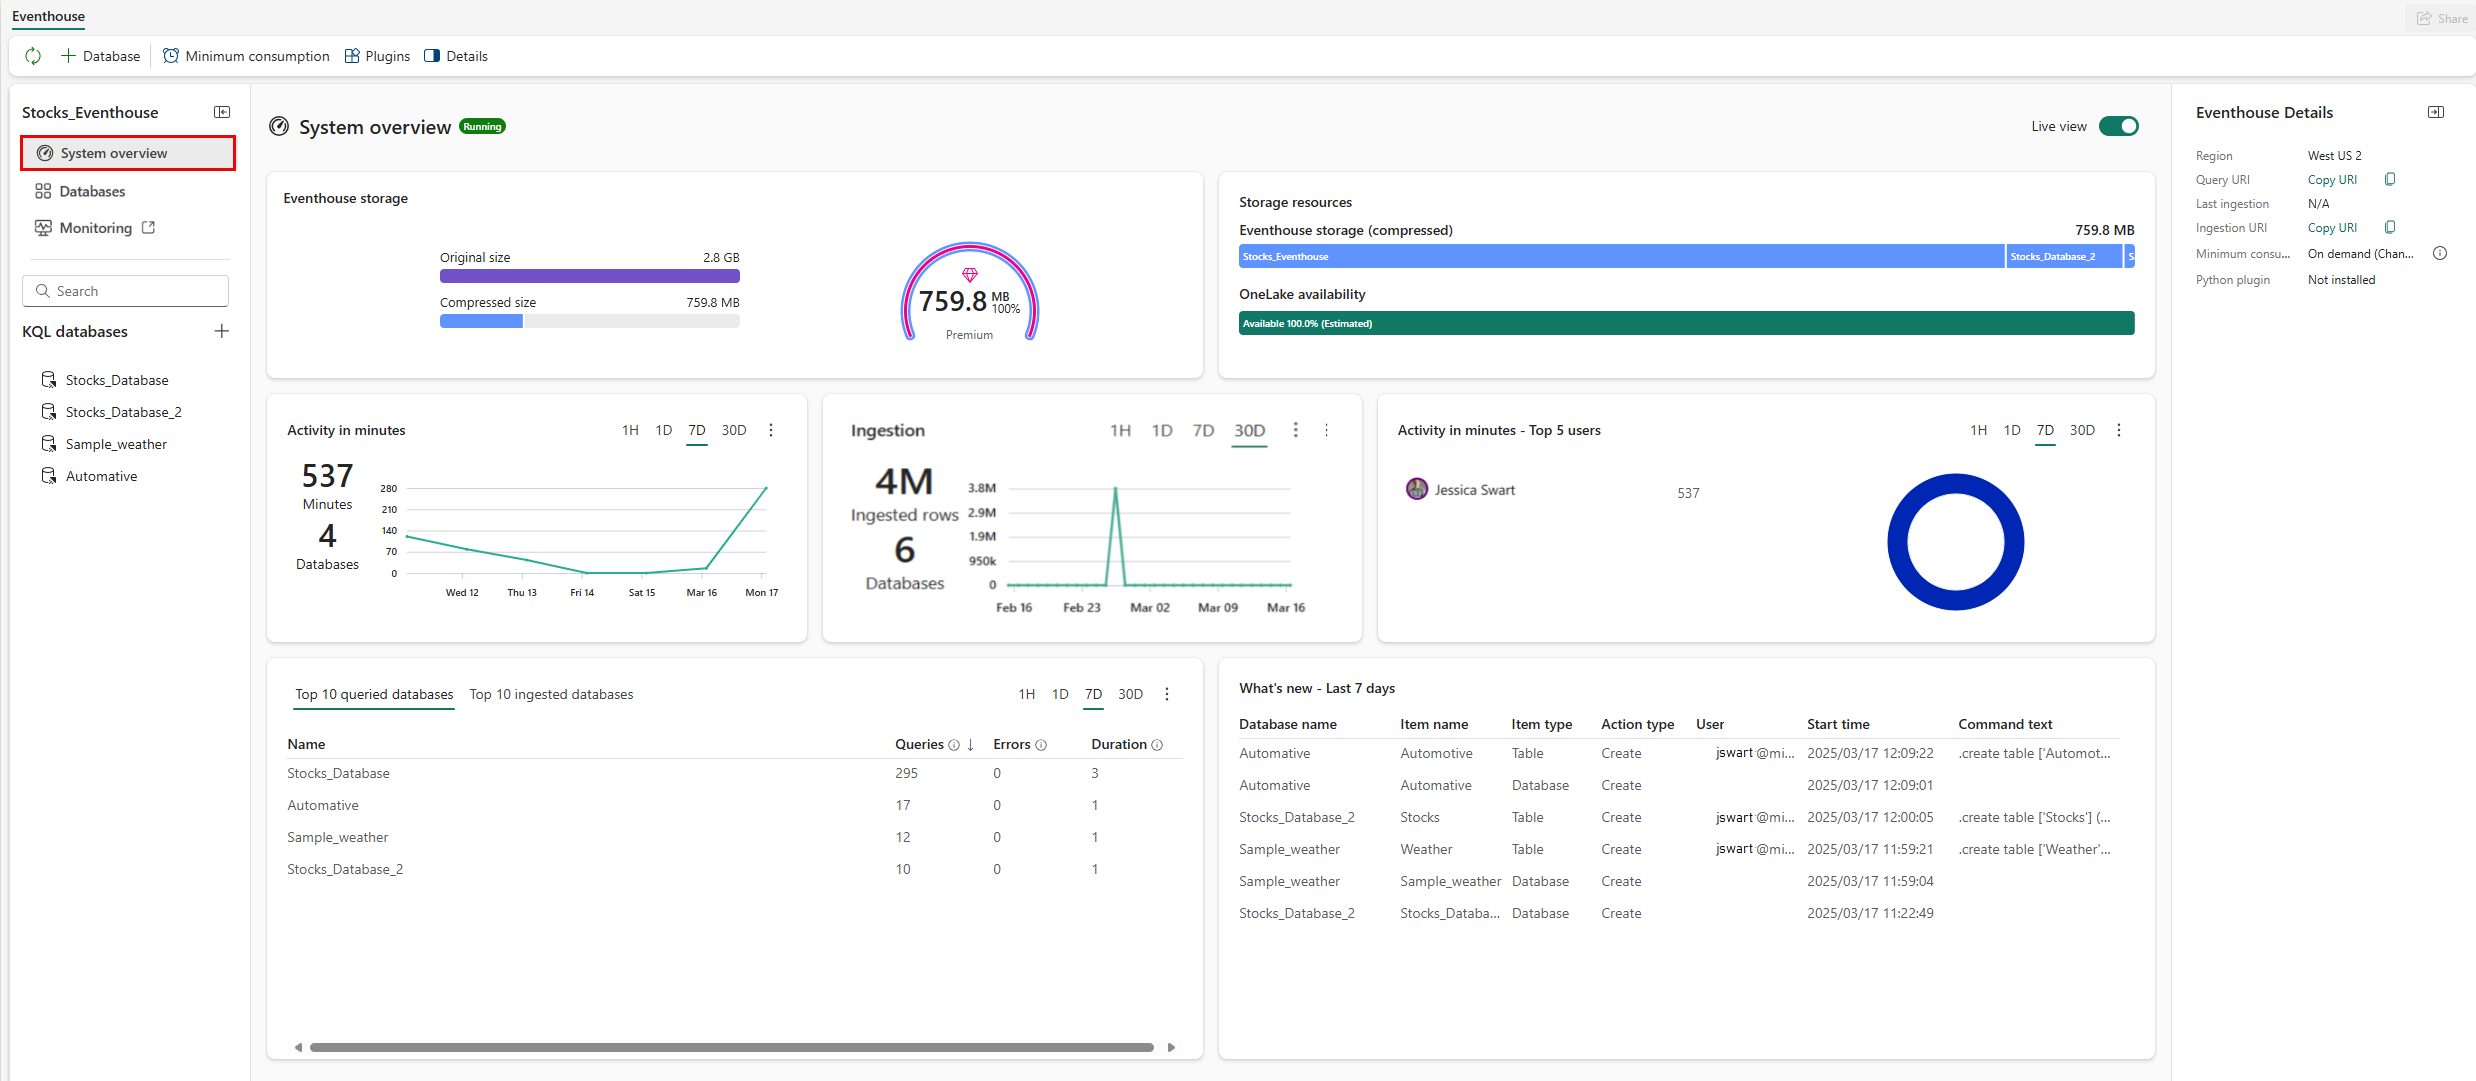
The system overview page displays the following information:
Running state of the eventhouse: Shows the operational status of the eventhouse.
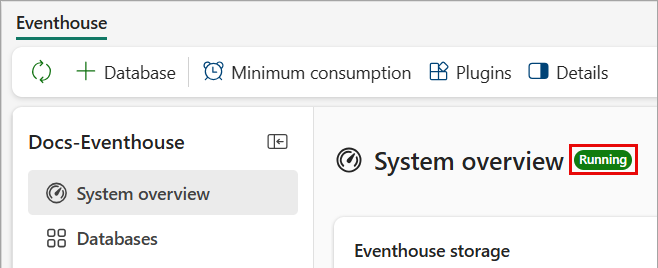
Possible states are:
- Running: The eventhouse is running optimally.
- Maintenance: The eventhouse is temporarily unavailable. Try refreshing the page later. If you enabled security features, try connecting to your environment using a VPN connection.
- Missing capacity: The eventhouse is unavailable because your organization's Fabric compute capacity reached its limits. Try again later or contact your capacity admin to increase the capacity.
- Suspended capacity: The capacity used for this eventhouse was suspended. To reverse the suspension, contact your capacity admin.
- Unknown: For unknown reasons, the eventhouse is unavailable.
Eventhouse storage: Shows the storage capacity of the eventhouse. The storage capacity is divided into categories:
- Original size: The uncompressed original data size of the eventhouse.
- Compressed size: The compressed data size of the eventhouse.
- Premium: The amount of Premium storage utilized. This tier is the high-performance storage tier for your most active data, ensuring the fastest possible access for real-time processing and analysis. If all data isn't stored in the Premium cache, query latency might be negatively impacted. For more information, review your caching policy.
Storage resources: Shows a snapshot of the storage breakdown by database. You can drill down into each database from the bar to see the details. You can adjust a databases storage usage by configuring its caching policy.
Activity in minutes: Shows the duration in minutes to run compute operations such as queries and commands. It's important to note that compute minutes don't directly correspond to compute units, which represent the actual processing time consumed by these operations.
For example, if two users execute queries at the same time, one taking 3 minutes and the other 5 minutes, the total compute minutes would be 8. But since these queries ran together, the actual compute units used are just 5 minutes.
In the case where 78 queries and 173 ingest operations run at the same time and total 183 compute minutes, if they all finish within a 5-minute period, the actual compute units used is still only 5 minutes.
Ingestion: Shows the number of ingested rows and the number of databases that the data was ingested to. The information can help you understand the amount of data that is ingested into the eventhouse over time.
Top 10 queried databases: Highlights the most active databases in the eventhouse, including the number of queries, errors, duration per database, and cache misses. The information can assist you in obtaining a comprehensive overview of which databases are utilizing compute units.
Top 10 ingested databases: Highlights the number of ingested rows and ingestion errors for the databases with the most ingested rows. Currently only partial ingestion errors are reported.
Activity in minutes - top 5 users: Shows the total compute minutes of the most active users. The information can help you understand the efficiency with which users are utilizing compute units.
What's new - Last 7 days: Highlights database owners and recent eventhouse events, such as the following operations:
- Create or delete a database
- Create, alter, or delete a table
- Create or delete an external table
- Create, alter, or delete a materialized view
- Create, alter, or delete a function
- Alter a caching policy, retention policy, or table update policy
Optionally, select one of the tabs at the top of a card to filter its date by time range. These tabs allow you to filter by one hour (1H), one day (1D), one week (7D), one month (30D).

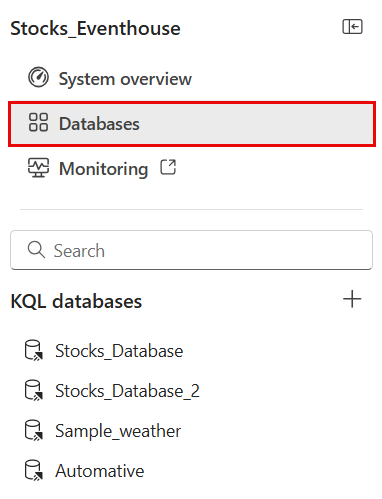
View databases overview
The databases overview page provides a summary of all the databases in the eventhouse.
From the Eventhouse explorer, select Databases.
 '
'A window opens with details about all the databases in this eventhouse.
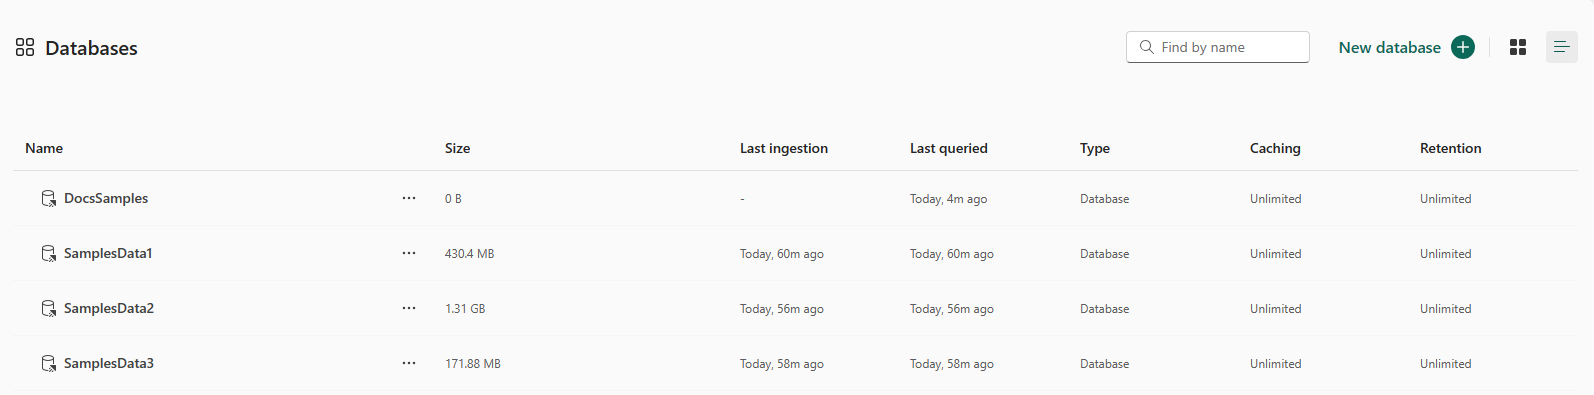
Toggle between list and tile view using the buttons on the top right of the page.
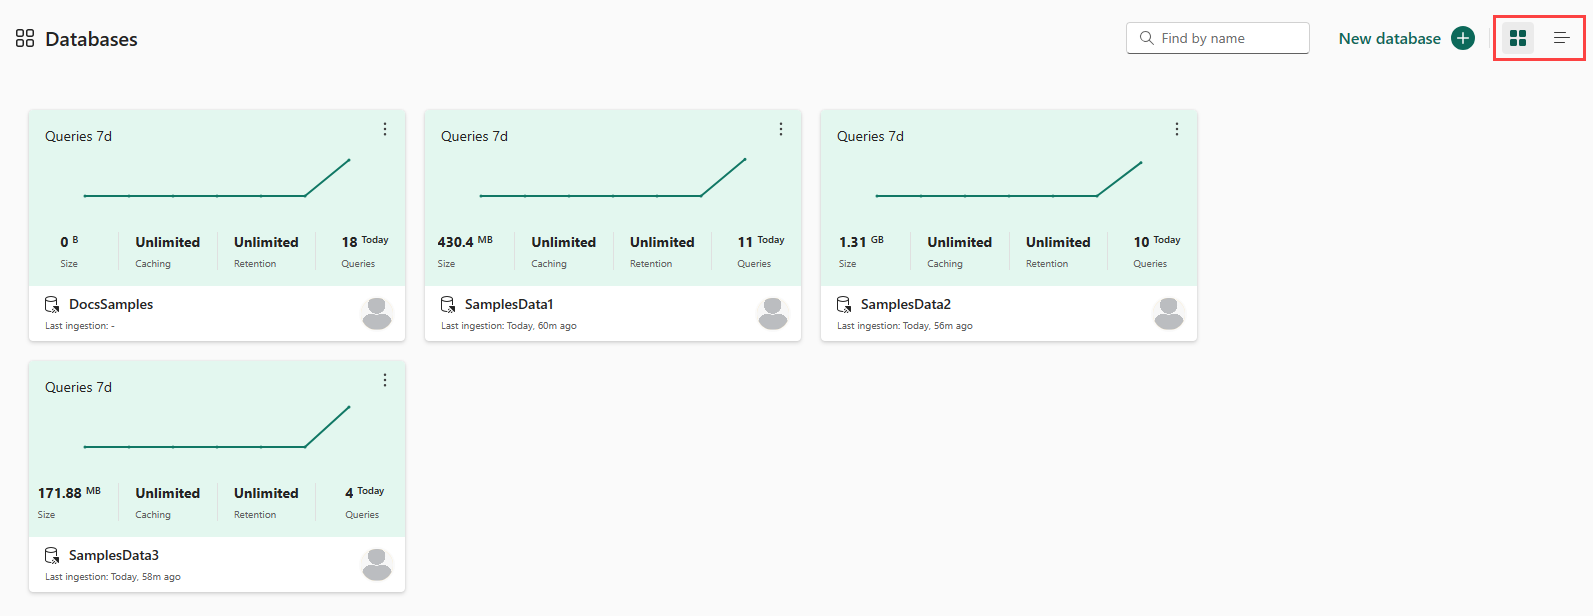
To explore a specific database, select the name of this database from the list. For more information, see (manage-monitor-database.md).


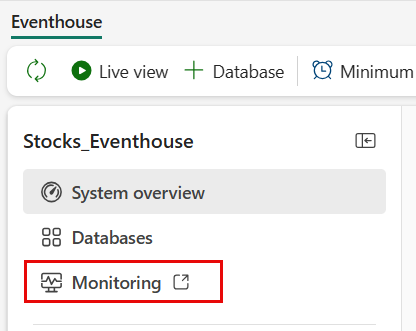
View Workspace monitoring
You can access the read-only Workspace monitoring database from the Eventhouse explorer pane. Workspace monitoring provides a set of tables that you can query to get insights into the usage and performance of your eventhouse. For more information about the monitoring data that you can query, see Eventhouse monitoring.
Note
- If the monitoring option is enabled, workspace logging is turned on.
- If the monitoring option is disabled, workspace logging is turned off. See Enable monitoring in your workspace.
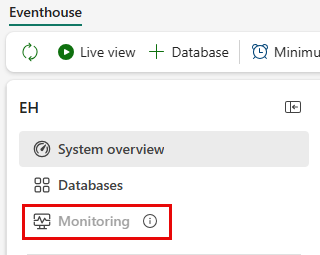
From the Eventhouse explorer, select Monitoring to open the Monitoring Eventhouse in a new window.
In the Monitoring KQL database overview page, view the query insights and query the data.
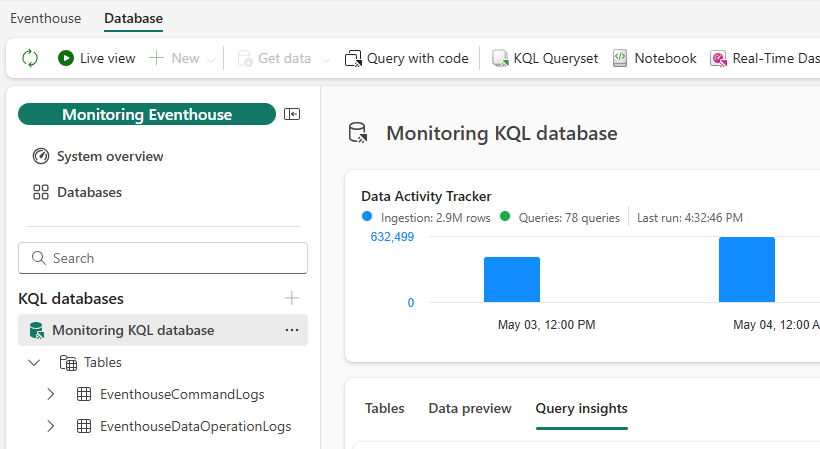
For information about the monitoring data that you can query, see Eventhouse monitoring.