Note
Access to this page requires authorization. You can try signing in or changing directories.
Access to this page requires authorization. You can try changing directories.
[This article is prerelease documentation and is subject to change.]
Learn about the queries that you can use to retrieve the diagnostics data for unified routing from Application Insights.
Important
- This is a preview feature.
- Preview features aren’t meant for production use and might have restricted functionality. These features are subject to supplemental terms of use, and are available before an official release so that customers can get early access and provide feedback.
Fallback queues
Purpose: Diagnose number of work items routed to fallback queues.
Query
let _endTime = datetime(2024-11-21T22:29:53Z);
let _startTime = datetime(2024-09-22T21:29:53Z);

Traces
| where timestamp >= _startTime and timestamp <= _endTime
| extend customDim = parse_json(customDimensions)
| extend conversationId = tostring(customDim["powerplatform.analytics.resource.id"]),
         subscenario = tostring(customDim["powerplatform.analytics.subscenario"]),
         queueResult = parse_json(tostring(customDim["omnichannel.result"])).DisplayName
| extend scenario = tostring(customDim["powerplatform.analytics.scenario"])
| where scenario == "ConversationDiagnosticsScenario"
| where subscenario == "RouteToQueue" and queueResult == "[Insert Your Fallback queue name]"
| project timestamp, conversationId, queueResult
Overflow handling
Purpose: Diagnose number of work items where overflow is trigger.
Query
Traces
| extend customDim = parse_json(customDimensions)
| extend conversationId = tostring(customDim["powerplatform.analytics.resource.id"]),
         subscenario = tostring(customDim["powerplatform.analytics.subscenario"])
| extend omnichannelAdditionalInfo = tostring((customDim["omnichannel.additional_info"]))
| extend scenario = tostring(customDim["powerplatform.analytics.scenario"])
| where scenario == "ConversationDiagnosticsScenario"
| where omnichannelAdditionalInfo contains "OverflowTrigger"
| project timestamp, conversationId, subscenario, omnichannelAdditionalInfo
Representatives who reject new assignments
Purpose: Diagnose customer service representatives (service representatives or representatives) who reject new assignments (by conversationId).
Query
let _endTime = datetime(2024-11-21T22:32:51Z);
let _startTime = datetime(2024-09-22T21:32:51Z);
Traces
| where timestamp >= _startTime and timestamp <= _endTime
| extend customDim = parse_json(customDimensions)
| extend conversationId = tostring(customDim["powerplatform.analytics.resource.id"]),
         subscenario = tostring(customDim["powerplatform.analytics.subscenario"]),
         agentId = tostring(customDim["omnichannel.target_agent.id"]) // Extract representative ID from custom dimensions
| extend scenario = tostring(customDim["powerplatform.analytics.scenario"])
| where scenario == "ConversationDiagnosticsScenario"
| where subscenario == "CSRRejected"
| summarize agentRejectionCount = count() by conversationId, agentId // Count rejections per representative per conversation
| summarize rejectionCount = sum(agentRejectionCount),
            agentRejectionDetails = make_list(pack('agentId', agentId, 'rejectionCount', agentRejectionCount))
    by conversationId // Aggregate results by conversation
| where rejectionCount > 1 // Filter conversations with more than one rejection
| project conversationId, rejectionCount, agentRejectionDetails
Purpose: Diagnose representatives who reject new assignments (by representatives).
Query
let _endTime = datetime(2024-11-21T22:33:55Z);
let _startTime = datetime(2024-09-22T21:33:55Z);
traces
| where timestamp >= _startTime and timestamp <= _endTime
| extend customDim = parse_json(customDimensions)
| extend agentId = tostring(customDim["omnichannel.target_agent.id"]), // Extract agent ID from custom dimensions
         subscenario = tostring(customDim["powerplatform.analytics.subscenario"])
| extend scenario = tostring(customDim["powerplatform.analytics.scenario"])
| where scenario == "ConversationDiagnosticsScenario"
| where subscenario == "CSRRejected"
| summarize totalRejections = count() by agentId // Count total rejections for each agent
| sort by totalRejections desc // Sort by rejection count in descending order
| top 20 by totalRejections // Select top 20 agents
| project agentId, totalRejections // Project relevant columns
Representative assignment took longer than two minutes
Purpose: Diagnose conversations where representative assignment took longer than two minutes.
Query
let _endTime = datetime(2024-11-21T22:35:56Z);
let _startTime = datetime(2024-09-22T21:35:56Z);
// Extract relevant subscenarios
let subscenarios = traces
| where timestamp >= _startTime and timestamp <= _endTime
| extend customDim = parse_json(customDimensions)
| extend conversationId = tostring(customDim["powerplatform.analytics.resource.id"]),
         subscenario = tostring(customDim["powerplatform.analytics.subscenario"])
| where subscenario in ("RouteToQueue", "CSRAccepted")
| project timestamp, conversationId, subscenario;
// Find the latest RTQ before each AgentAccept
let latestRTQsBeforeAgentAccept = subscenarios
| where subscenario == "RouteToQueue"
| join kind=inner (
    subscenarios
    | where subscenario == "CSRAccepted"
    | project agentAcceptTime = timestamp, conversationId
) on conversationId
| where timestamp < agentAcceptTime // Ensure RTQ is before AgentAccept
| summarize latestRTQTime = max(timestamp) by conversationId, agentAcceptTime;
// Calculate assignment time
latestRTQsBeforeAgentAccept
| extend assignmentTime = agentAcceptTime - latestRTQTime
| where assignmentTime > 2min
| project conversationId, assignmentTime
Use Azure Data Explorer dashboards with Application Insights queries
Apart from using Kusto queries directly within the Azure portal, you can use Azure Data Explorer Dashboards to visualize the results of these queries and create interactive, real-time reports. It's a powerful way to monitor and analyze the telemetry data from your Dynamics 365 Customer Service, Contact Center environment at a glance. We created a dashboard that you can directly import into your Azure Data Explorer environment.
The dashboard file and the instructions to link it to your ApplicationInsights subscription are in the GitHub repo at https://github.com/microsoft/Dynamics-365-FastTrack-Implementation-Assets/.
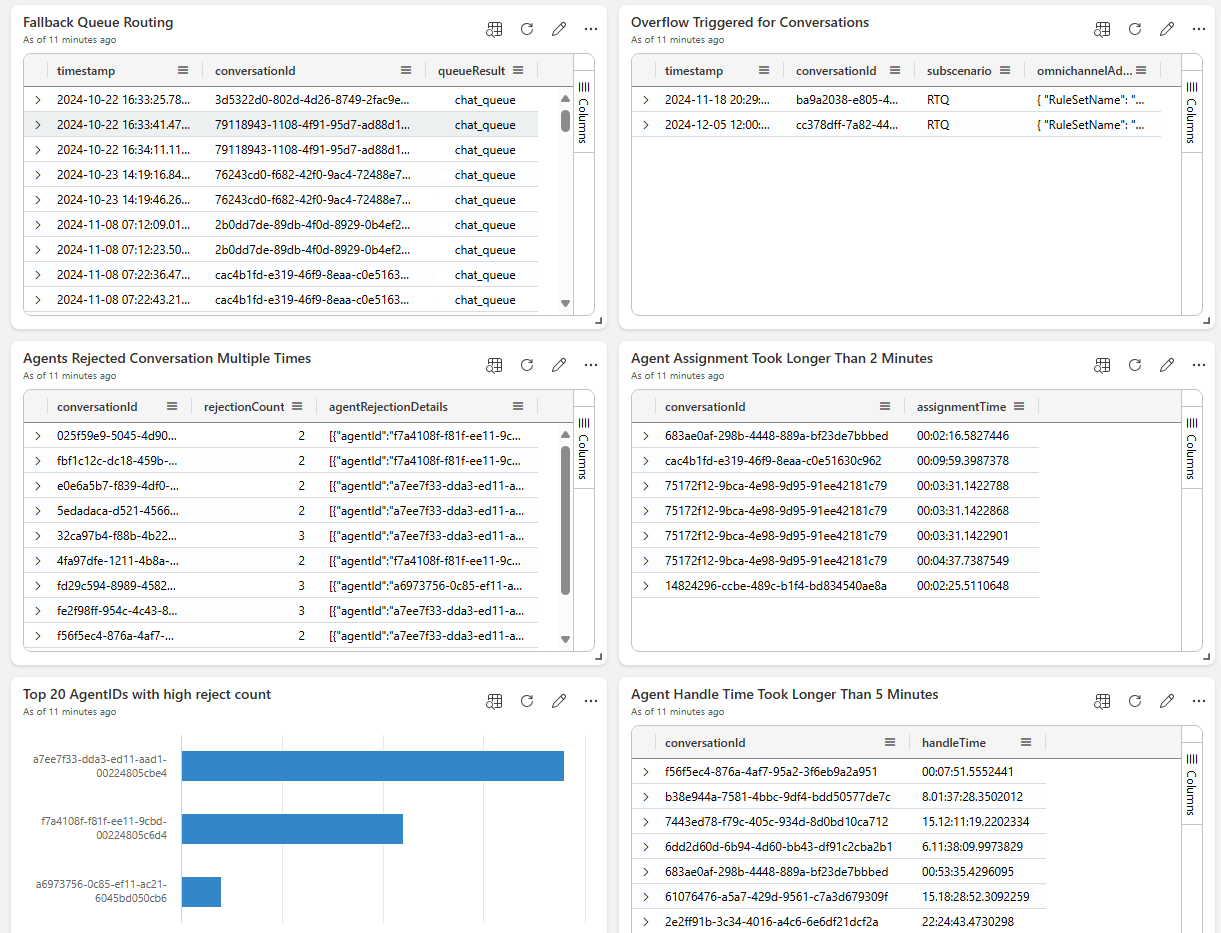
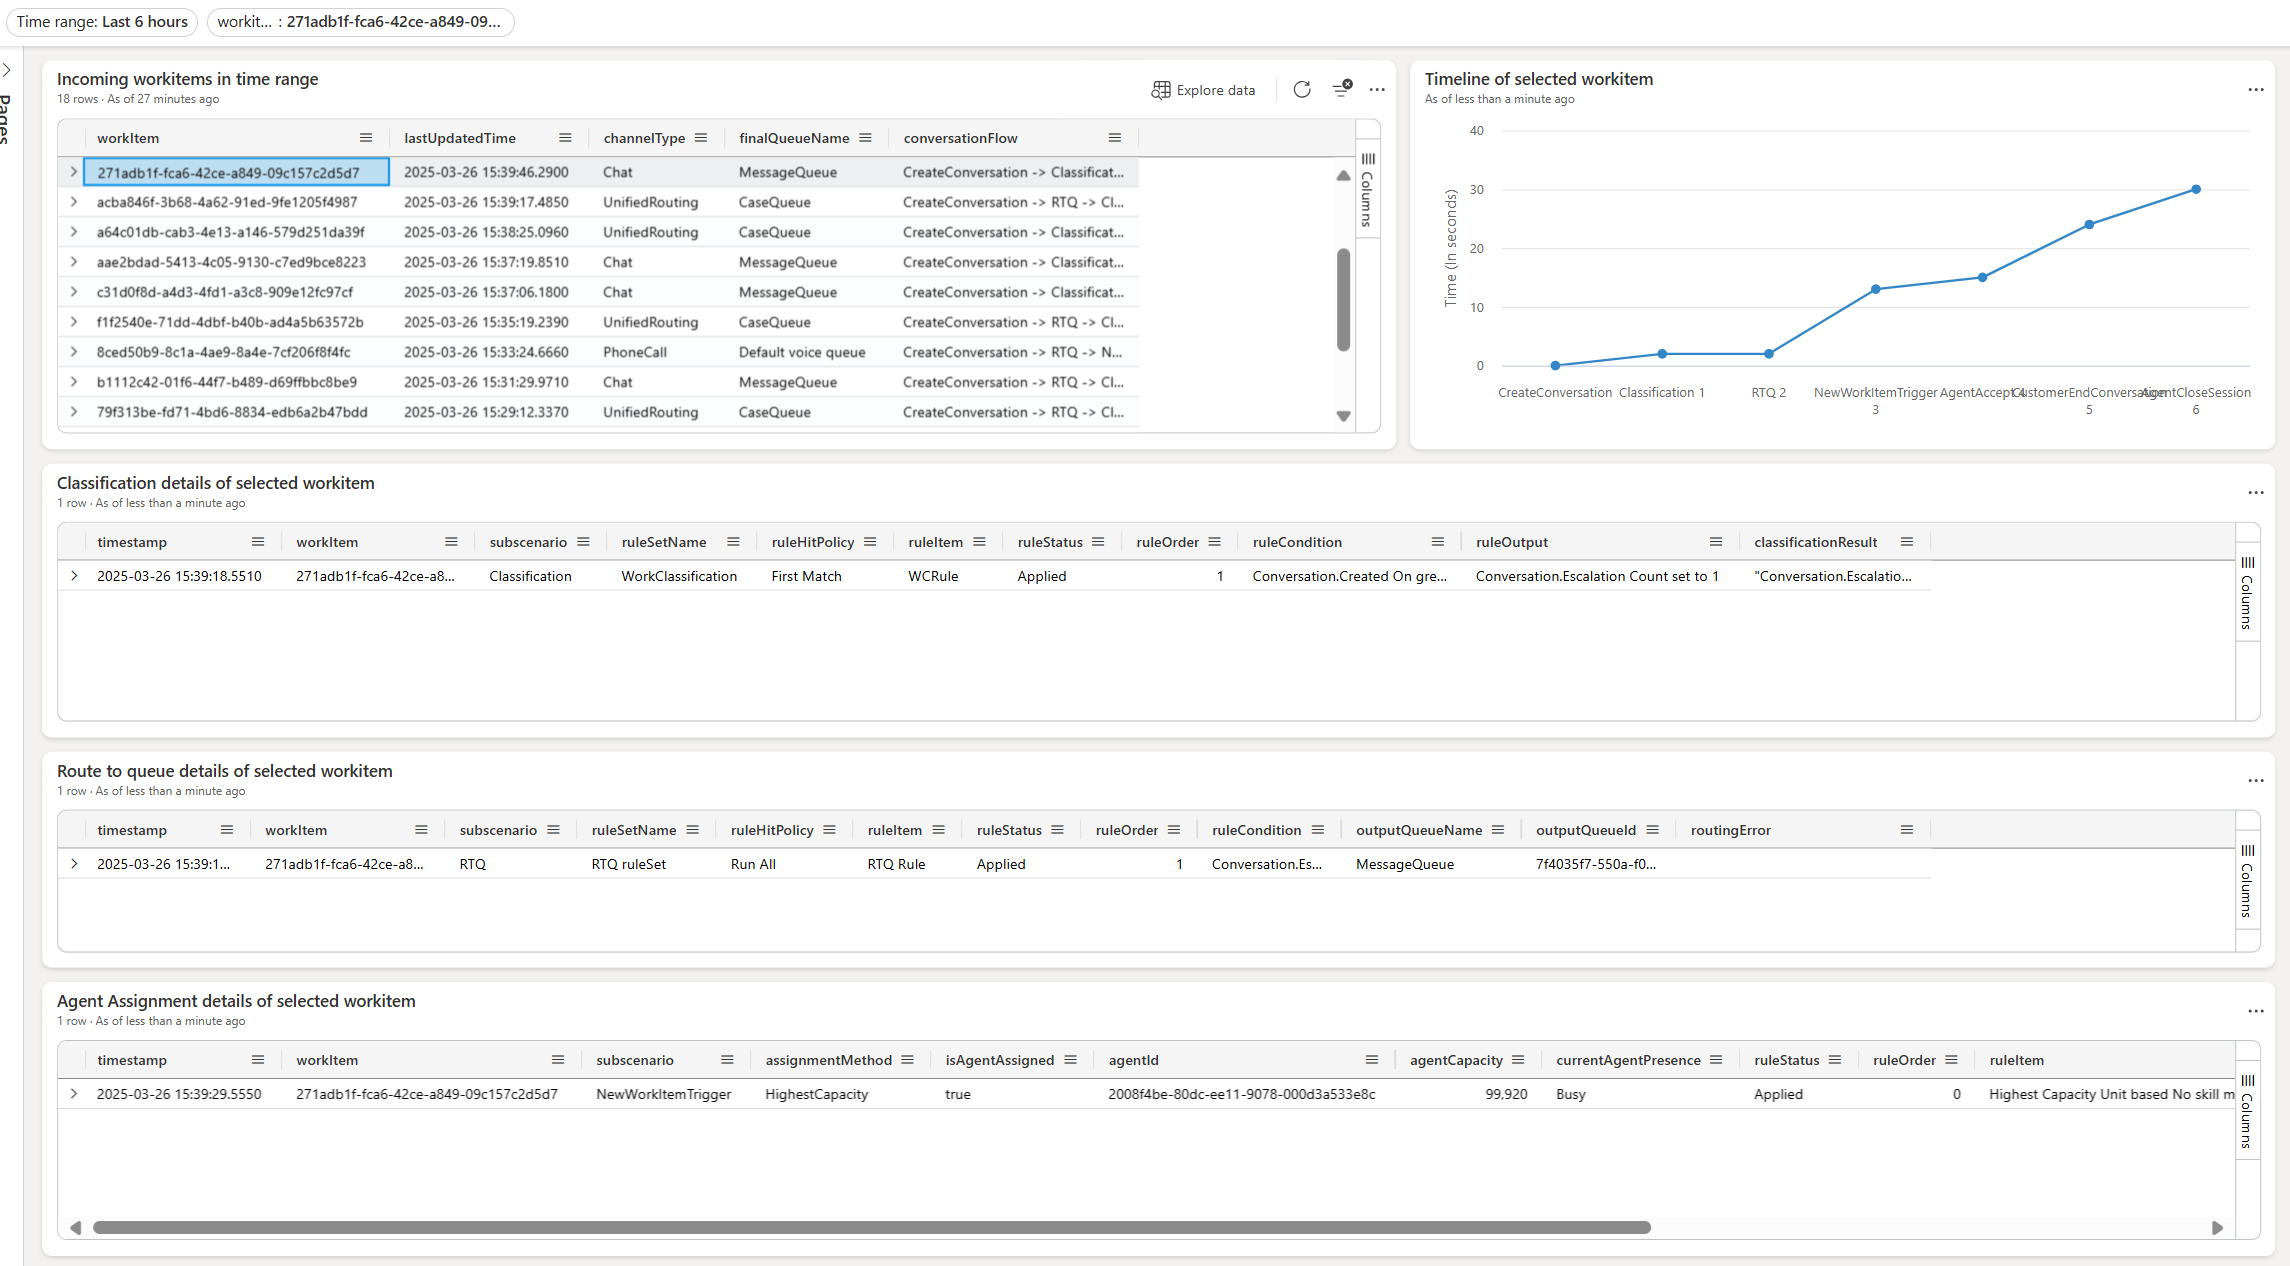
The dashboard includes the Conversation diagnostics page and the Unified routing diagnostics page as outlined in the following list:
- Conversation diagnostics page: This page displays diagnostics for a range of scenarios, including the following list:
- Conversation state flow for different conversation IDs.
- Fallback queue routing.
- Conversations that triggered overflow.
- Conversations rejected by multiple agents.
- Top Agent IDs with high reject count.
- Conversations where agent assignment took more than two minutes.
- Conversations where agent handle time was more than five minutes.
The following image illustrates the layout of the page based on sample data.
- Unified routing diagnostics page: This page displays diagnostics for a range of scenarios over time. You can select a work item, and then, through the context menu, you can set a cross-filter option for all tiles to load the diagnostics data for the work item.
The following image illustrates the layout of the page based on sample data.
After your dashboard is ready, you can do one of the following:
- Share the dashboard with anyone in your organization by granting them access to view or edit the dashboard in Azure Data Explorer.
- Alternatively, embed the dashboard into your own portal or website using the embedding features provided by Azure.
By integrating your analytics and insights data into an Azure Data Explorer dashboard, you can continuously monitor your Dynamics 365 Customer Service and Dynamics 365 Contact Center environments.
Related information
Configure conversation diagnostics
Subscenarios in conversation diagnostics

