Note
Access to this page requires authorization. You can try signing in or changing directories.
Access to this page requires authorization. You can try changing directories.
Resource monitoring involves the continuous measurement of resource utilization values, such as CPU, memory, and network usage. The Microsoft.Extensions.Diagnostics.ResourceMonitoring NuGet package offers a collection of APIs tailored for monitoring the resource utilization of your .NET applications.
The measurements can be consumed in two ways:
- Using .NET metrics.
- Using the IResourceMonitor interface. This interface is deprecated, so use the metrics-based approach instead. If you still need to listen to metric values manually, see Migrate to metrics-based resource monitoring.
Important
The Microsoft.Extensions.Diagnostics.ResourceMonitoring package assumes that the consumer will register logging providers with the Microsoft.Extensions.Logging package. If you don't register logging, the call to AddResourceMonitoring will throw an exception. Furthermore, you can enable internal library logging by configuring the Debug log level for the Microsoft.Extensions.Diagnostics.ResourceMonitoring category as per the guide.
Use .NET metrics of resource monitoring
To consume .NET metrics produced by the Resource monitoring library:
Add the
Microsoft.Extensions.Diagnostics.ResourceMonitoringpackage to your project.Add the resource monitoring services to your dependency injection container:
services.AddResourceMonitoring();Configure metrics collection using any OpenTelemetry-compatible metrics collector. For example:
services.AddOpenTelemetry()
    .WithMetrics(builder =>
    {
        builder.AddMeter("Microsoft.Extensions.Diagnostics.ResourceMonitoring");
        builder.AddConsoleExporter(); // Or any other metrics exporter
    });
Now you can observe the resource usage metrics through your configured metrics exporter.
For information about available metrics, see .NET extensions metrics: Microsoft.Extensions.Diagnostics.ResourceMonitoring.
For information about metrics collection, see Metrics collection.
Use the IResourceMonitor interface
Caution
The IResourceMonitor interface described in this section is deprecated and might be removed in future versions of .NET. Migrate to the metrics-based approach.
The IResourceMonitor interface furnishes methods for retrieving real-time information concerning process resource utilization. This interface supports the retrieval of data related to CPU and memory usage and is currently compatible with both Windows and Linux platforms.
Example resource monitoring usage
The following example demonstrates how to use the IResourceMonitor interface to retrieve information about the current process's CPU and memory usage.
using Microsoft.Extensions.DependencyInjection;
using Microsoft.Extensions.Diagnostics.ResourceMonitoring;
using Microsoft.Extensions.Hosting;
using Microsoft.Extensions.Logging;
using Spectre.Console;

var app = Host.CreateDefaultBuilder()
    .ConfigureServices(services =>
    {
        services.AddLogging(static builder => builder.AddConsole())
                .AddResourceMonitoring();
    })
    .Build();

var monitor = app.Services.GetRequiredService<IResourceMonitor>();
await app.StartAsync();
The preceding code:
- Instantiates a new ServiceCollection instance, chaining calls to the AddLogging and AddResourceMonitoring extension methods.
- Builds a new ServiceProvider instance from the
ServiceCollectioninstance. - Gets an instance of the IResourceMonitor interface from the
ServiceProviderinstance.
At this point, with the IResourceMonitor implementation you'll ask for resource utilization with the IResourceMonitor.GetUtilization method. The GetUtilization method returns a ResourceUtilization instance that contains the following information:
- ResourceUtilization.CpuUsedPercentage: CPU usage as a percentage.
- ResourceUtilization.MemoryUsedPercentage: Memory usage as a percentage.
- ResourceUtilization.MemoryUsedInBytes: Memory usage in bytes.
- ResourceUtilization.SystemResources: System resources.
- SystemResources.GuaranteedMemoryInBytes: Guaranteed memory in bytes.
- SystemResources.MaximumMemoryInBytes: Maximum memory in bytes.
- SystemResources.GuaranteedCpuUnits: Guaranteed CPU in units.
- SystemResources.MaximumCpuUnits: Maximum CPU in units.
Extend resource monitoring with Spectre.Console
Extending this example, you can leverage Spectre.Console, a well-regarded .NET library designed to simplify the development of visually appealing, cross-platform console applications. With Spectre, you'll be able to present resource utilization data in a tabular format. The following code illustrates the usage of the IResourceMonitor interface to access details regarding the CPU and memory usage of the current process, then presenting this data in a table:
await StartMonitoringAsync(monitor, token);

async Task StartMonitoringAsync(IResourceMonitor monitor, CancellationToken cancellationToken)
{
    var table = new Table()
        .Centered()
        .Title("Resource Monitoring", new Style(foreground: Color.Purple, decoration: Decoration.Bold))
        .Caption("Updates every three seconds. *GTD: Guaranteed ", new Style(decoration: Decoration.Dim))
        .RoundedBorder()
        .BorderColor(Color.Cyan1)
        .AddColumns(
        [
            new TableColumn("Time").Centered(),
            new TableColumn("CPU %").Centered(),
            new TableColumn("Memory %").Centered(),
            new TableColumn("Memory (bytes)").Centered(),
            new TableColumn("GTD / Max Memory (bytes)").Centered(),
            new TableColumn("GTD / Max CPU (units)").Centered(),
        ]);

    await AnsiConsole.Live(table)
        .StartAsync(async ctx =>
        {
            var window = TimeSpan.FromSeconds(3);
            while (cancellationToken.IsCancellationRequested is false)
            {
                var utilization = monitor.GetUtilization(window);
                var resources = utilization.SystemResources;

                table.AddRow(
                    [
                        $"{DateTime.Now:T}",
                        $"{utilization.CpuUsedPercentage:p}",
                        $"{utilization.MemoryUsedPercentage:p}",
                        $"{utilization.MemoryUsedInBytes:#,#}",
                        $"{resources.GuaranteedMemoryInBytes:#,#} / {resources.MaximumMemoryInBytes:#,#}",
                        $"{resources.GuaranteedCpuUnits} / {resources.MaximumCpuUnits}",
                    ]);

                ctx.Refresh();
                await Task.Delay(window);
            }
        });
}
The preceding code:
- Creates a cancellation token source and a cancellation token.
- Creates a new
Tableinstance, configuring it with a title, caption, and columns. - Performs a live render of the
Tableinstance, passing in a delegate that will be invoked every three seconds. - Gets the current resource utilization information from the
IResourceMonitorinstance and displays it as a new row in theTableinstance.
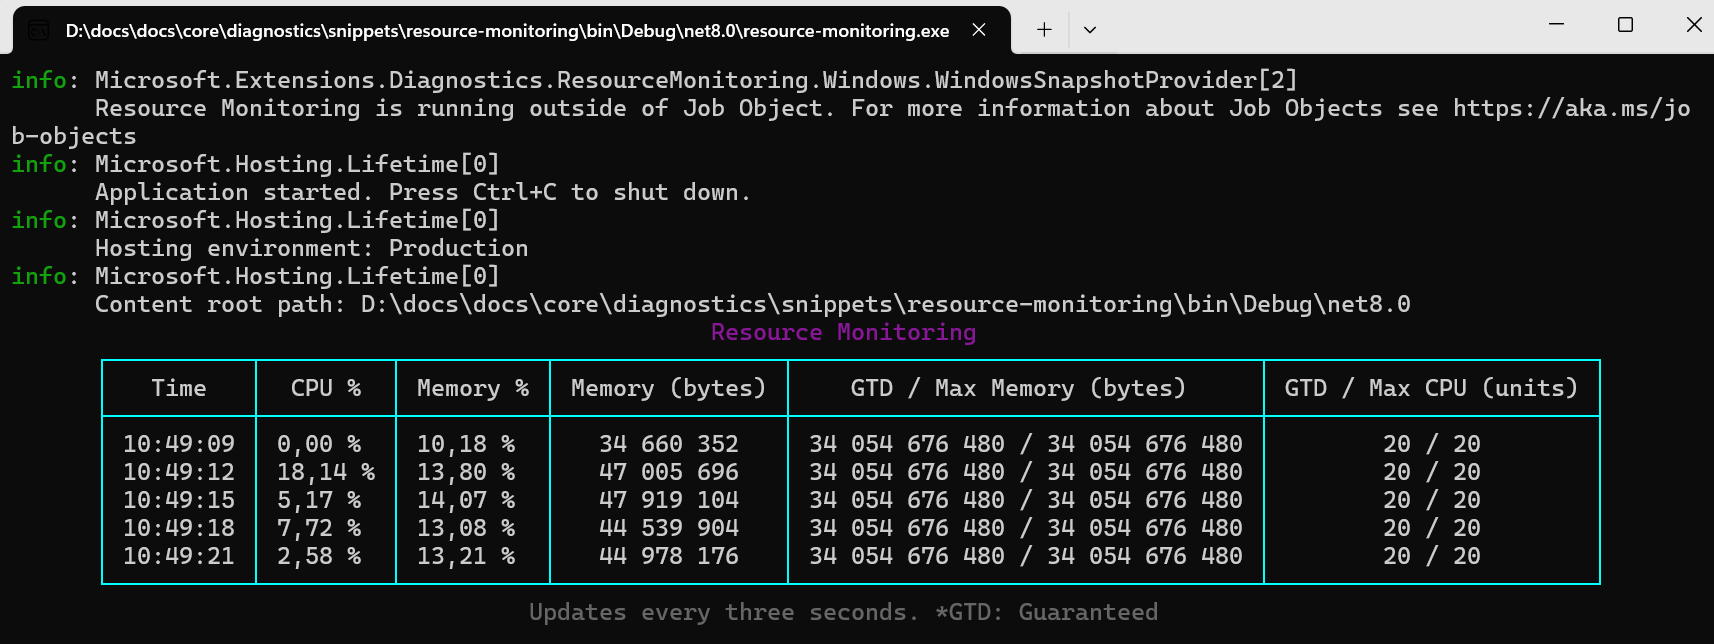
The following is an example of the output from the preceding code:
For the source code of this example, see the Resource monitoring sample.
Migrate to metrics-based resource monitoring
Since the IResourceMonitor interface is deprecated, migrate to the metrics-based approach. The Microsoft.Extensions.Diagnostics.ResourceMonitoring package provides several metrics that you can use instead, for instance:
container.cpu.limit.utilization: The CPU consumption share of the running containerized application relative to resource limit in range[0, 1]. Available for containerized apps on Linux and Windows.container.cpu.request.utilization: The CPU consumption share of the running containerized application relative to resource request in range[0, 1]. Available for containerized apps on Linux.container.memory.limit.utilization: The memory consumption share of the running containerized application relative to resource limit in range[0, 1]. Available for containerized apps on Linux and Windows.
For more information about the available metrics, see the Built-in metrics: Microsoft.Extensions.Diagnostics.ResourceMonitoring section.
Migration guide
This section provides a migration guide from the deprecated IResourceMonitor interface to the metrics-based approach. You only need this guide if you manually listen to resource utilization metrics in your application. In most cases, you don't need to listen to metrics manually because they're automatically collected and exported to back-ends using metrics exporters, as described in Use .NET metrics of Resource monitoring.
If you have code similar to the IResourceMonitor example usage, update it as follows:
await StartMonitoringAsync(logger, token);

async Task StartMonitoringAsync(ILogger logger, CancellationToken cancellationToken)
{
    var table = new Table()
        .Centered()
        .Title("Resource Monitoring", new Style(foreground: Color.Purple, decoration: Decoration.Bold))
        .RoundedBorder()
        .BorderColor(Color.Cyan1)
        .AddColumns(
        [
            new TableColumn("Time").Centered(),
            new TableColumn("CPU limit %").Centered(),
            new TableColumn("CPU request %").Centered(),
            new TableColumn("Memory limit %").Centered(),
        ]);

    const string rmMeterName = "Microsoft.Extensions.Diagnostics.ResourceMonitoring";
    using var meter = new Meter(rmMeterName);
    using var meterListener = new MeterListener
    {
        InstrumentPublished = (instrument, listener) =>
        {
            if (instrument.Meter.Name == rmMeterName &&
                instrument.Name.StartsWith("container."))
            {
                listener.EnableMeasurementEvents(instrument, null);
            }
        }
    };

    var samples = new Dictionary<string, double>();
    meterListener.SetMeasurementEventCallback<double>((instrument, value, _, _) =>
    {
        if (instrument.Meter.Name == rmMeterName)
        {
            samples[instrument.Name] = value;
        }
    });
    meterListener.Start();

    await AnsiConsole.Live(table)
        .StartAsync(async ctx =>
        {
            var window = TimeSpan.FromSeconds(5);
            while (cancellationToken.IsCancellationRequested is false)
            {
                meterListener.RecordObservableInstruments();

                table.AddRow(
                    [
                        $"{DateTime.Now:T}",
                        $"{samples["container.cpu.limit.utilization"]:p}",
                        $"{samples["container.cpu.request.utilization"]:p}",
                        $"{samples["container.memory.limit.utilization"]:p}",
                    ]);

                ctx.Refresh();

                await Task.Delay(window);
            }
        });
}
The preceding code:
- Creates a cancellation token source and a cancellation token.
- Creates a new
Tableinstance, configuring it with a title, caption, and columns. - Performs a live render of the
Tableinstance, passing in a delegate that will be invoked every three seconds. - Gets the current resource utilization information using a callback set with the
SetMeasurementEventCallbackmethod and displays it as a new row in theTableinstance.
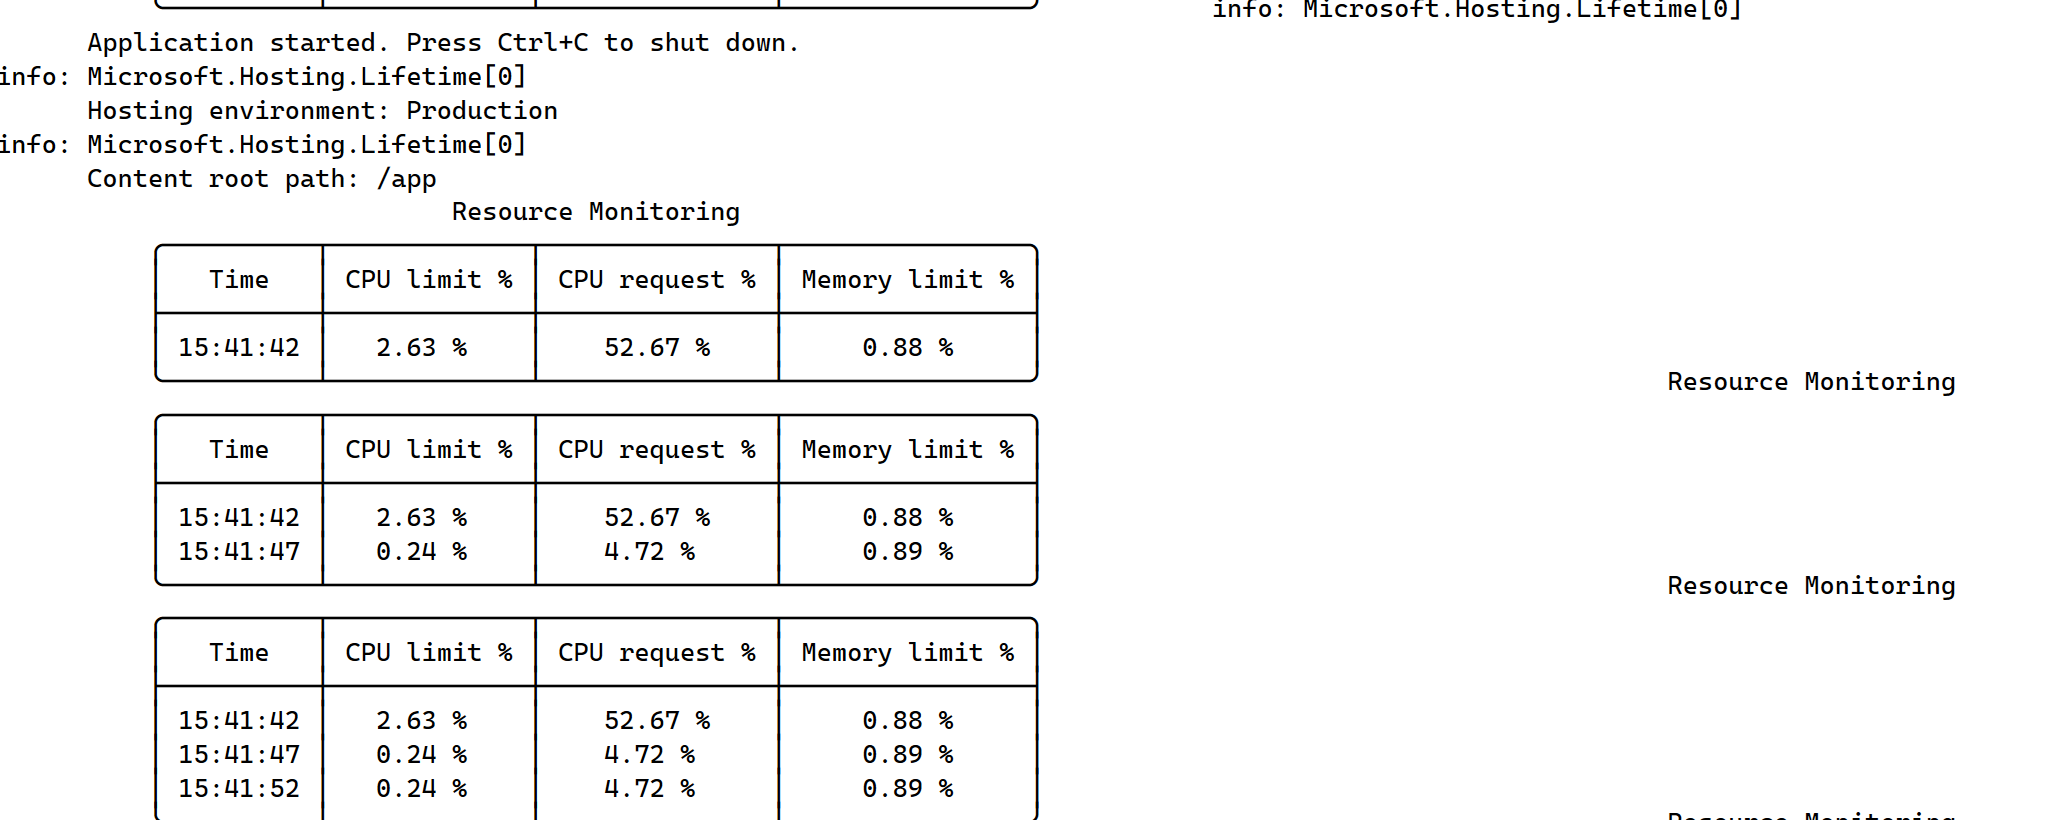
The following is an example of the output from the preceding code:
For the complete source code of this example, see the Resource monitoring with manual metrics sample.
Kubernetes probes
In addition to resource monitoring, apps that exist within a Kubernetes cluster report their health through diagnostic probes. The Microsoft.Extensions.Diagnostics.Probes NuGet package provides support for Kubernetes probes. It externalizes various health checks that align with various Kubernetes probes, for example:
- Liveness
- Readiness
- Startup
The library communicates the app's current health to a Kubernetes hosting environment. If a process reports as being unhealthy, Kubernetes doesn't send it any traffic, providing the process time to recover or terminate.
To add support for Kubernetes probes, add a package reference to Microsoft.Extensions.Diagnostics.Probes. On an IServiceCollection instance, call AddKubernetesProbes.


