Note
Access to this page requires authorization. You can try signing in or changing directories.
Access to this page requires authorization. You can try changing directories.
Logs for your virtual network data gateway are available for download on the Manage connections and gateways page. Four folders are downloaded:
- System Counters
- Mashup Logs
- Query Execution Report
- Resource Consumption
Notes:
- You must be an admin on the virtual network data gateway to download logs. Check the manage users option to determine if you're an admin.
- Retention of logs: MashupLogs are kept for the past 48 hours. The SystemCounters, QueryExecutionReport, and Resource Consumption logs are kept for the past 29 days. Currently, customers don't have the ability to change how long the logs are retained during the retention period.
- The gateway must be online to provide logs. Check the status of the virtual network by selecting the icon in the Status column.
- The download isn't available if the Fabric private link is enabled in your tenant.
- If you don’t see the download, check to make sure pop-ups aren't disabled on your browser.
- This feature isn't available in certain regions, including Mexico central, Spain central, Qatar central, China regions, and US Gov Virginia regions.
- Mashup logs are in JSONL format, while SystemCounters and QueryExecutionReport are in Parquet format.
How to download logs
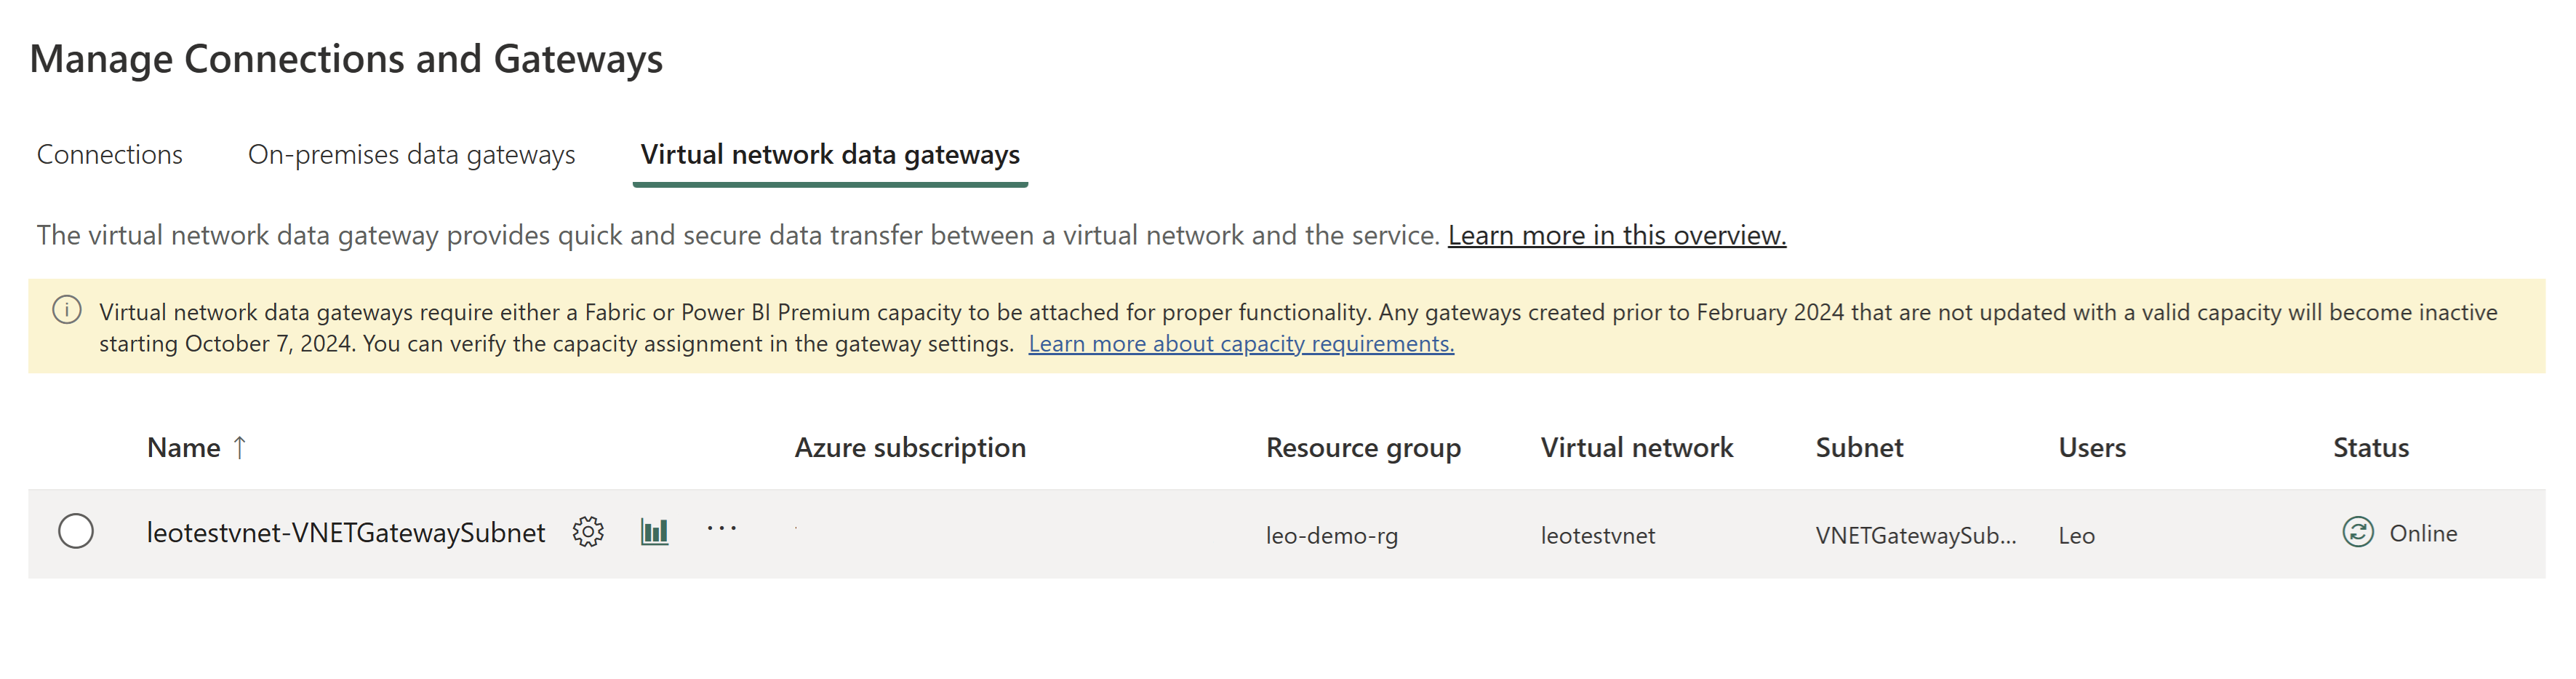
From the page header in the Power BI service, select the Settings icon and then select Manage connections and gateways.
Select the Virtual network data gateways tab.
Find your virtual network data gateway and, in the same row, select the download icon.
In the pop-up window, you can choose the specific log category you need or select all available logs. Additionally, you can pick a predefined time range or customize the time range to suit your needs.
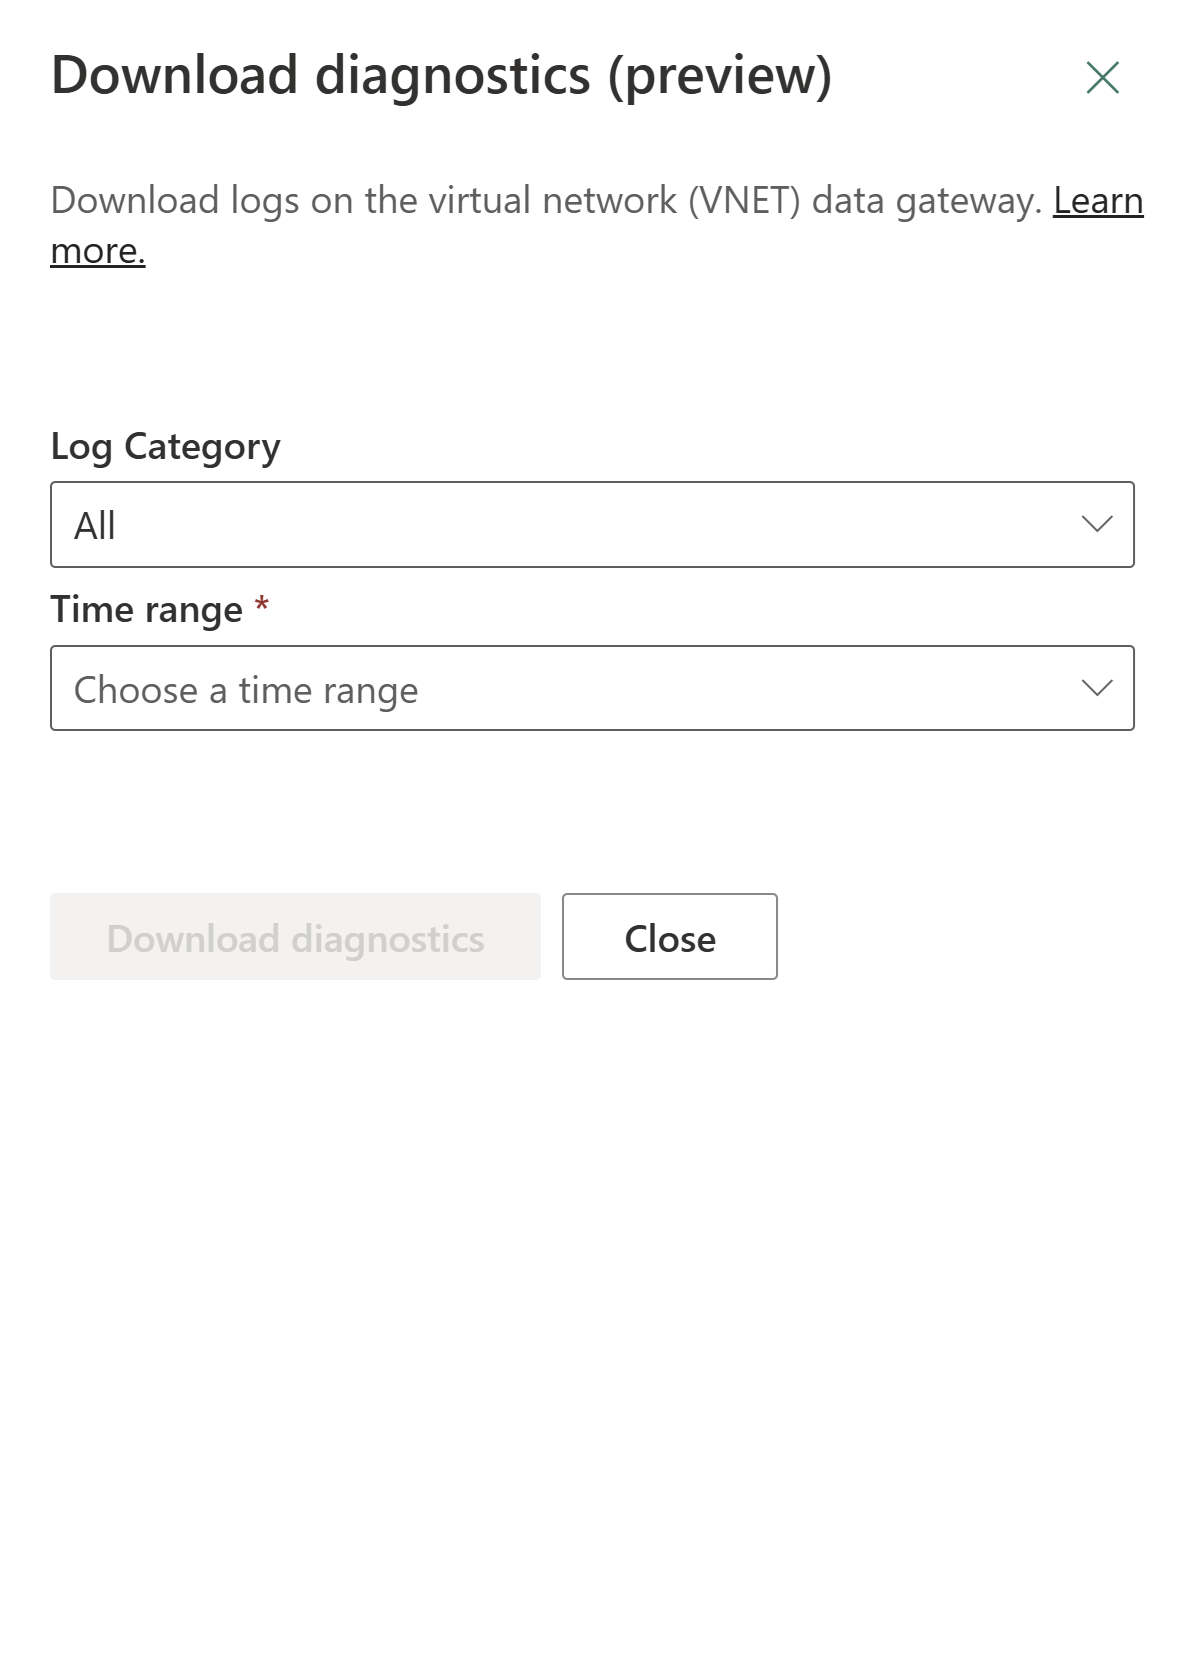
Select Download diagnostics button, and view logs in the downloaded folder.

SystemCounters
| Attribute | Description |
|---|---|
| Timestamp | The time the counter was emitted. |
| ID | Unique identifier for the container on which your gateway is currently running. |
| CommittedMemoryinMB | Memory used out of the total 8-GB RAM reserved per VNet. |
| CPUUsagePercentage | CPU used. |
| MemoryAvailableinMB | Memory available. |
MashupLogs
| Attribute | Description |
|---|---|
| Start | Start of action. |
| Action | Action name. |
| ProductVersion | Version of Mashup. |
| ActivityId | Activity identifier. |
| CorrelationId | Correlation identifier. |
| Process | Process name. |
| Pid | Process identifier. |
| Tid | Thread identifier. |
| Duration | Duration of action. |
QueryExecutionReport
| Attribute | Description |
|---|---|
| ID | Gateway object identifier. |
| Timestamp | Start of the query execution. |
| QueryId | Query identifier. |
| InstanceId | Identifier for the container on which your gateway is currently running. |
| RequestId | Request identifier. |
| QueryType | Query type, that is, DirectQuery or Data refresh operations including semantic model and dataflow refreshes. |
| ConnectionPath | Data source kinds and paths. |
| Status | Indicates whether the query failed or succeeded. |
| StartTime | Start of the query execution. |
| DurationMS | Duration of the query in milliseconds. |
| ExecutionStartTime | Start of the query execution. |
| ExecutionDurationMS | Duration of the query in milliseconds. |
| DataReadingAndSerializationStartTime | Start of data serialization. |
| DataReadingAndSerializationDurationMS | Duration of the data serialization. |
| StreamingDurationMS | Duration of the data streaming. |
Resource Consumption
| Attribute | Description |
|---|---|
| CapacityId | ID of the capacity that's charged. |
| CapacityUnitSeconds | Capacity consumption emitted, as CapacityUnitSeconds. |
| GatewayId | Gateway object identifier. |
| GatewayName | Name of the gateway. |
| Id | Log identifier. |
| Timestamp | The time consumption was emitted. |