Note
Access to this page requires authorization. You can try signing in or changing directories.
Access to this page requires authorization. You can try changing directories.
The Invoicing and chargeback report provides a general overview of billed costs and facilitates comparing cost and usage details with the charges on your invoice.
Power BI reports are provided as template (.PBIT) files. Template files are not preconfigured and do not include sample data. When you first open a Power BI template, you will be prompted to specify report parameters, then authenticate with each data source to view your data. To access visuals and queries without loading data, select Edit in the Load menu button.
This article contains images showing example data. Any price data is for test purposes only.
Working with this report
This report includes the following filters on each page:
- Charge period (date range)
- Subscription and resource group
- Region
- Commitment (for example, reservation and savings plan)
- Service (for example, Virtual machines and SQL database)
- Currency
A few common KPIs you fill find in this report are:
- Billed cost shows the billed cost for the period based on what you should see on your Microsoft Cloud invoice.
The currency must be single-select to ensure costs in different currencies aren't mixed.
Get started
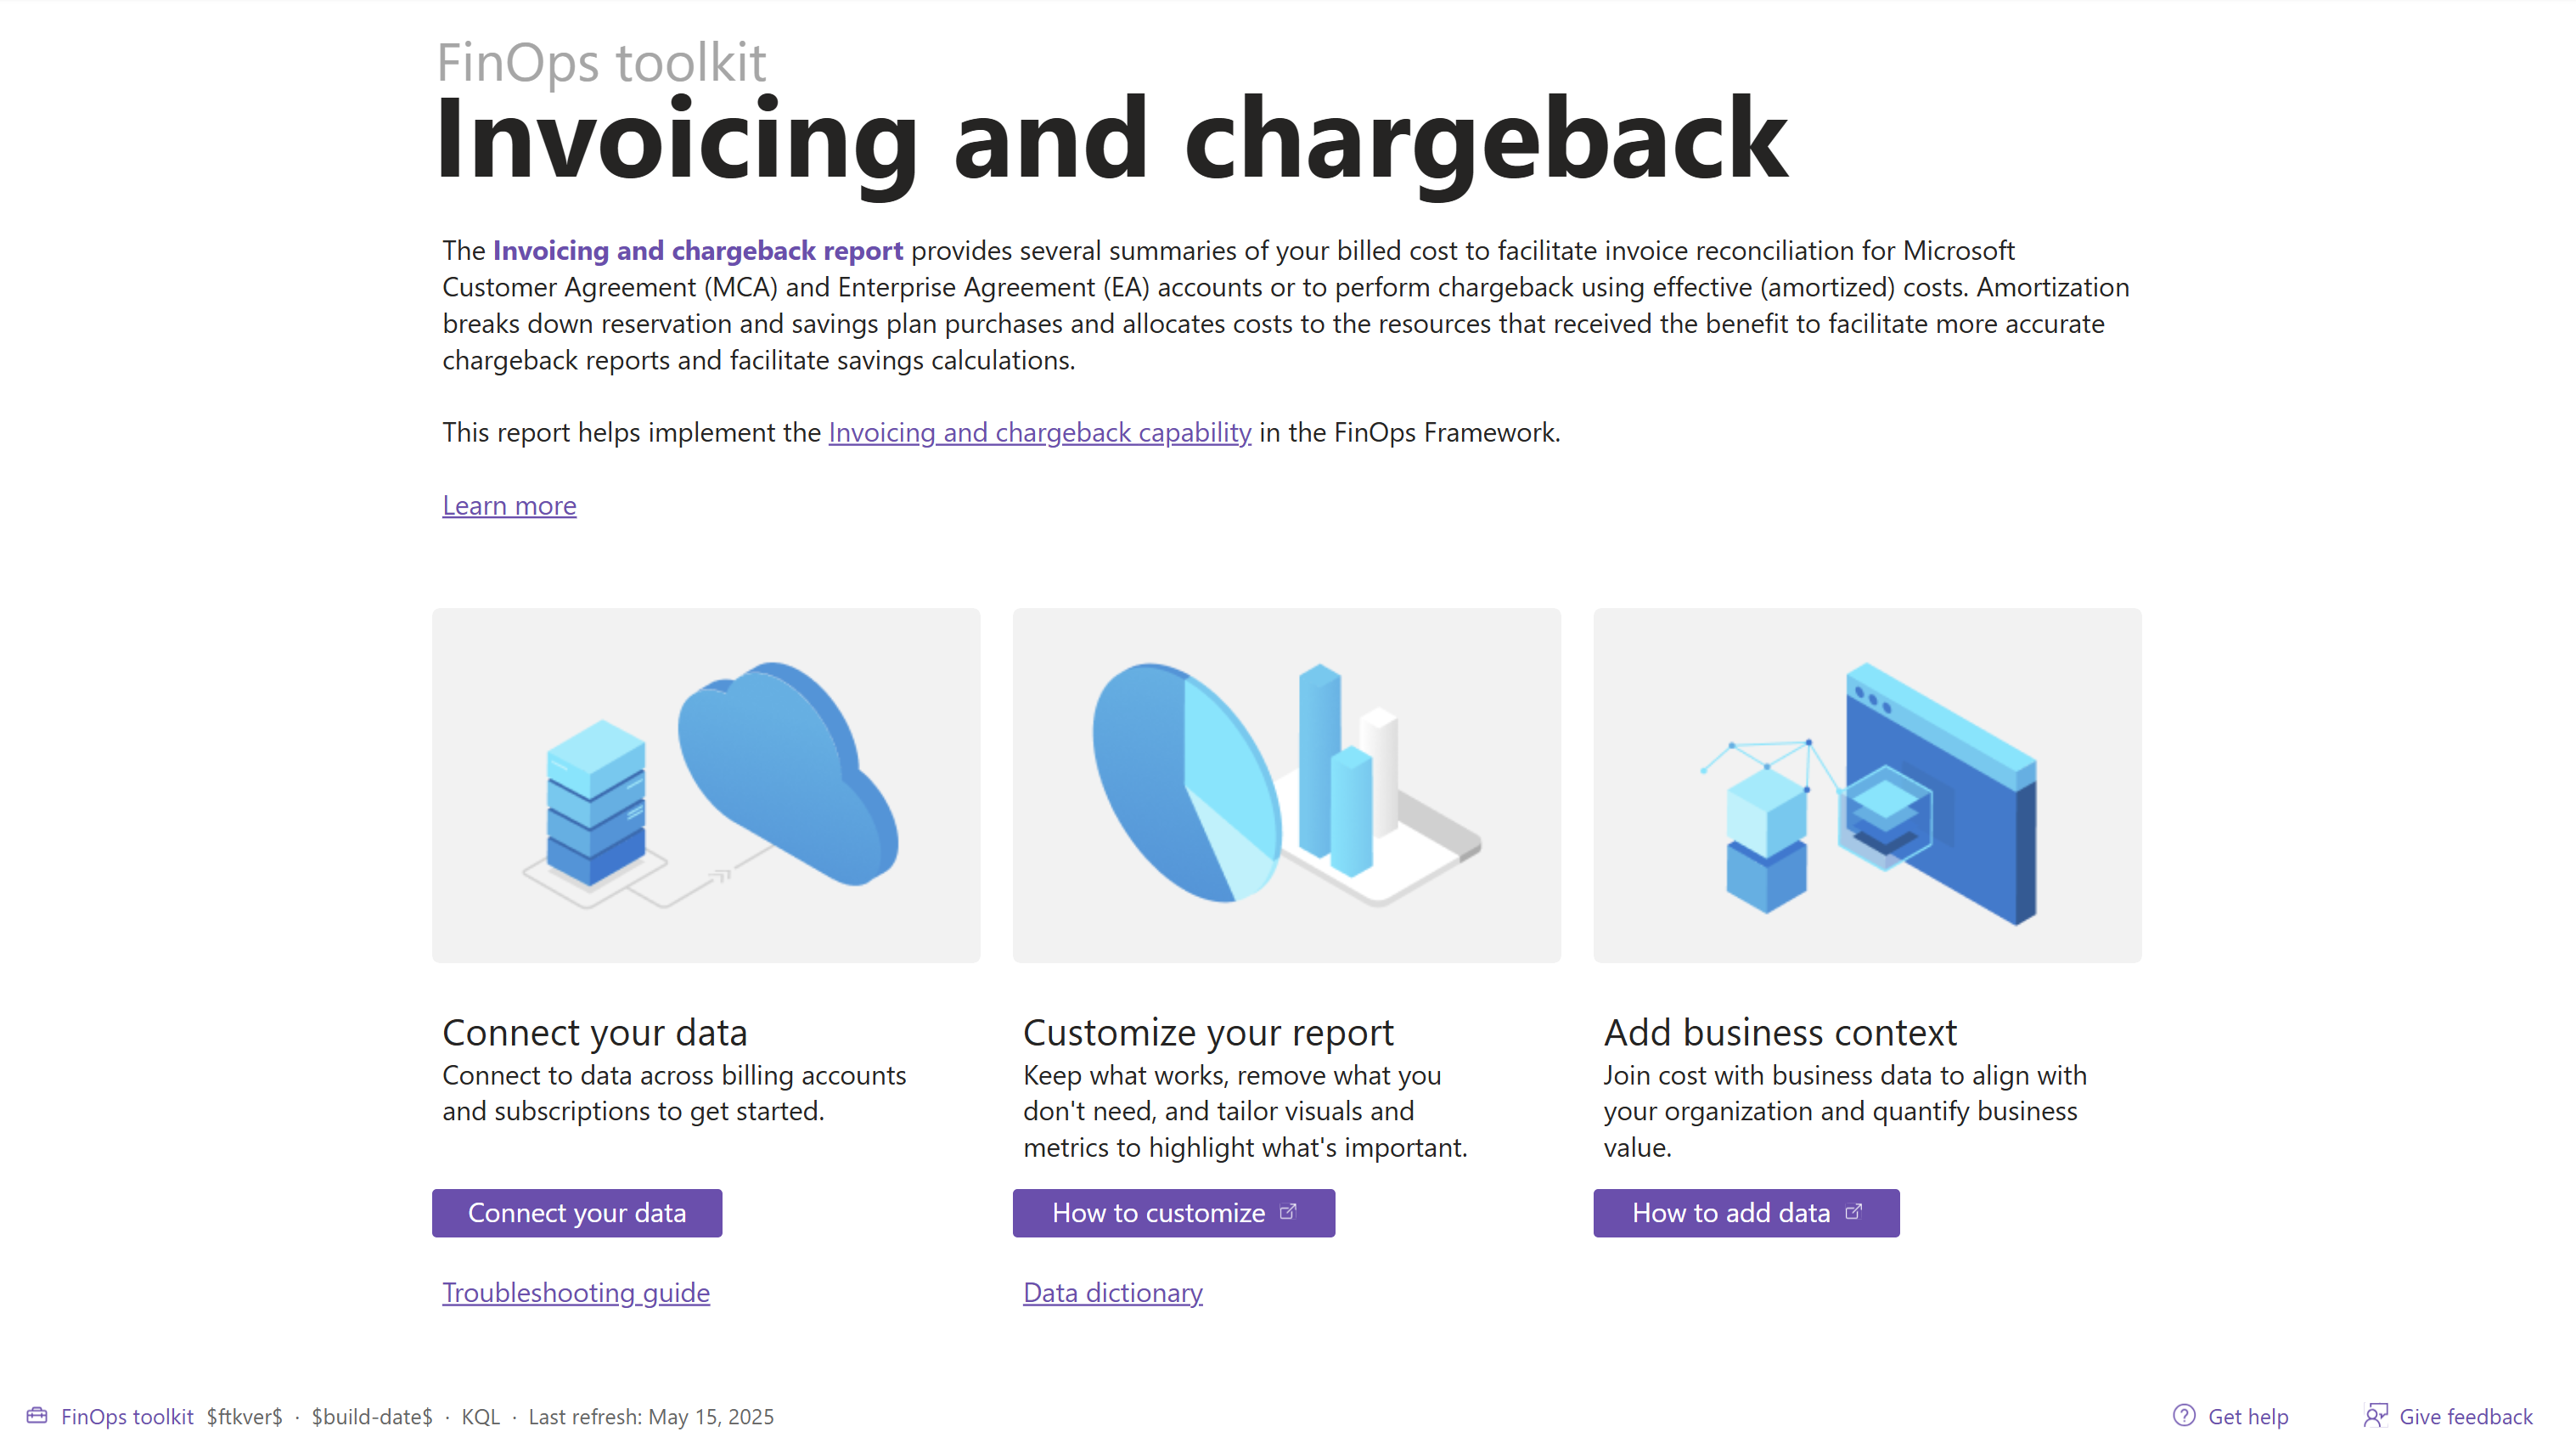
The Get started page includes a basic introduction to the report with more links to learn more.
For instructions on how to connect this report to your data, including details about supported parameters, select the Connect your data button. Hold Ctrl when clicking the button in Power BI Desktop. If you need assistance, select the Get help button.
Summary
The Summary page shows the monthly billed cost for the selected period. This page is helpful in determining what your monthly invoice trends are.
Services
The Services page offers a breakdown of cost by service. This page is useful for determining how service usage changes over time at a high level - usually across multiple subscriptions or the entire billing account.
The page uses the standard layout with a breakdown of services organized by category in the chart and table.
Chargeback
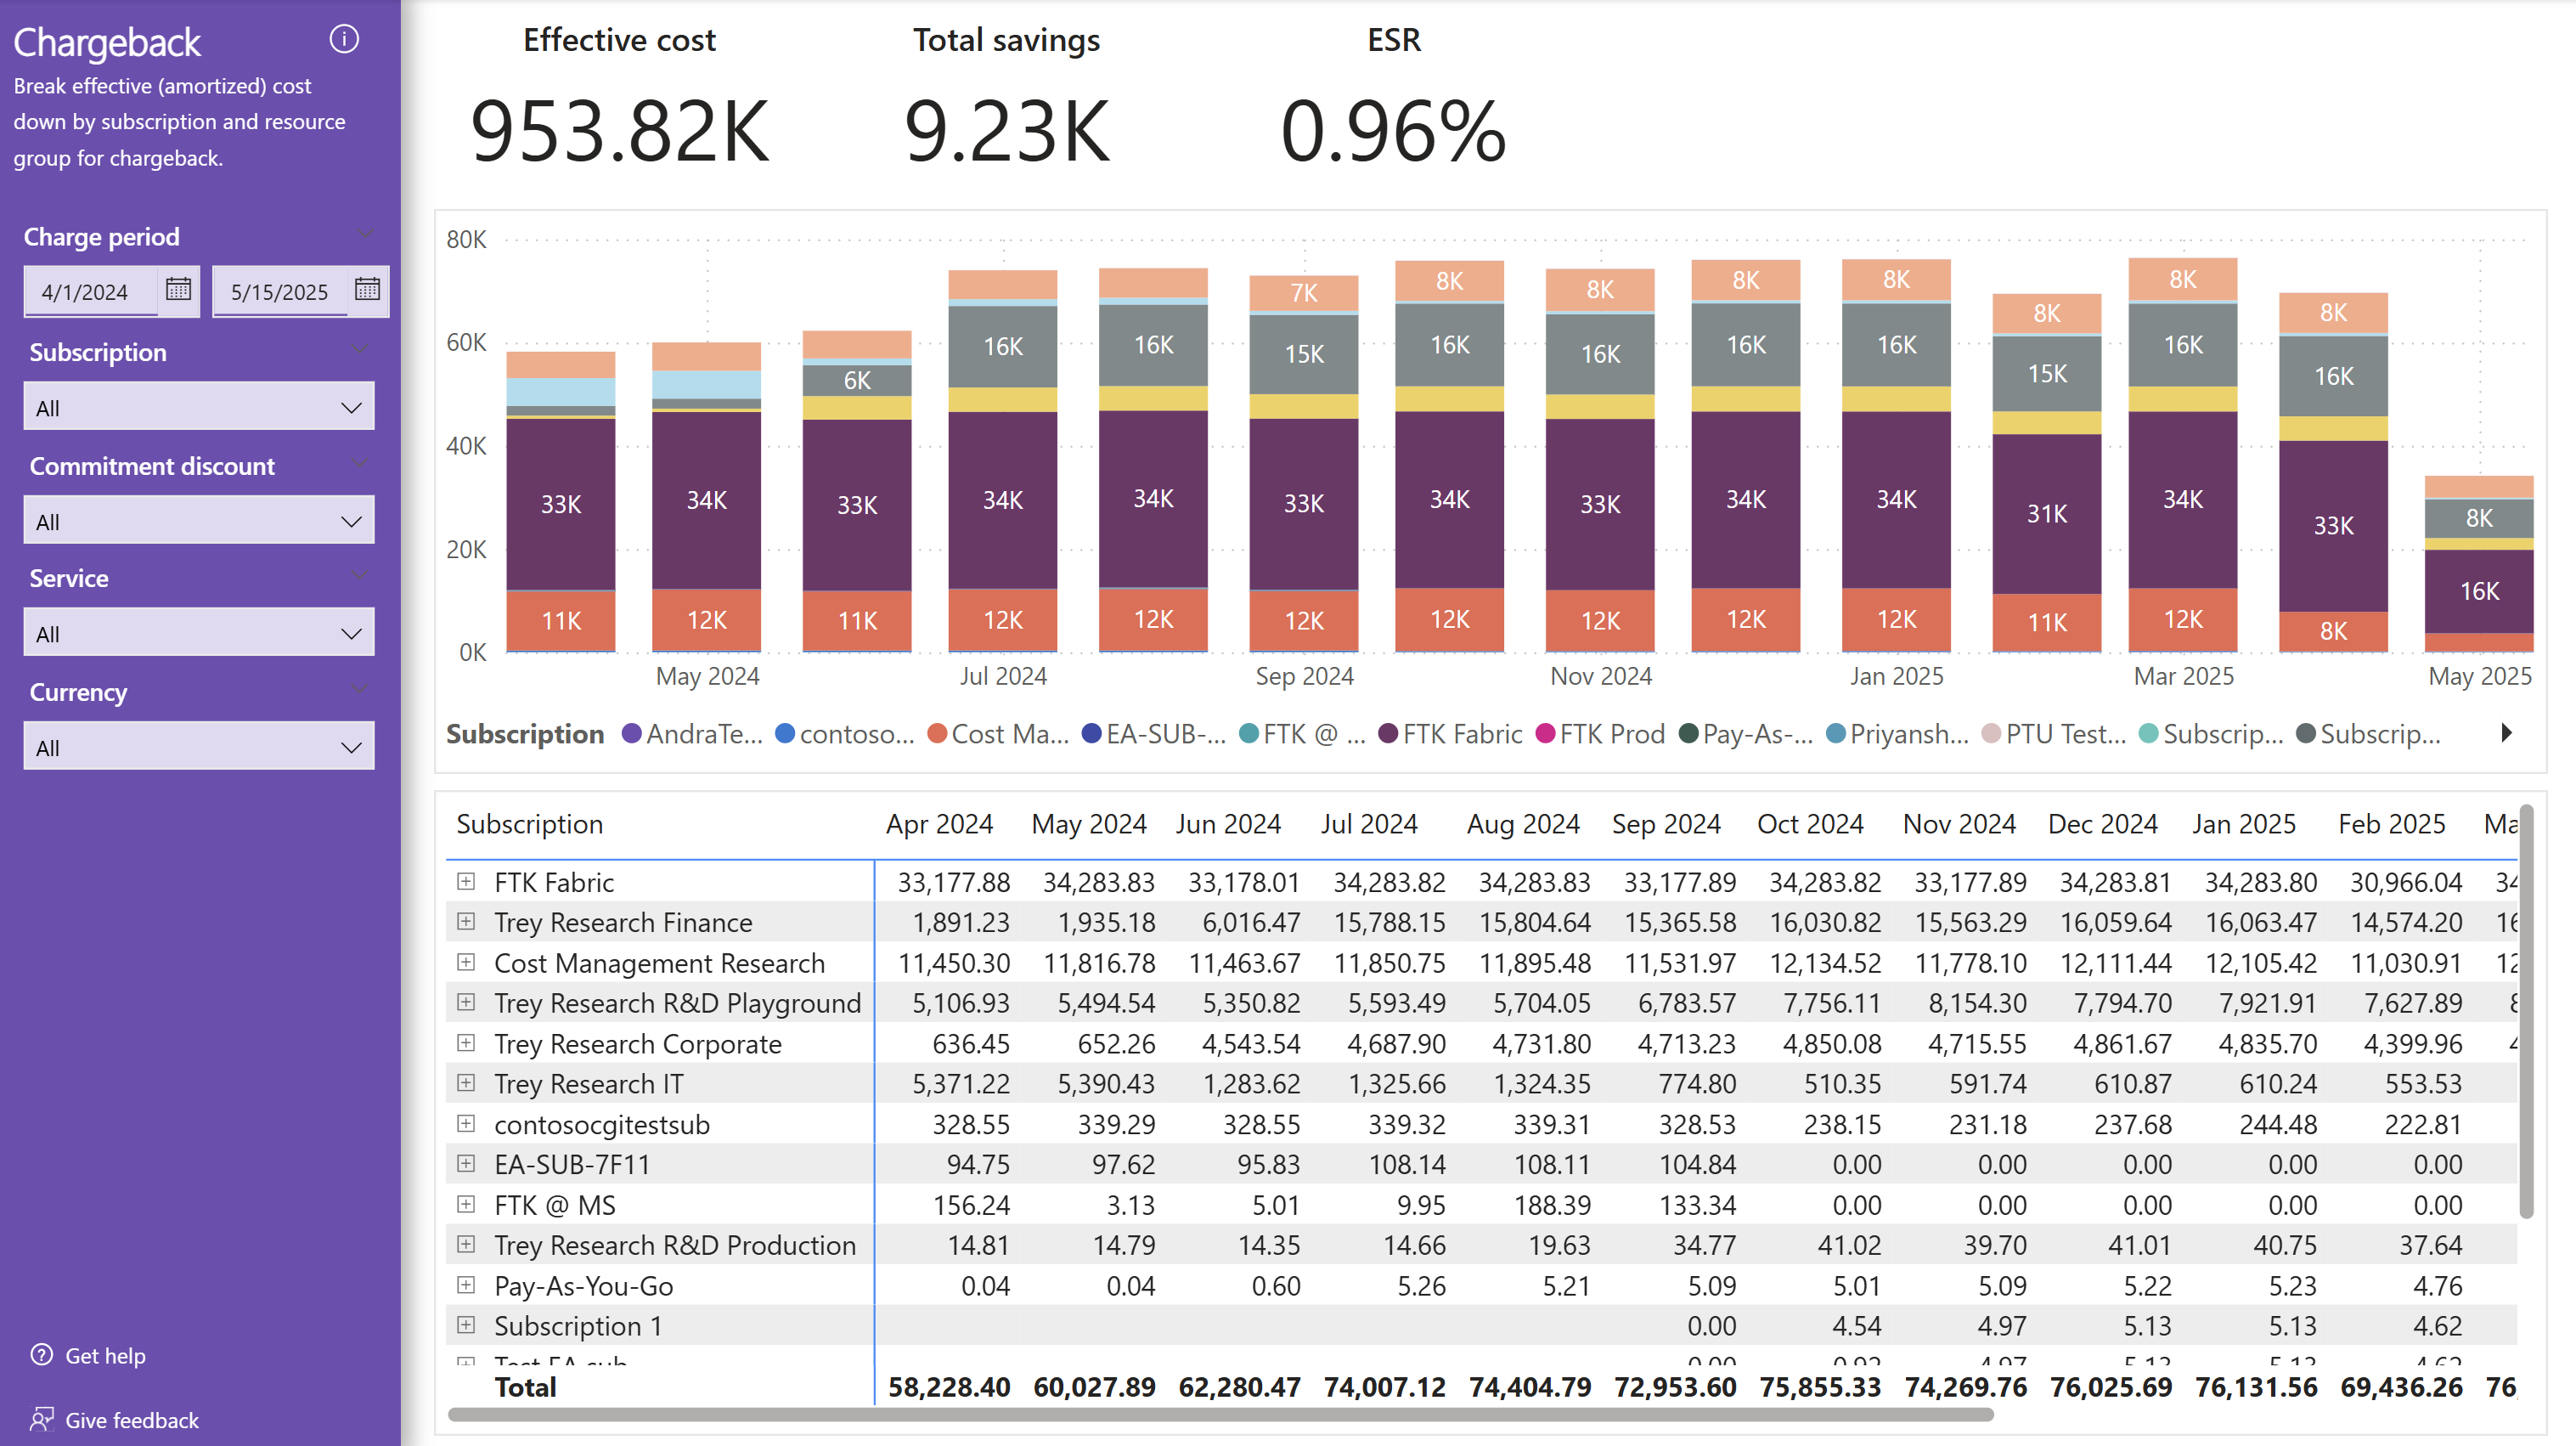
The Chargeback page helps facilitate chargeback at a subscription or resource group level. The chart shows effective (amortized) cost over time for each subscription while the table shows a hierarchical breakdown of costs by subscription and resource group.
This page uses effective (amortized) cost rather than billed cost, which is used on other pages in this report. You may see different monthly numbers on this page compared to others because of the different ways effective and billed costs are calculated.
Chargeback customization tips
- Change the columns in the chart and table based on your chargeback needs.
- Create custom columns in the Costs table that extract tags for cost allocation, then add them as columns into the visual for reporting.
- Integrate external data for more allocation options.
Invoice recon (MCA)
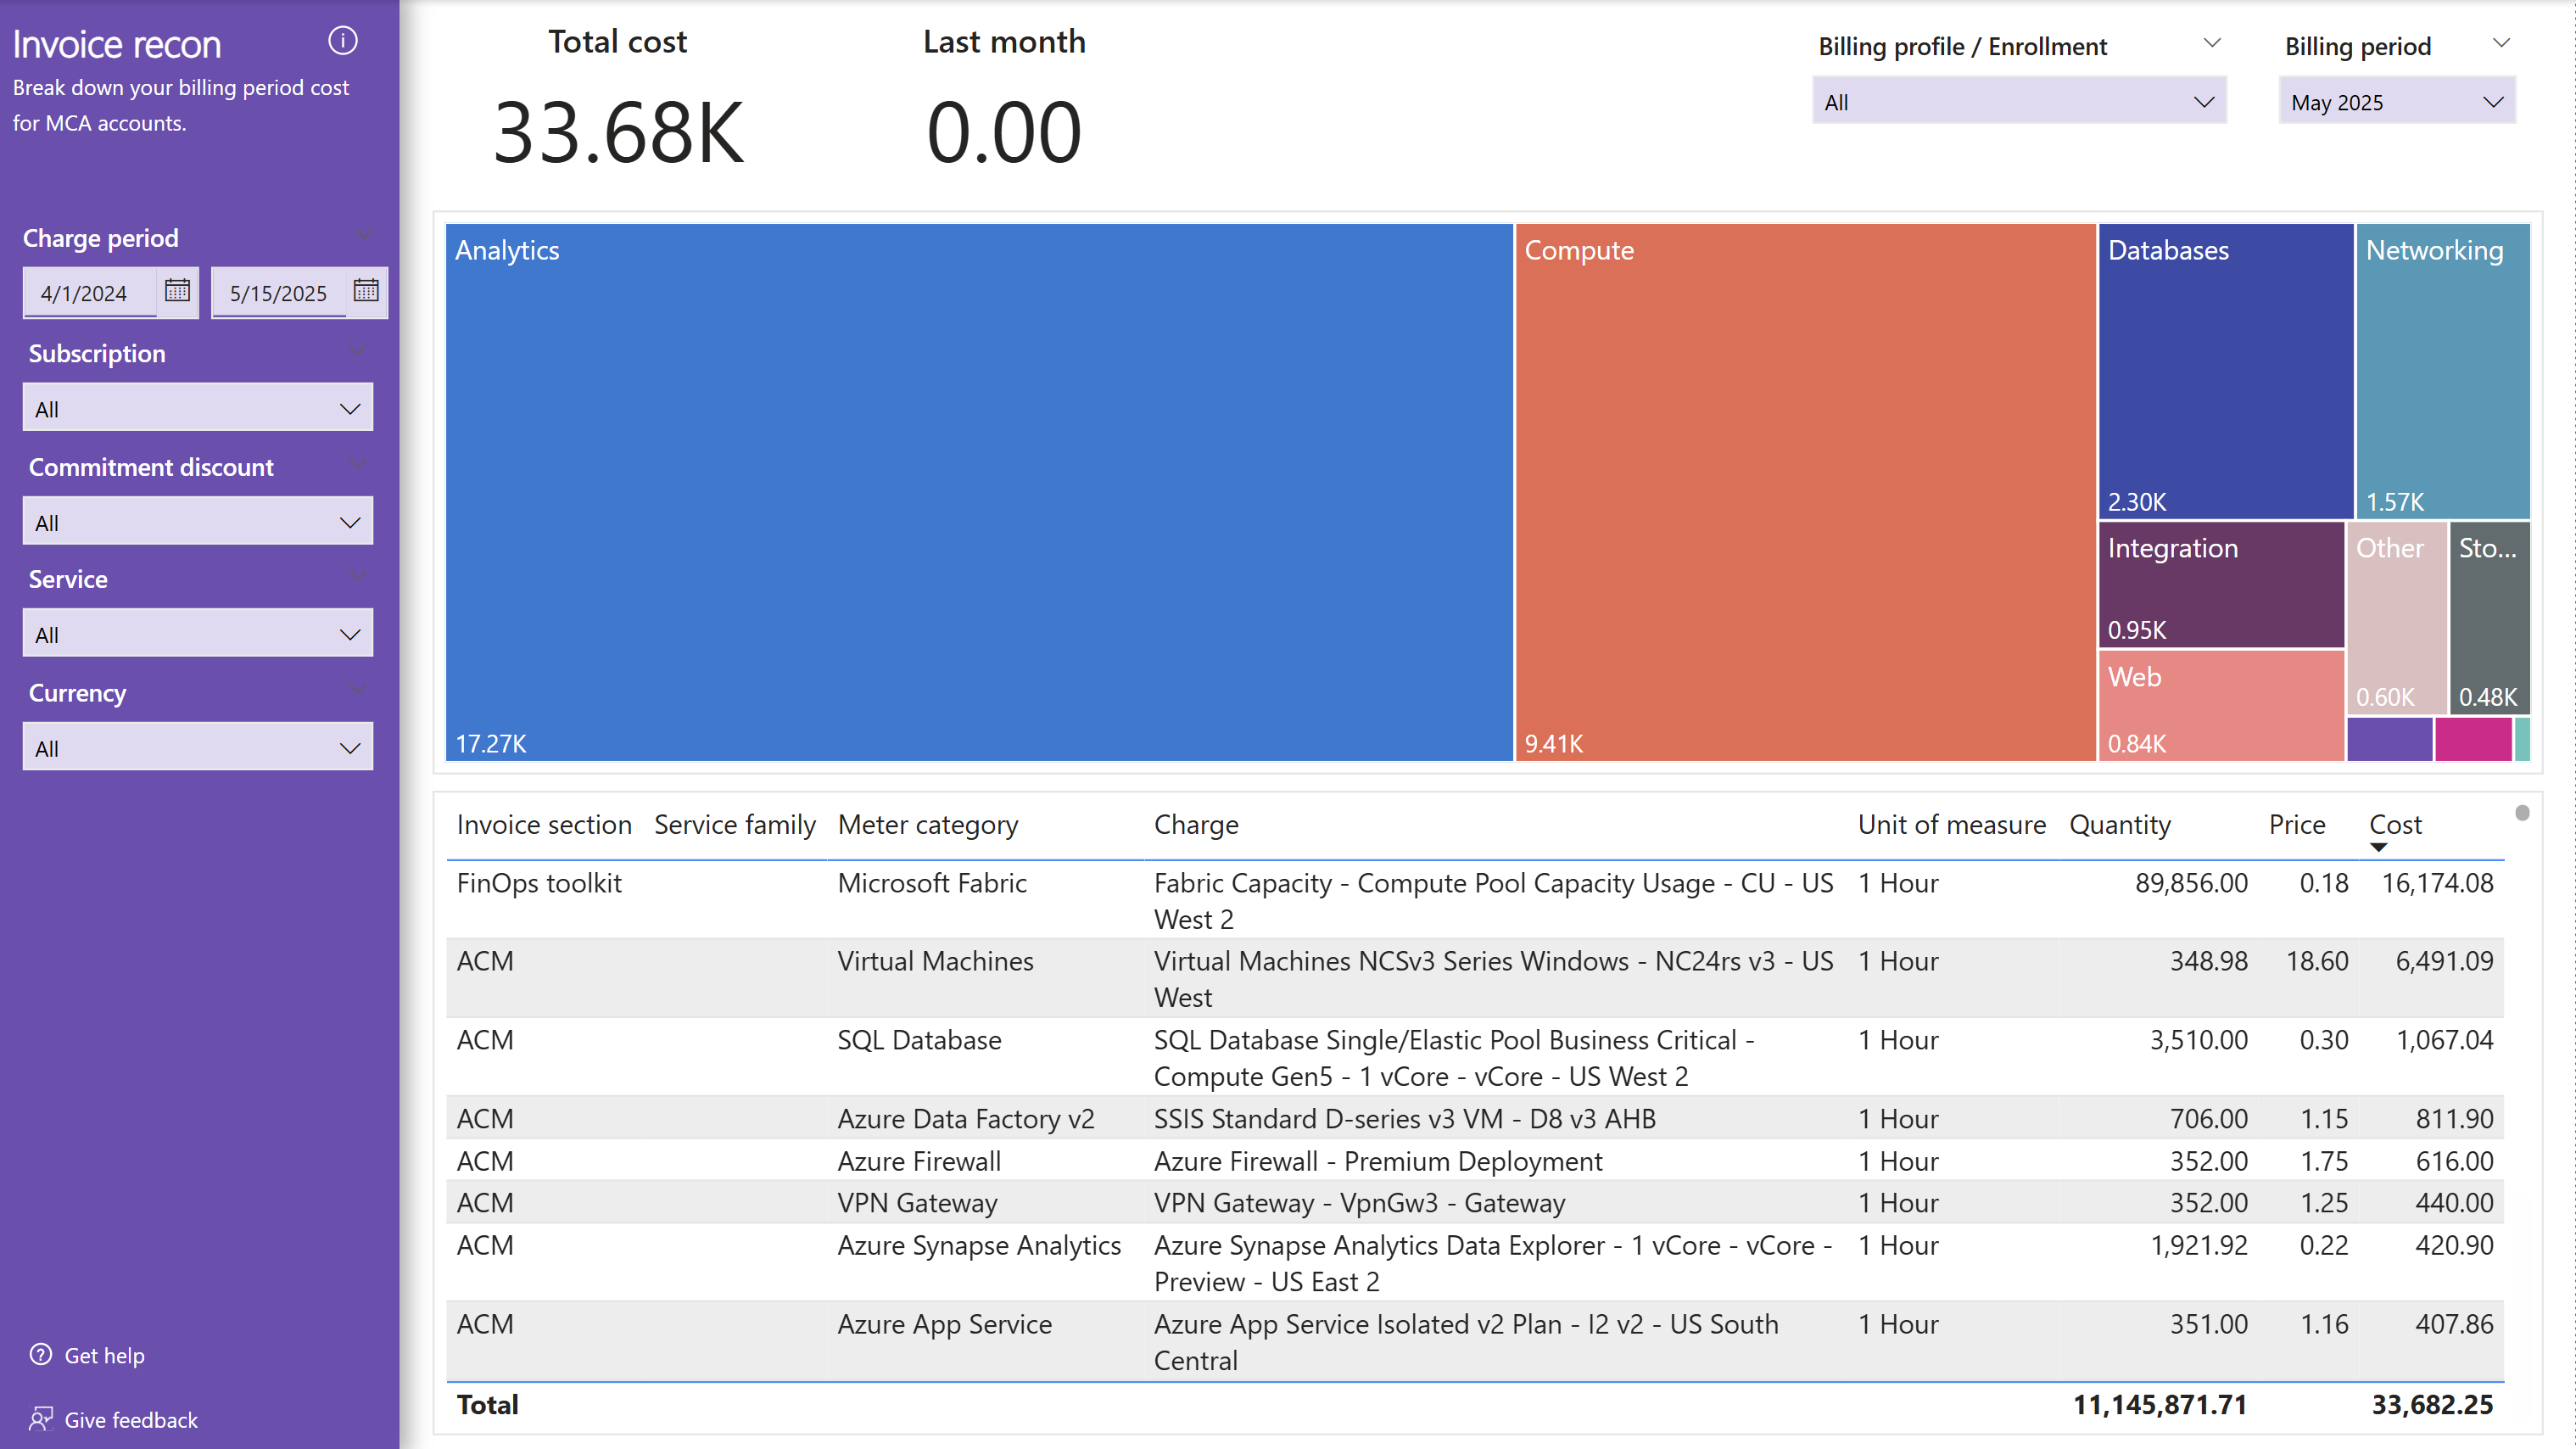
The Invoice recon (MCA) page includes a breakdown of your billed cost by invoice section, service family, and meter to align to Microsoft Customer Agreement (MCA) invoices. This page is useful for comparing billed charges on the invoice with cost and usage details in Cost Management for MCA billing profiles. Enterprise Agreement (EA) enrollments can also use this page; however, it will not align to EA invoices.
Invoice recon (EA)
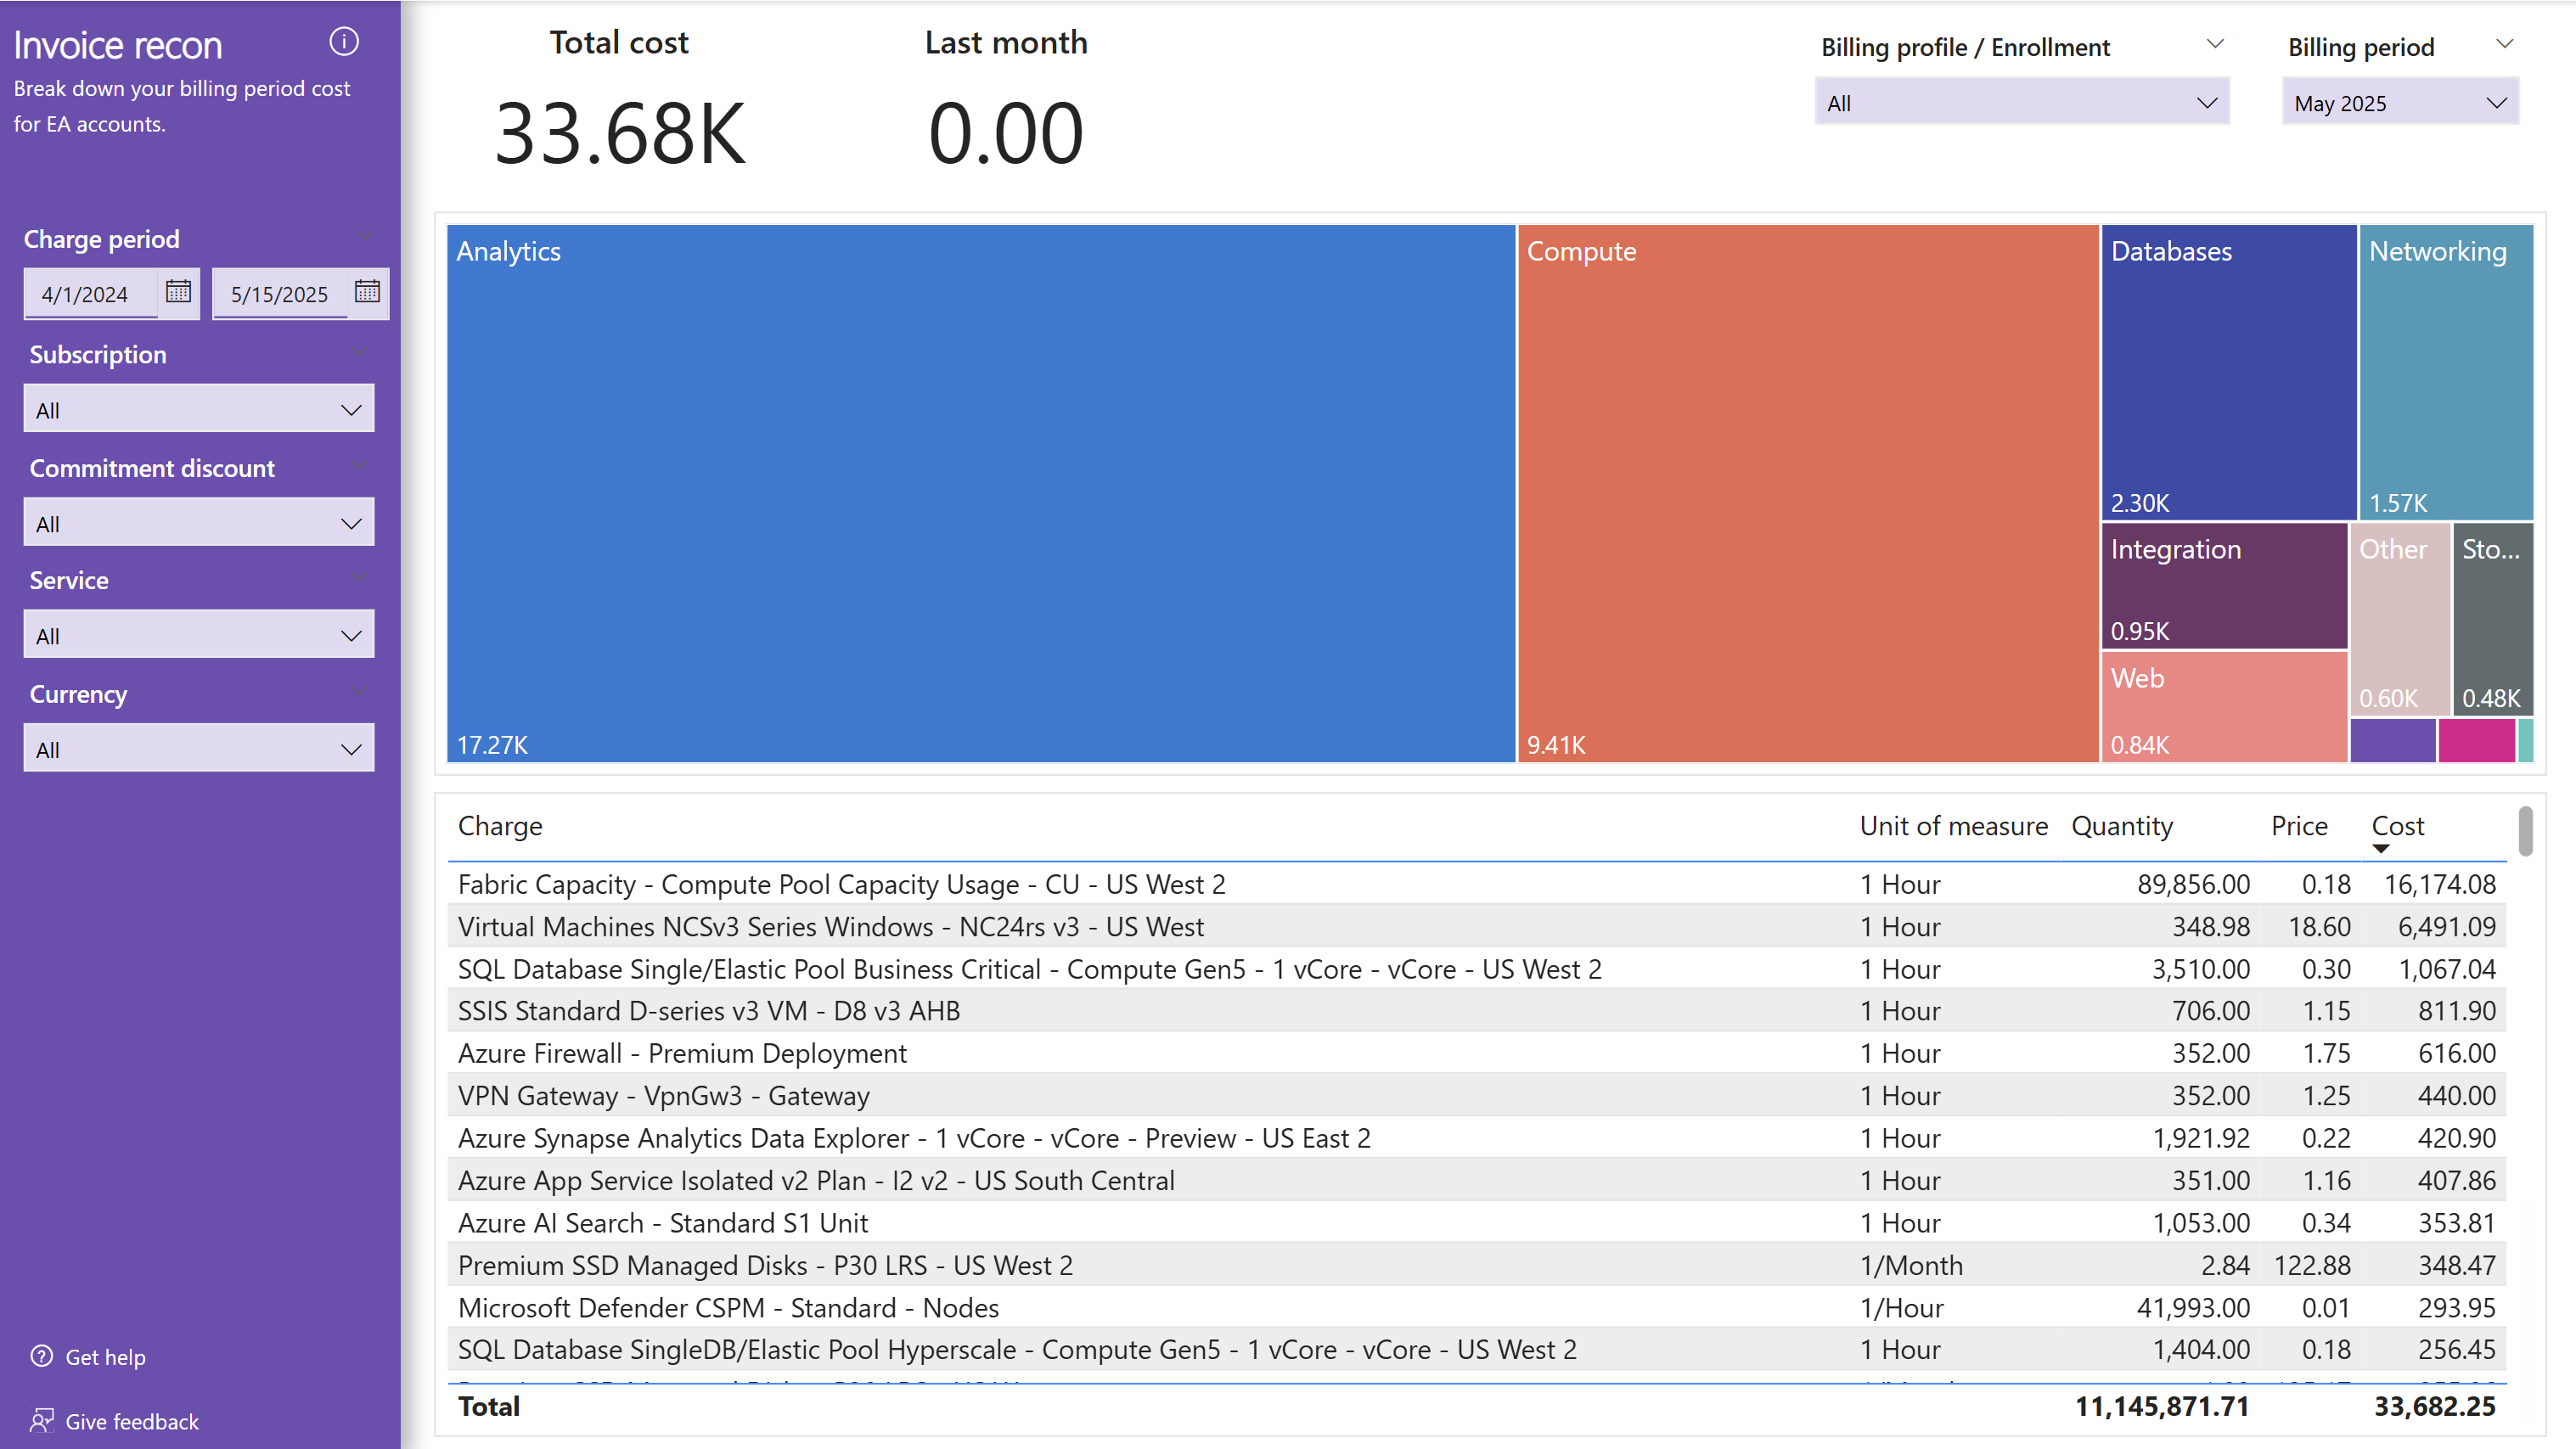
The Invoice recon (EA) page includes a breakdown of your billed cost by charge description (product) to align to Enterprise Agreement (EA) invoices. This page is useful for comparing billed charges on the invoice with cost and usage details in Cost Management for EA enrollments. Microsoft Customer Agreement (MCA) billing profiles can also use this page; however, it will not align to MCA invoices.
Purchases
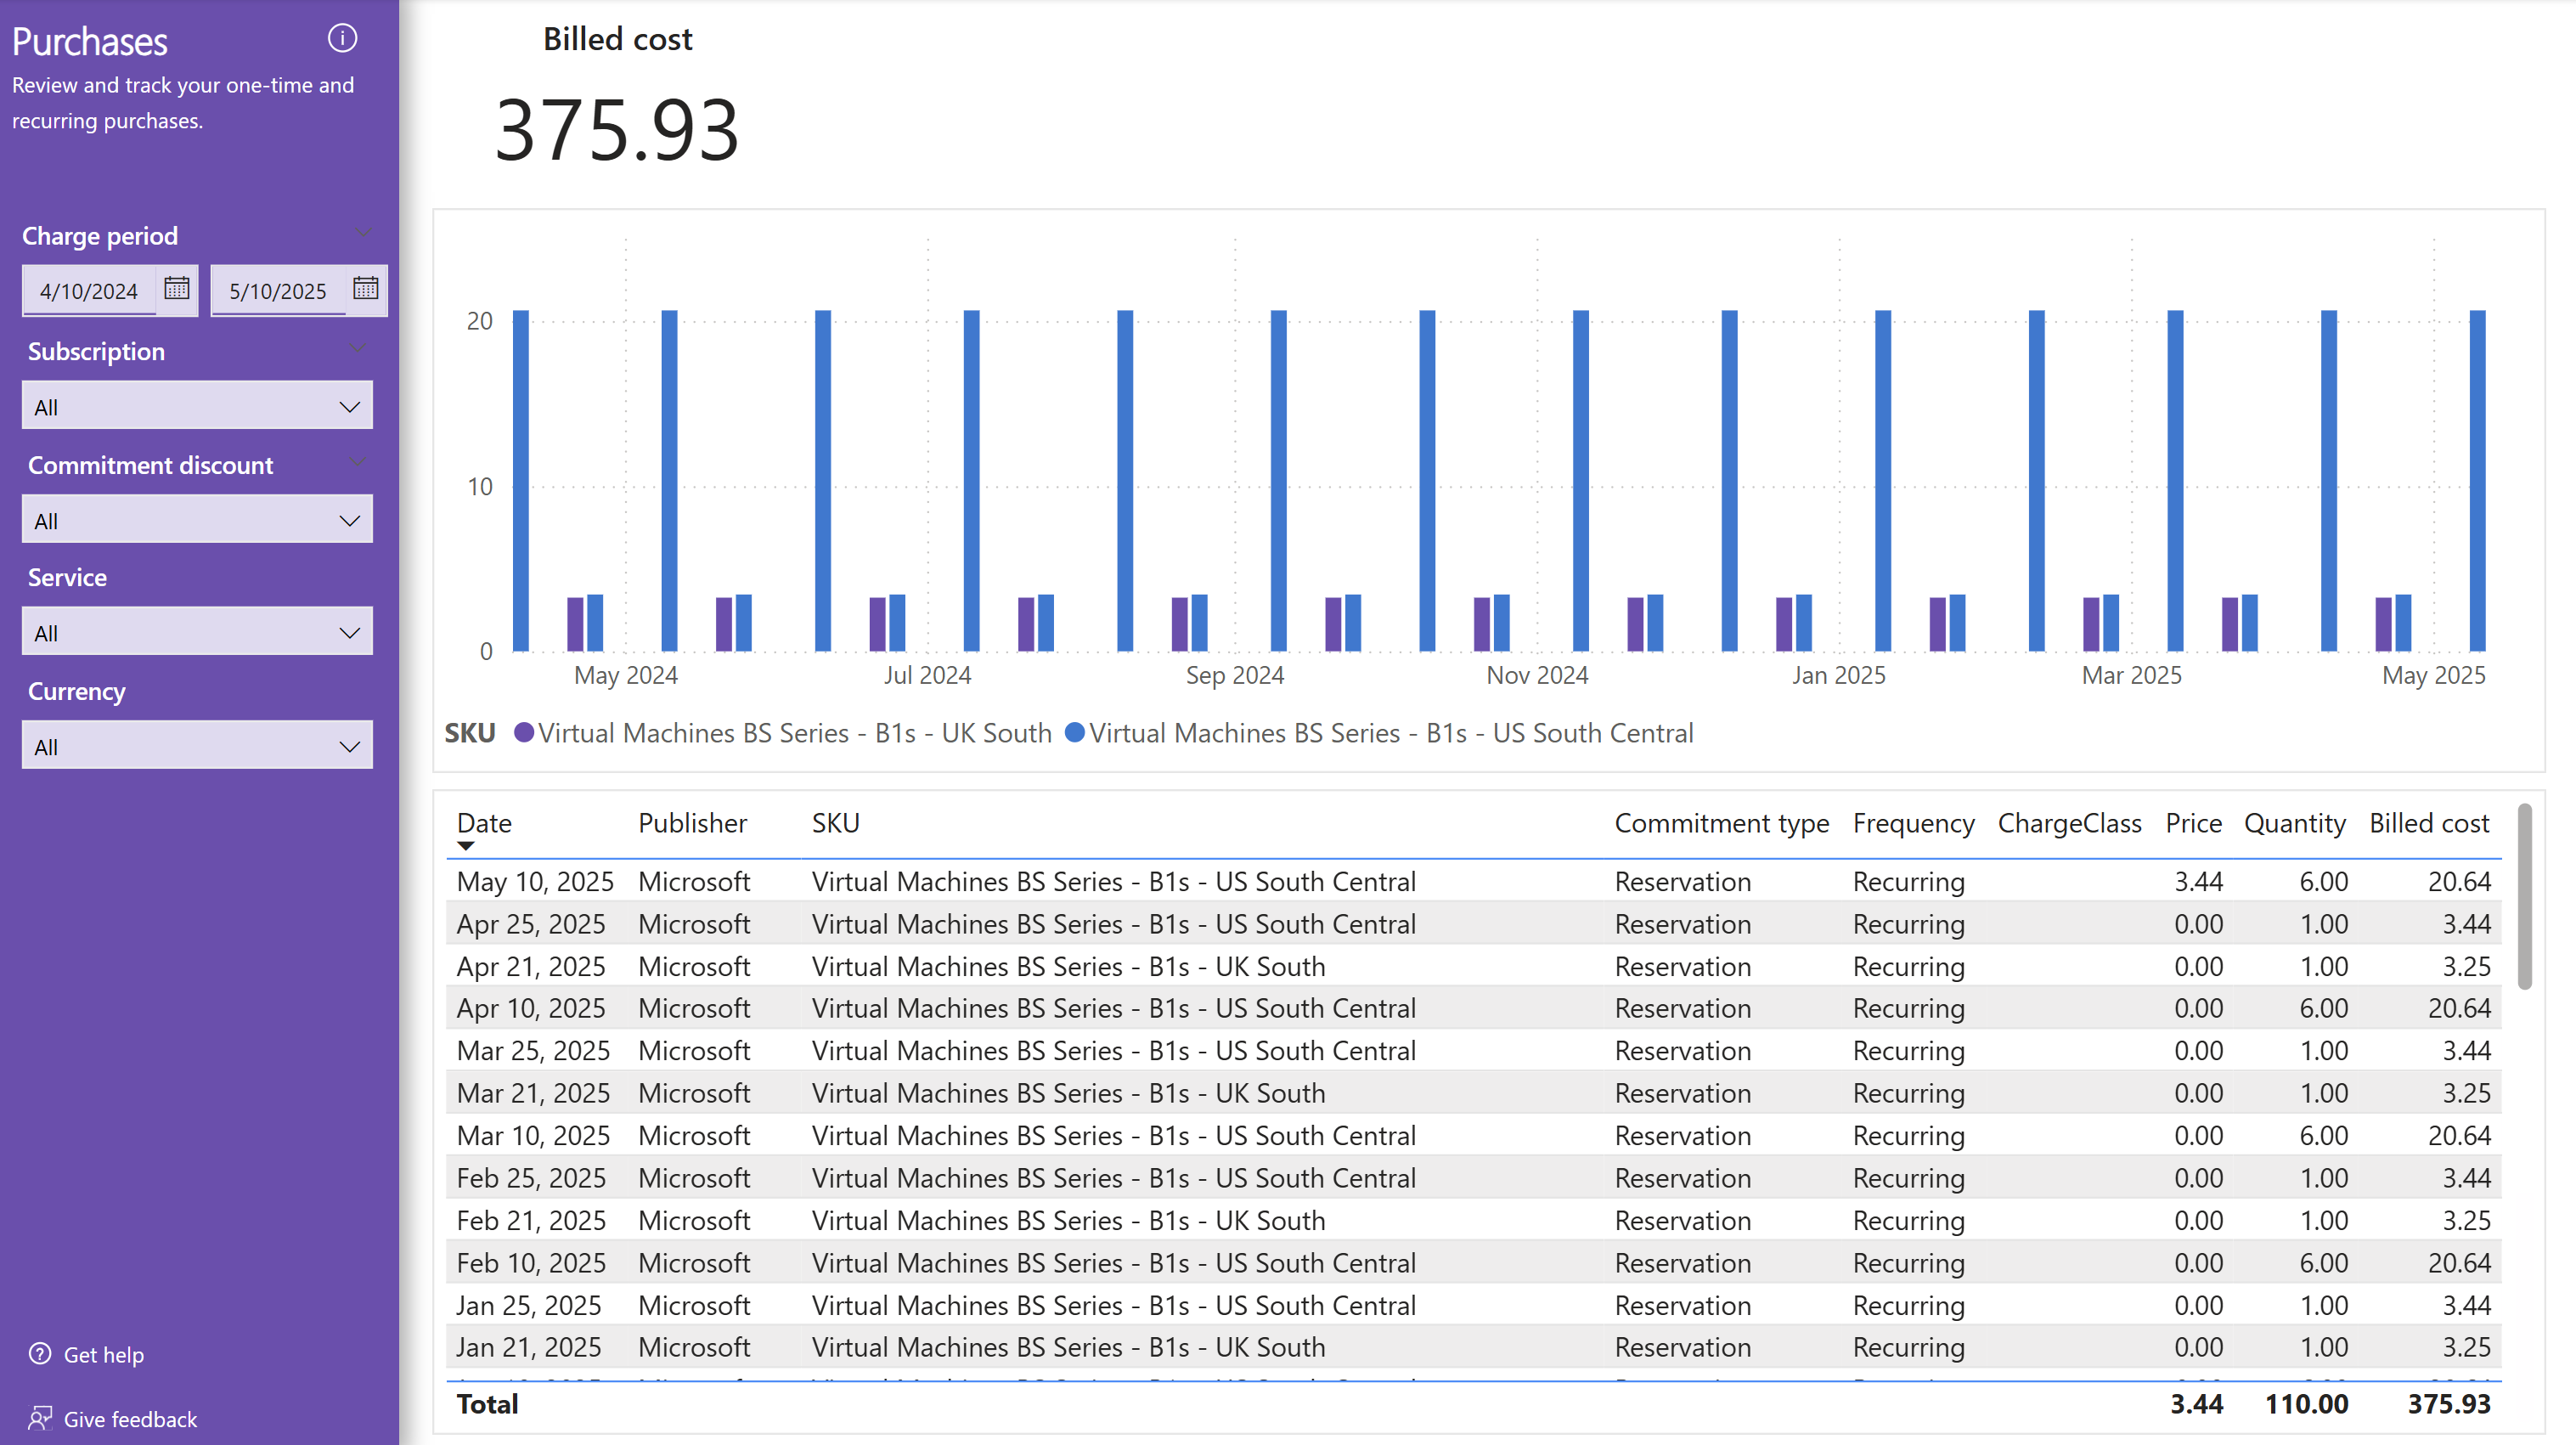
The Purchases page shows a list of products that were purchased during the period.
Prices
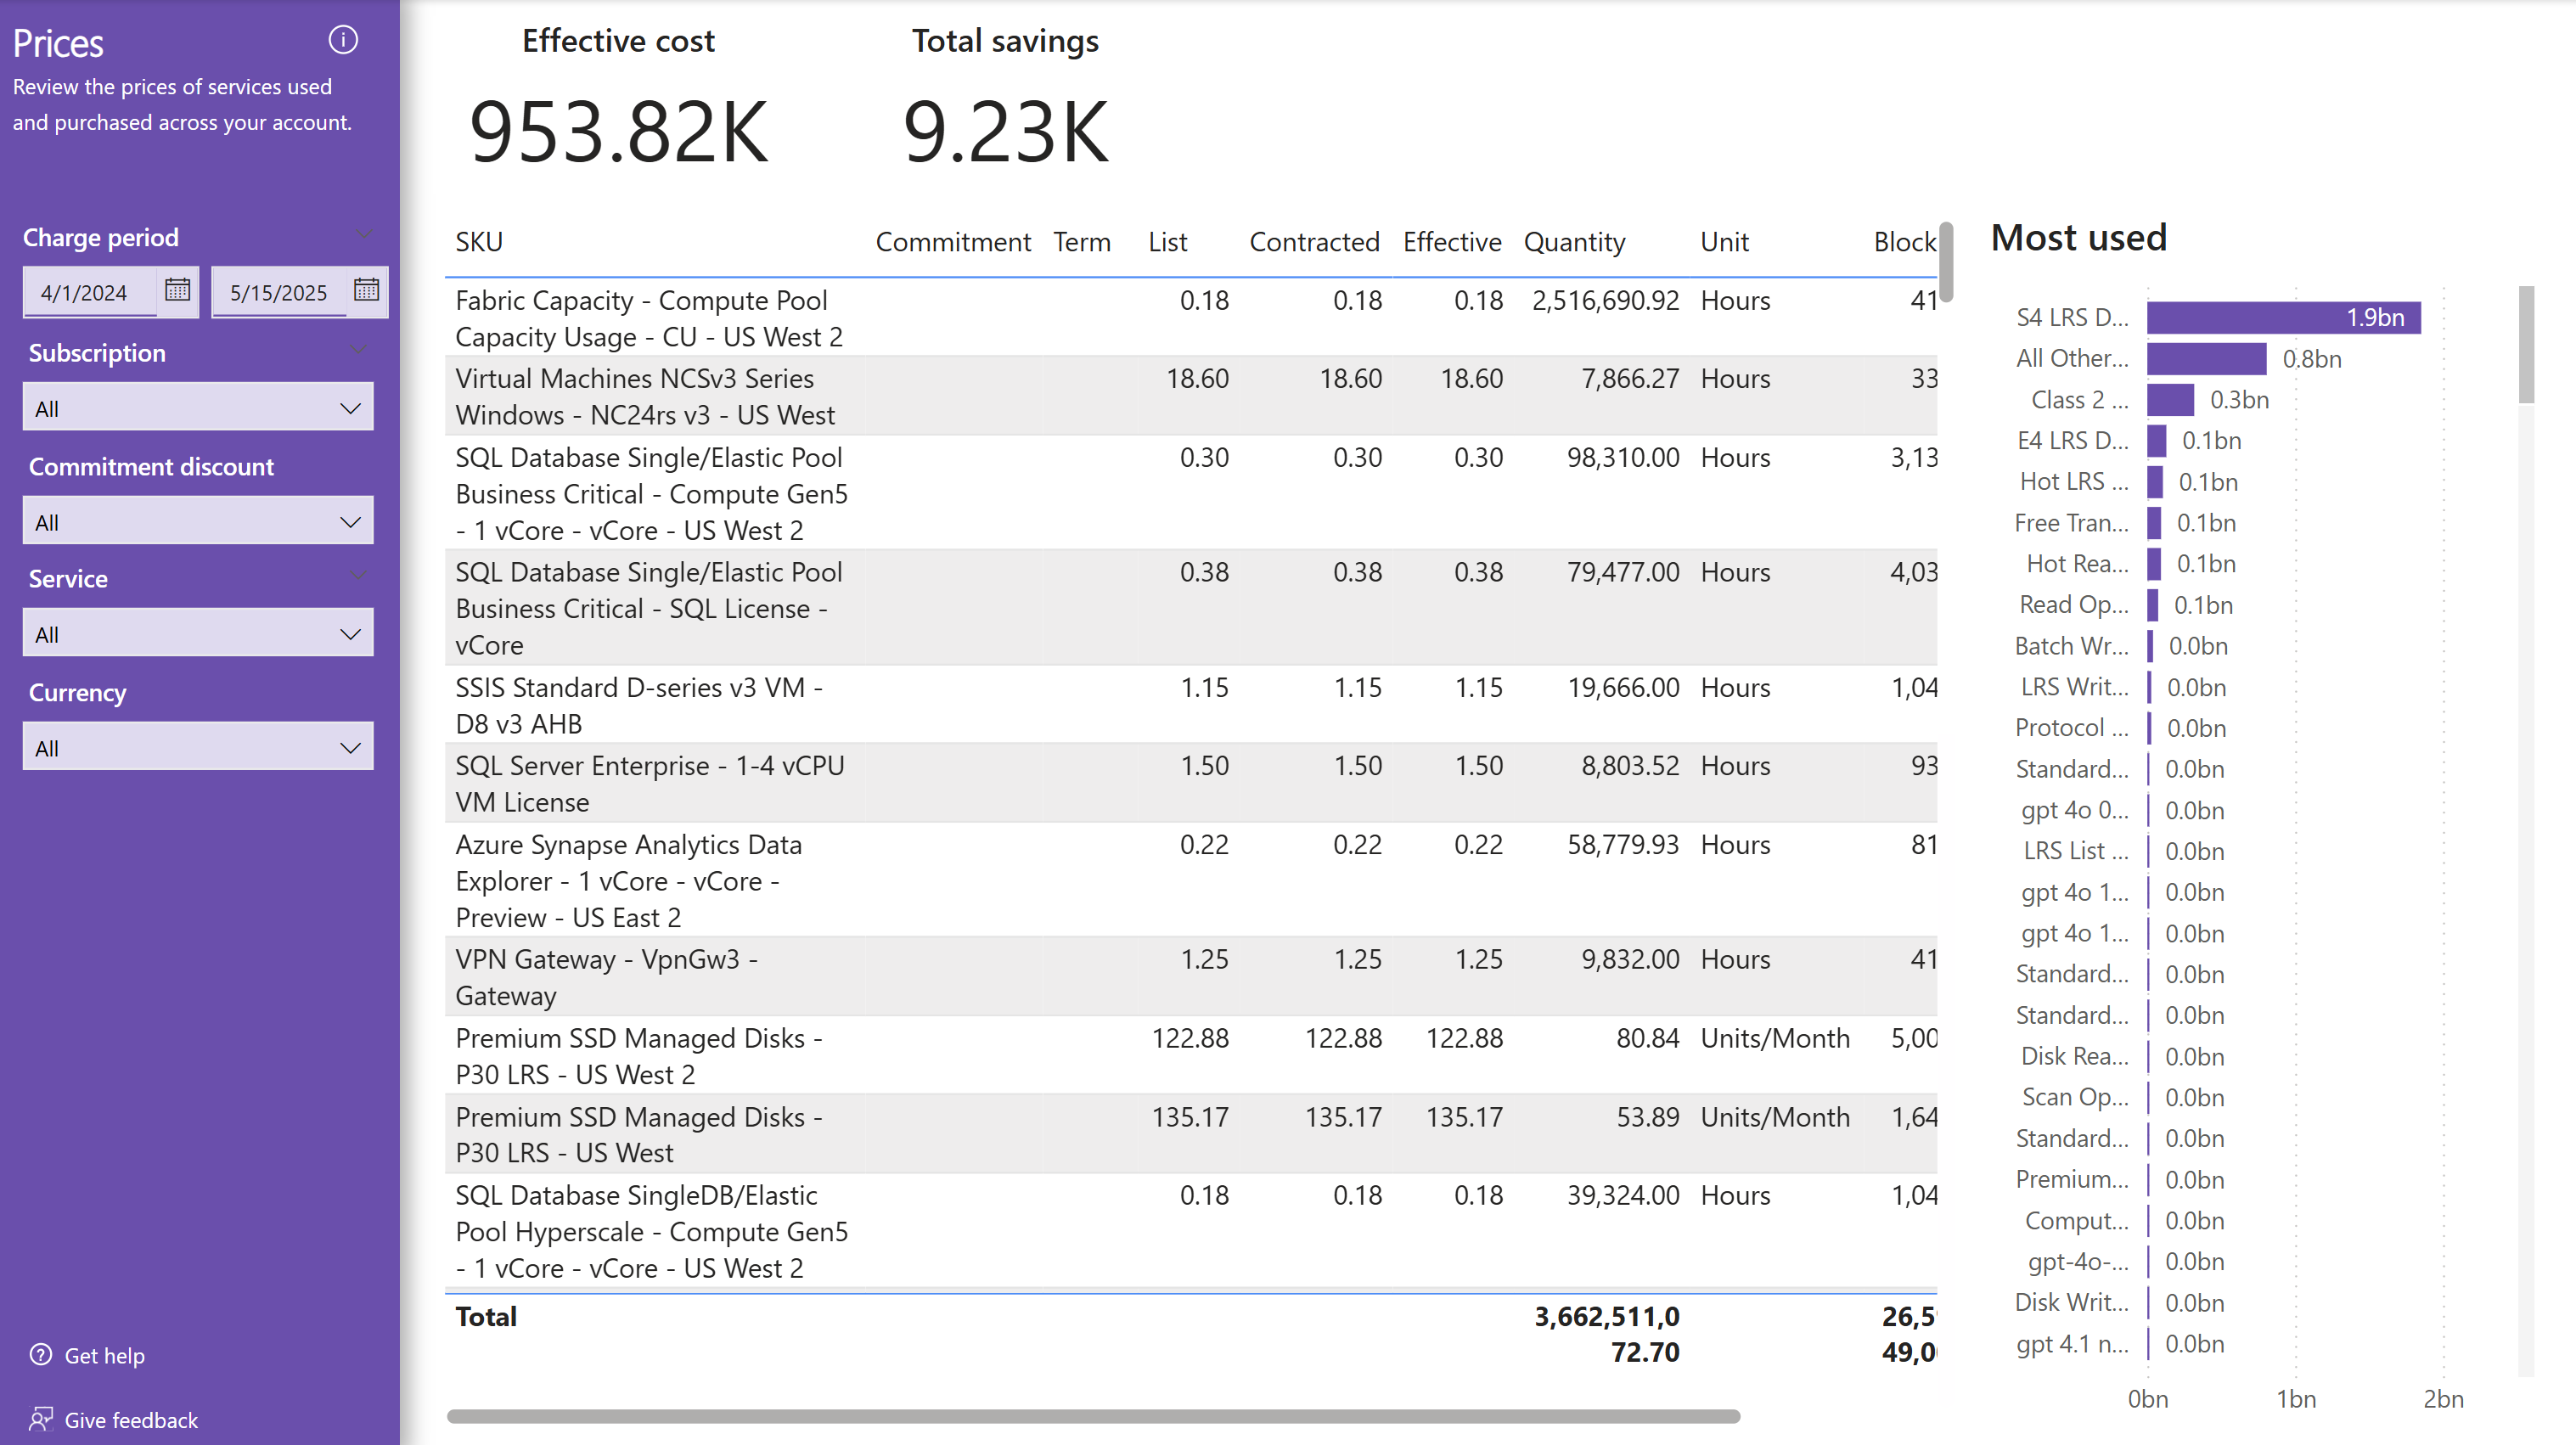
The Prices page shows the prices for all products used during the period.
The chart shows a summary of the meters that were most used.
Tags example
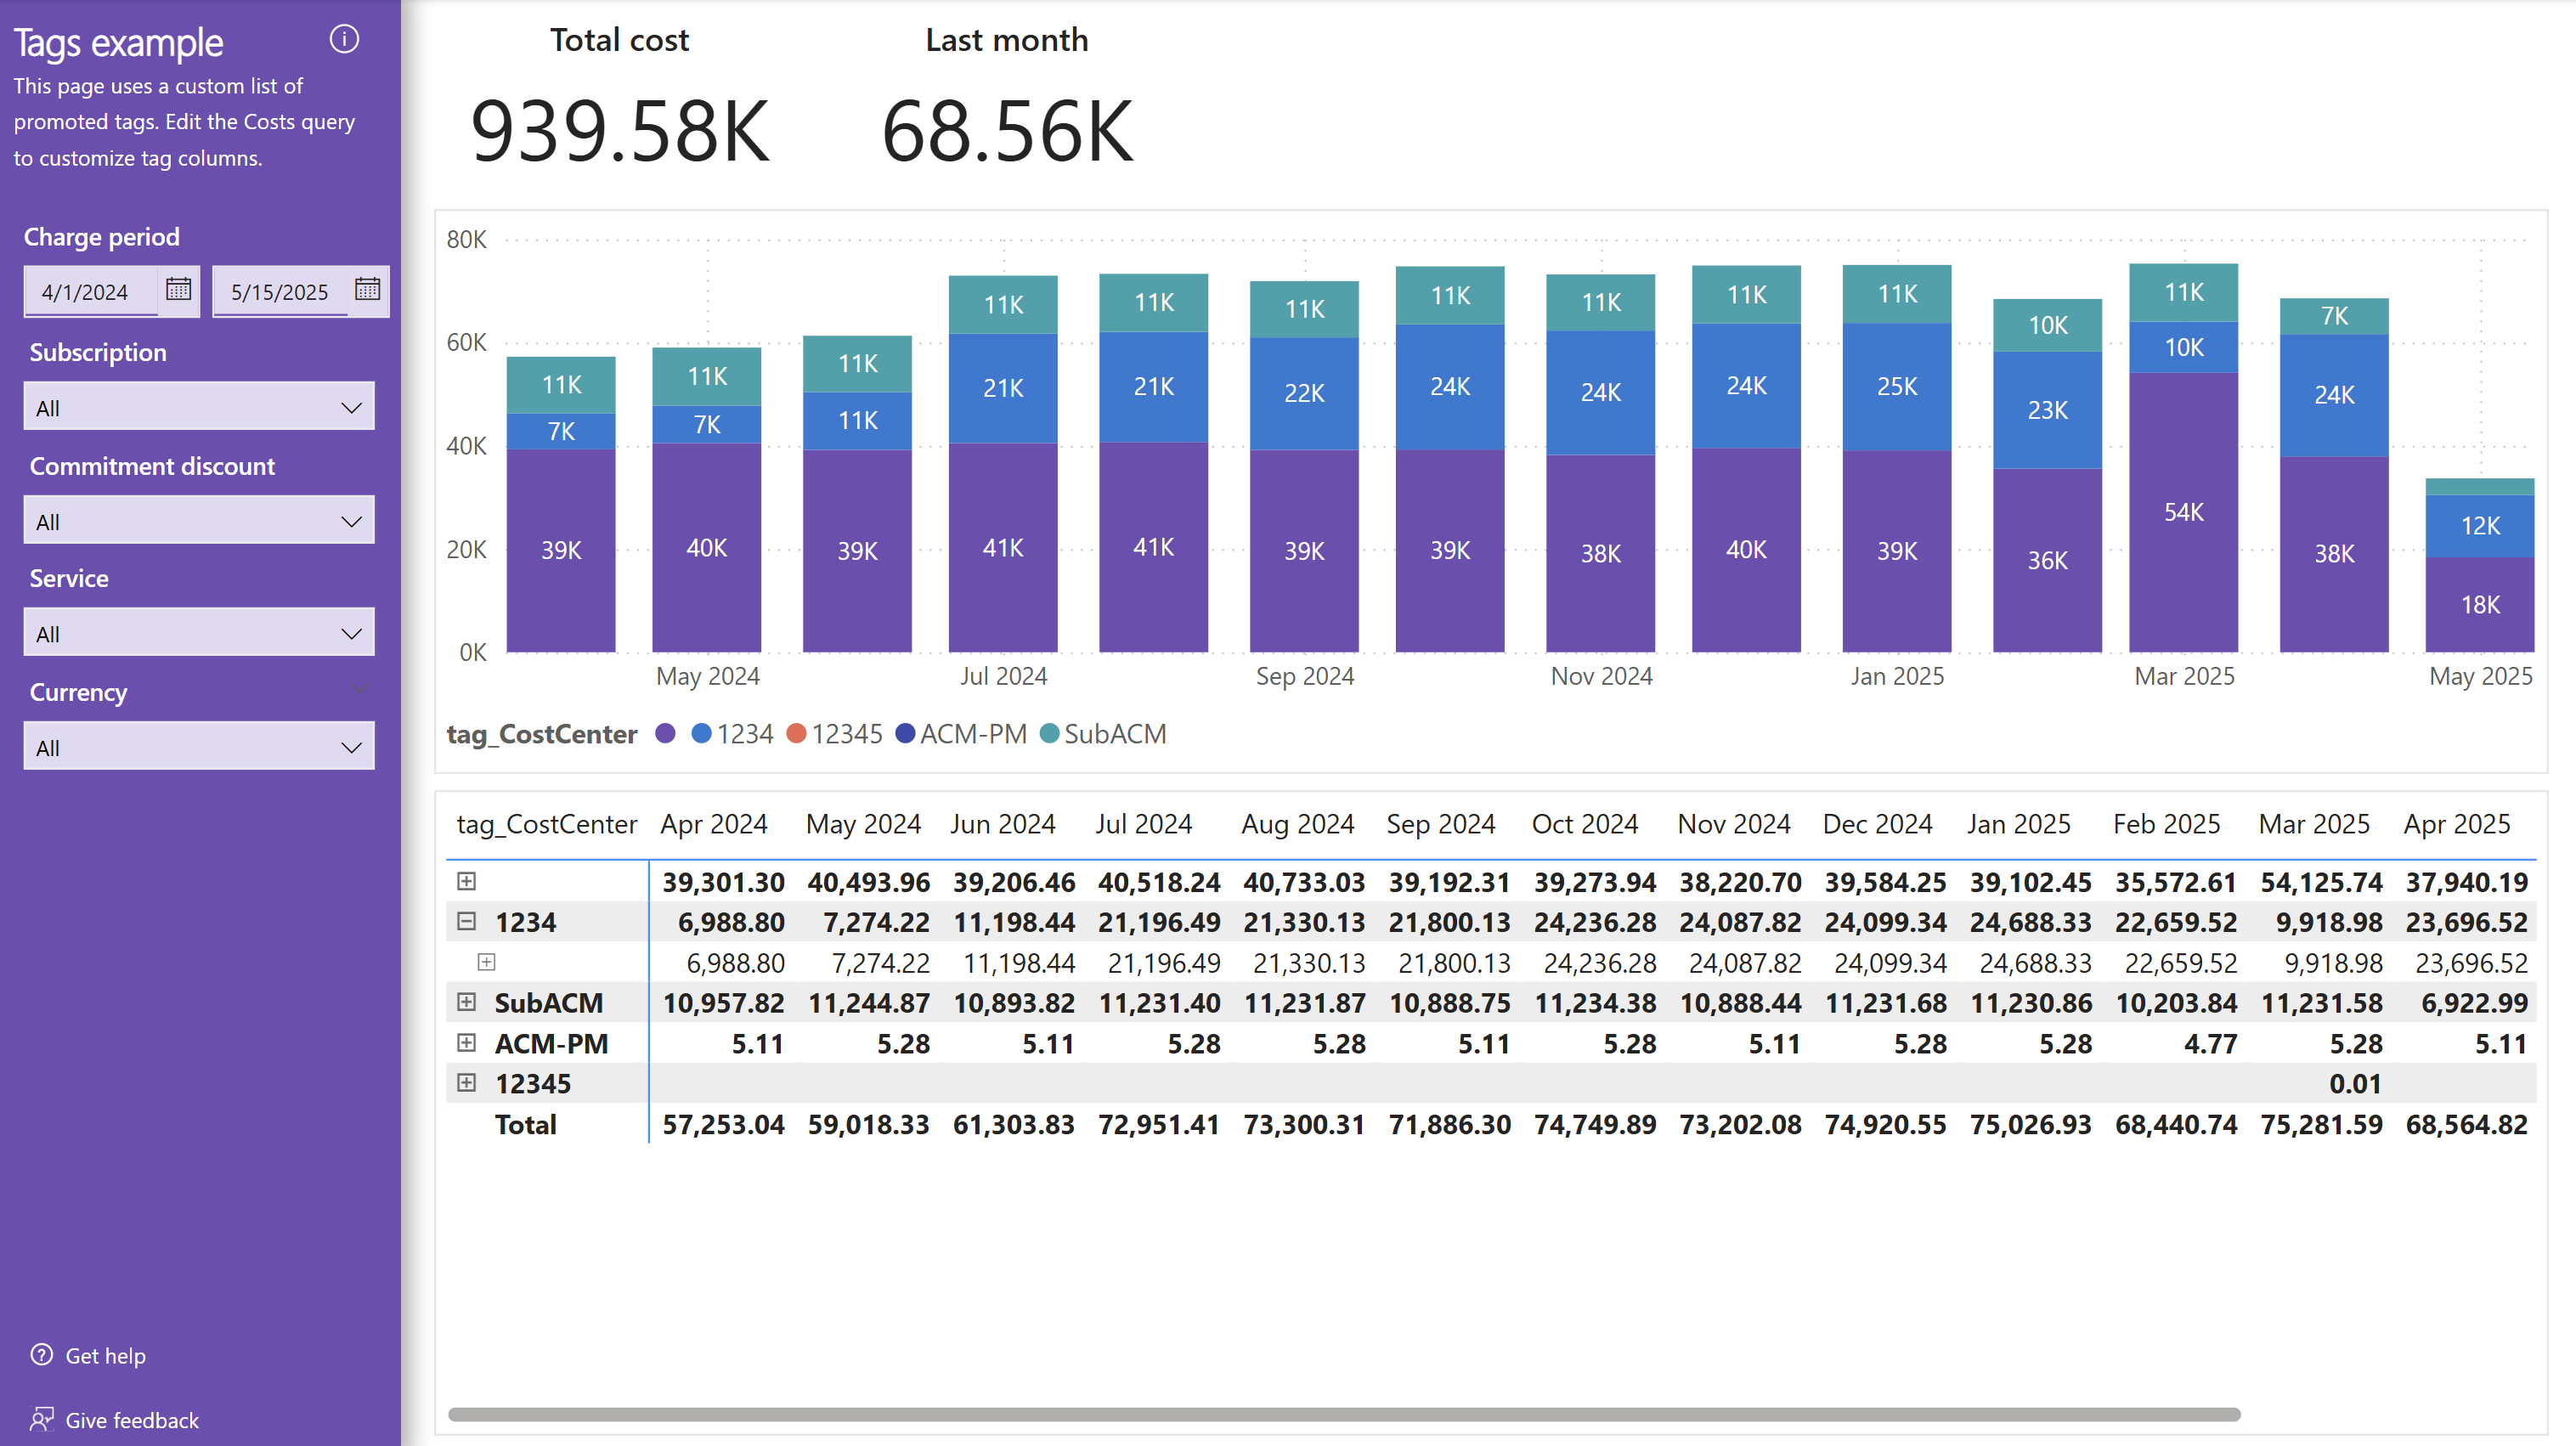
The Tags example page provides a conceptual breakdown of charges based on promoted tags. Promoted tags are configured directly in the Costs query in Power BI. If you change the promoted tags, you will also need to change this page to align to the tags you use within your account.
Looking for more?
We'd love to hear about any reports, charts, or general reporting questions you're looking to answer. Create a new issue with the details that you'd like to see either included in existing or new reports.
Related content
Related resources:
Related FinOps capabilities:
Related products:
Related solutions:
