Note
Access to this page requires authorization. You can try signing in or changing directories.
Access to this page requires authorization. You can try changing directories.
This article provides an example of how to use summary rules to aggregate insights from an auxiliary logs table to an Analytics table. In this example, you ingest Common Event Format (CEF) data from Logstash by deploying a custom connector using an ARM template.
Important
Starting in July 2026, all customers using Microsoft Sentinel in the Azure portal will be redirected to the Defender portal and will use Microsoft Sentinel in the Defender portal only. Starting in July 2025, many new users are also automatically onboarded and redirected from the Azure portal to the Defender portal. If you're still using Microsoft Sentinel in the Azure portal, we recommend that you start planning your transition to the Defender portal to ensure a smooth transition and take full advantage of the unified security operations experience offered by Microsoft Defender. For more information, see It’s Time to Move: Retiring Microsoft Sentinel’s Azure portal for greater security.
Prerequisites
To complete this tutorial, you need:
- A Microsoft Sentinel-enabled workspace.
- A virtual machine (VM) with Logstash installed. For more information, see Install Logstash.
- Access to Microsoft Sentinel with Microsoft Sentinel Contributor permissions. For more information, see Roles and permissions in Microsoft Sentinel.
- Monitoring Contributor permissions to create a data collection rule (DCR) and a data collection endpoint (DCE). For more information, see Data collection rules.
- To create summary rules in the Microsoft Defender portal, you must first onboard your workspace to the Defender portal. For more information, see Connect Microsoft Sentinel to the Microsoft Defender portal.
Process overview
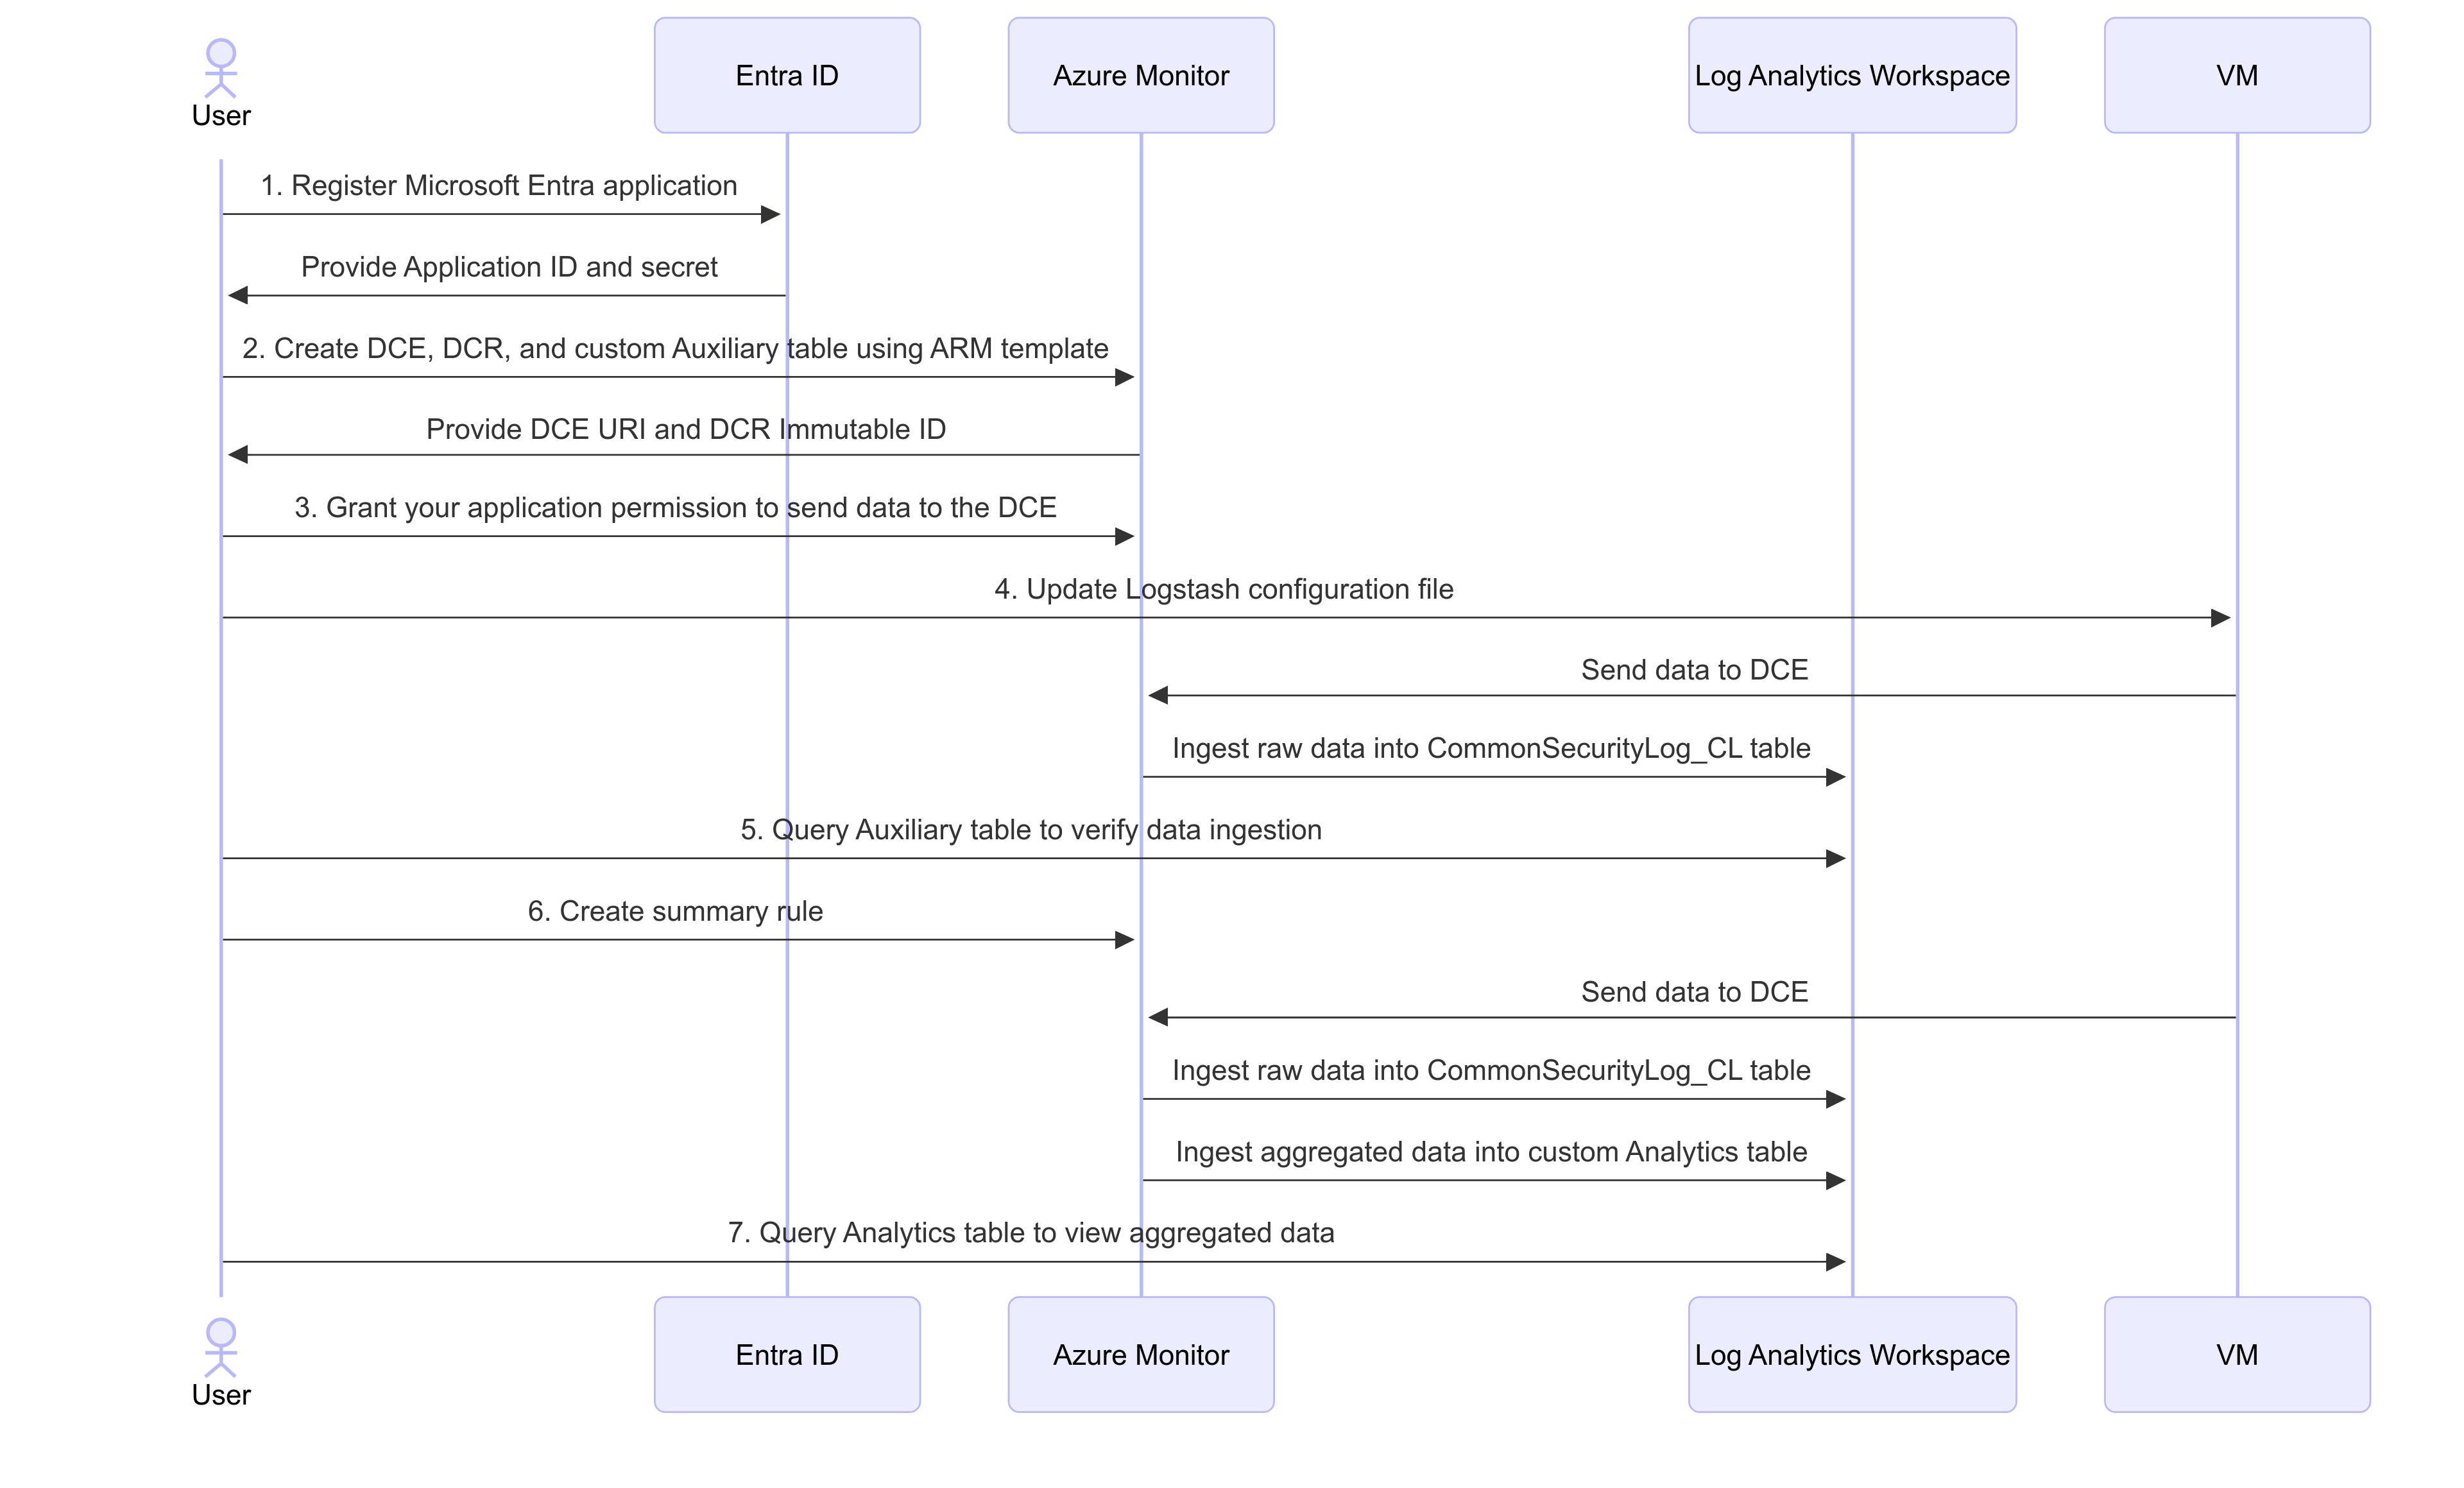
This diagram shows the process described in this tutorial:
Use summary rules with auxiliary logs
Register a Microsoft Entra application.
Create a Microsoft Entra application, and note the application's Client ID and Secret. For more information, see Tutorial: Send data to Azure Monitor Logs with Logs ingestion API (Azure portal).
The Microsoft Entra application authenticates the Logstash output plugin, which sends logs to your Log Analytics workspace.
Create a data collection endpoint (DCE), data collection rule (DCR), and a custom Auxiliary table.
Deploy this ARM template to create the required resources:
Note the following details from the ARM template output:
tenant_iddata_collection_endpointdcr_immutable_iddcr_stream_name
The data collection endpoint is the endpoint to which your Logstash instance sends logs. The data collection rule (DCR) defines which data to send to which table and how to process that data. For more information, see Data collection endpoints and Data collection rules.
Grant your application permission to send data to your data collection endpoint.
Navigate to your data collection endpoint, and assign the Log Analytics Data Contributor role to your Microsoft Entra application.
For more information, see Assign Azure roles using the Azure portal.
Update the Logstash configuration file on your VM.
Copy our sample Logstash configuration to your VM. Make sure to replace placeholder values with your own values for the custom table and Microsoft Entra app you created earlier.
This file configures Logstash to send CEF logs to the custom table created by the ARM template, transforming JSON data to the format used in your destination table schema.
After you update the configuration file and restart Logstash, CEF data that your VM logs will be sent to your Log Analytics workspace.
Query your Auxiliary table to verify that data is being ingested.
In Microsoft Sentinel, go to the Logs page and run a query. For example:
CommonSecurityLog_CL
| take 10
Create a summary rule.
Create a summary rule to aggregate insights from the Auxiliary table to an Analytics table. For more information about creating summary rules in Microsoft Sentinel, see Create a new summary rule.
Here are a couple of examples of summary rules to aggregate your CEF data:
Lookup indicator of compromise (IoC) data: Hunt for specific IoCs by running aggregated summary queries to bring unique occurrences, and then query only those occurrences for faster results. The
Messagefield is device-specific and in JSON format, so you need to parse this field to extract relevant data. This summary rule is an example of how to bring a uniqueSourceIPfeed along with other metadata, which you can then use against IoC lookups:// Daily Network traffic trend Per Destination IP along with Data transfer stats // Frequency - Daily - Maintain 30 day or 60 Day History. CommonSecurityLog_CL | extend j=parse_json(Message) | extend DestinationIP=tostring(j.destinationAddress) | extend SourceIP=tostring(j.sourceAddress) | extend SentBytes=toint(j.bytesOut) | extend ReceivedBytes=toint(j.bytesOut) | extend Day = format_datetime(TimeGenerated, "yyyy-MM-dd") | summarize Count= count(), DistinctSourceIps = dcount(SourceIP), NoofBytesTransferred = sum(SentBytes), NoofBytesReceived = sum(ReceivedBytes) by Day,DestinationIP, DeviceVendorQuery a summary baseline for anomaly detections. Instead of running your queries against large historical periods, such as 30 or 60 days, we recommend that you ingest data into an Auxiliary table, and then only query summary baseline data, such as for time series anomaly detections. For example:
// Time series data for Firewall traffic logs
let starttime = 14d;
let endtime = 1d;
let timeframe = 1h;
CommonSecurityLog_CL
| extend j=parse_json(Message)
| extend DestinationIP=tostring(j.destinationAddress)
| extend SourceIP=tostring(j.sourceAddress)
| extend SentBytes=toint(j.bytesOut)
| where isnotempty(DestinationIP) and isnotempty(SourceIP)
| where ipv4_is_private(DestinationIP) == false
| project TimeGenerated, SentBytes, DeviceVendor
| make-series TotalBytesSent=sum(SentBytes) on TimeGenerated from startofday(ago(starttime)) to startofday(ago(endtime)) step timeframe by DeviceVendor
Query the destination Analytics table.
To view the aggregated data, run a query against the Analytics table you specified in the summary rule.
See more information on the following items used in the preceding examples, in the Kusto documentation:
- let statement
- where operator
- extend operator
- project operator
- summarize operator
- lookup operator
- union operator
- make-series operator
- isnotempty() function
- format_datetime() function
- column_ifexists() function
- iff() function
- ipv4_is_private() function
- min() function
- tostring() function
- ago() function
- startofday() function
- parse_json() function
- count() aggregation function
- make_set() aggregation function
- dcount() aggregation function
- sum() aggregation function
For more information on KQL, see Kusto Query Language (KQL) overview.
Other resources:
