Note
Access to this page requires authorization. You can try signing in or changing directories.
Access to this page requires authorization. You can try changing directories.
Azure Managed Grafana offers a bundled Prometheus integration in preview that lets you connect a selected Azure Monitor workspace (managed Prometheus) to your Grafana instance and immediately use it as both a read and remote-write backend for Grafana-managed recording rules. By connecting your chosen Azure Monitor workspace to Grafana, you can periodically pre-compute frequently used or computationally expensive queries, saving the results as a new time series metric back into the same workspace, and visualize those recorded series alongside the rest of your Azure metrics.
Bundled Prometheus integrates seamlessly with Azure Monitor workspaces, enabling you to:
- Automatically provision Prometheus data collection and storage
- Set up Grafana-managed recording rules for optimized query performance
- Visualize Prometheus metrics alongside other Azure monitoring data
- Centralize your observability stack within Azure
This article walks you through enabling bundled Prometheus, configuring recording rules, and creating dashboards to visualize your Prometheus data in Azure Managed Grafana.
Prerequisites
- An Azure account with an active subscription. Create an account for free.
- An Azure Managed Grafana workspace in the Standard tier. Create a new workspace if you don't have one.
- Grafana version 11.0 or higher.
- An Azure Monitor workspace that supports Prometheus metrics collection.
- You must have the Owner role on the Azure Monitor workspace or custom permissions to create role assignments. This access allows Azure Managed Grafana to configure the necessary access to collect and store Prometheus metrics.
Select an Azure Monitor workspace to enable bundled Prometheus (preview)
Complete the following steps to connect your Grafana workspace to an Azure Monitor workspace and enable bundled Prometheus (preview):
Open your Azure Managed Grafana workspace and in the left menu select Integrations > Bundled Prometheus (Preview).
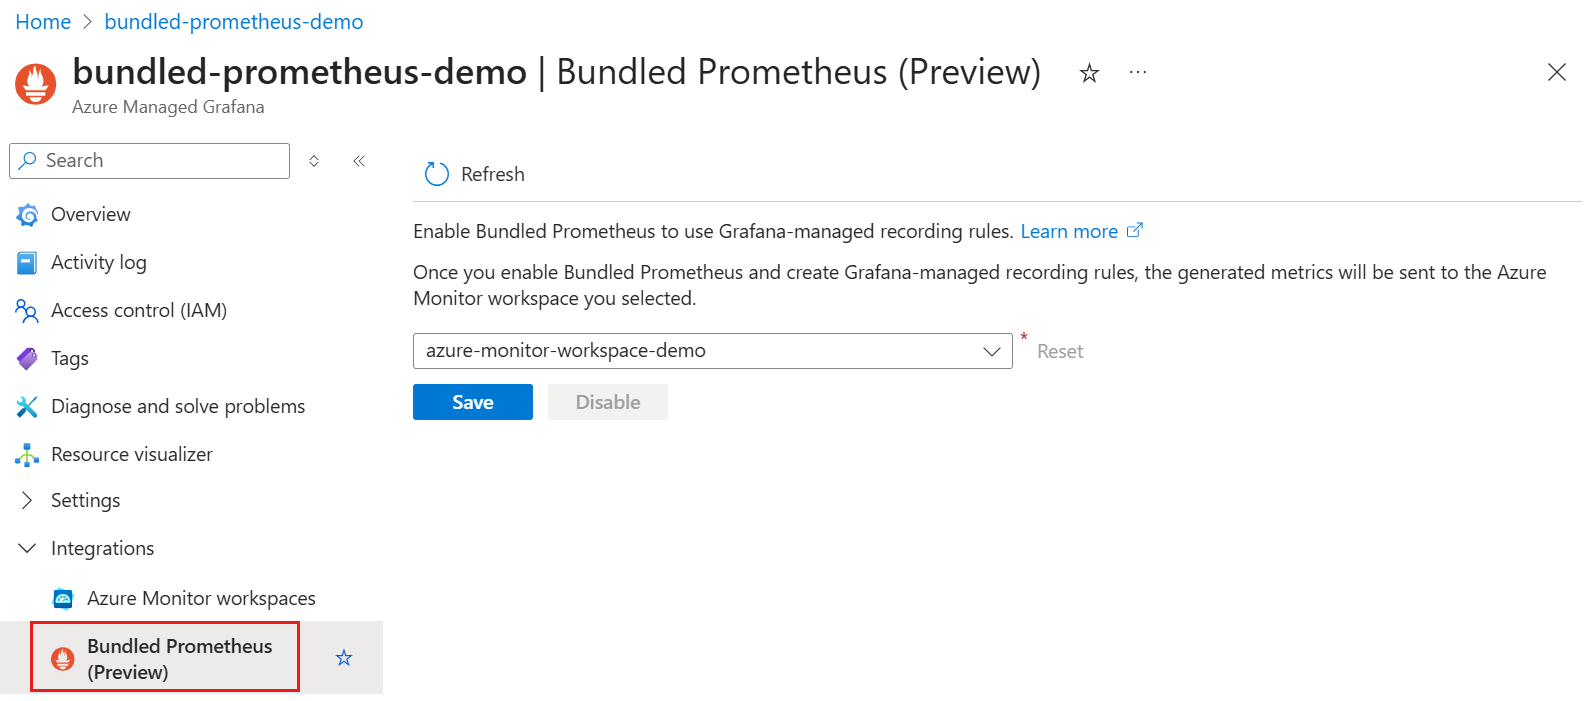
In the dropdown menu, select an Azure Monitor workspace, then select Save.
Azure adds a new Prometheus data source called bundled-azure-prometheus to Grafana. During enablement, the Grafana-managed recording rules feature is enabled. Azure also automatically creates two role assignments if they don't already exist:
- Monitoring Data Reader: Grants the Grafana instance read access to metrics in the selected Azure Monitor workspace.
- Monitoring Metrics Publisher: Allows the Grafana instance to write recording rule results to the Data Collection Rule attached to the Azure Monitor workspace.
After enablement completes, the selected Azure Monitor workspace appears in the dropdown menu.
To switch to a different Azure Monitor workspace in the future, repeat steps 2 and 3 above.
Create a Grafana alert rule
Alert rules monitor your Prometheus metrics and trigger notifications when specific conditions are met.
Follow these steps to create an alert rule:
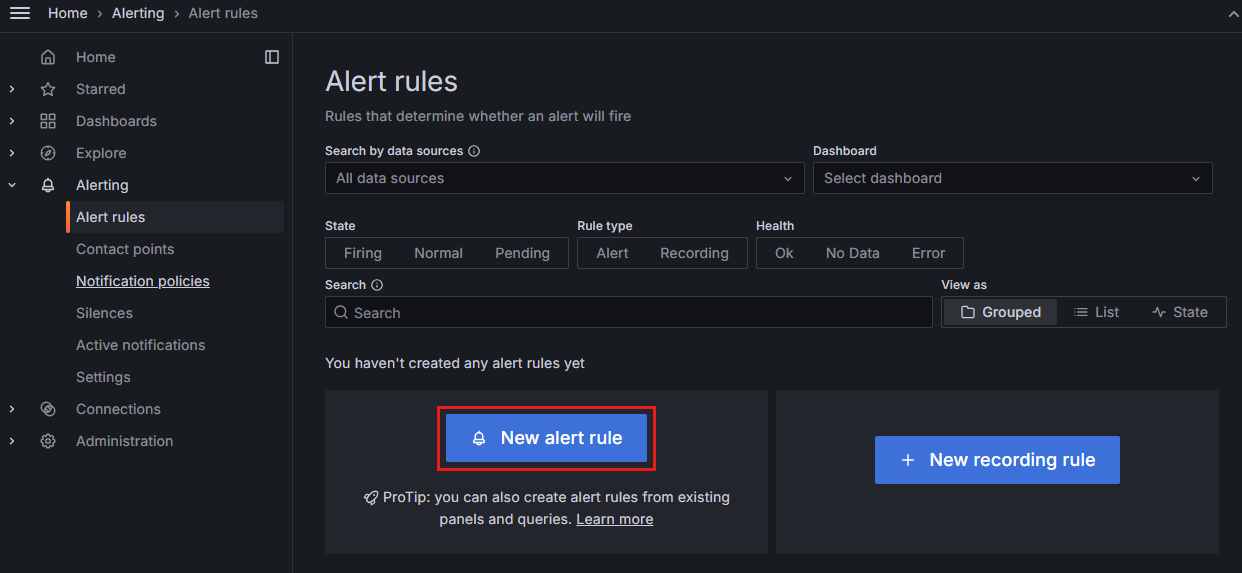
In the Grafana UI, go to Alerting > Alert rules and select New alert rule.
Enter an alert rule name that describes what you're monitoring.
Define a query and alert condition: select bundled-azure-prometheus from the dropdown and define your query and alert condition.
Set an evaluation behavior: set the evaluation interval and the conditions for firing or resolving the alert.
Set labels and notifications: add labels to help categorize the alert and set up notifications to receive alerts.
Select Save rule and exit to create the alert rule.

For more details, see Create Grafana-managed alert rules.
Set up Grafana-managed recording rules
Note
Bundled Prometheus (preview) only supports Grafana-managed recording rules, which you configure directly in the Grafana interface. Data source-managed recording rules aren't supported.
Follow these steps to create a new recording rule:
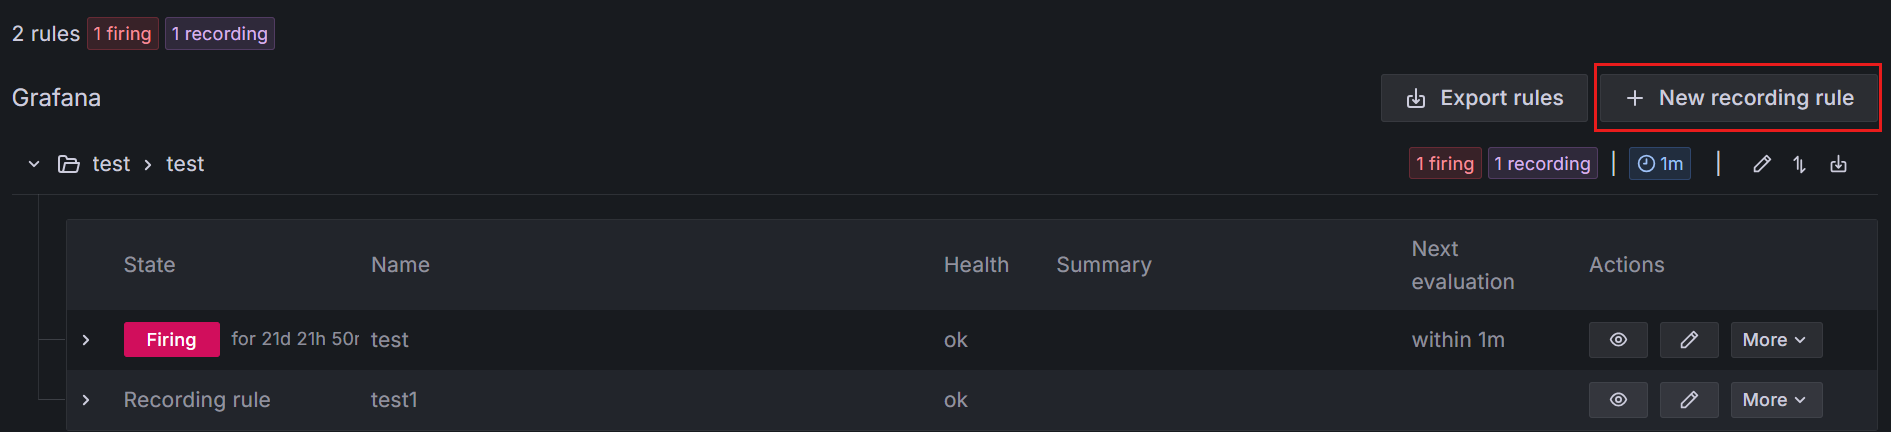
On the Alert rules page which is open, select New recording rule.
In the page that opens, enter a name for the recording rule and a metric name.
Define the rule for the bundled-azure-prometheus data source.
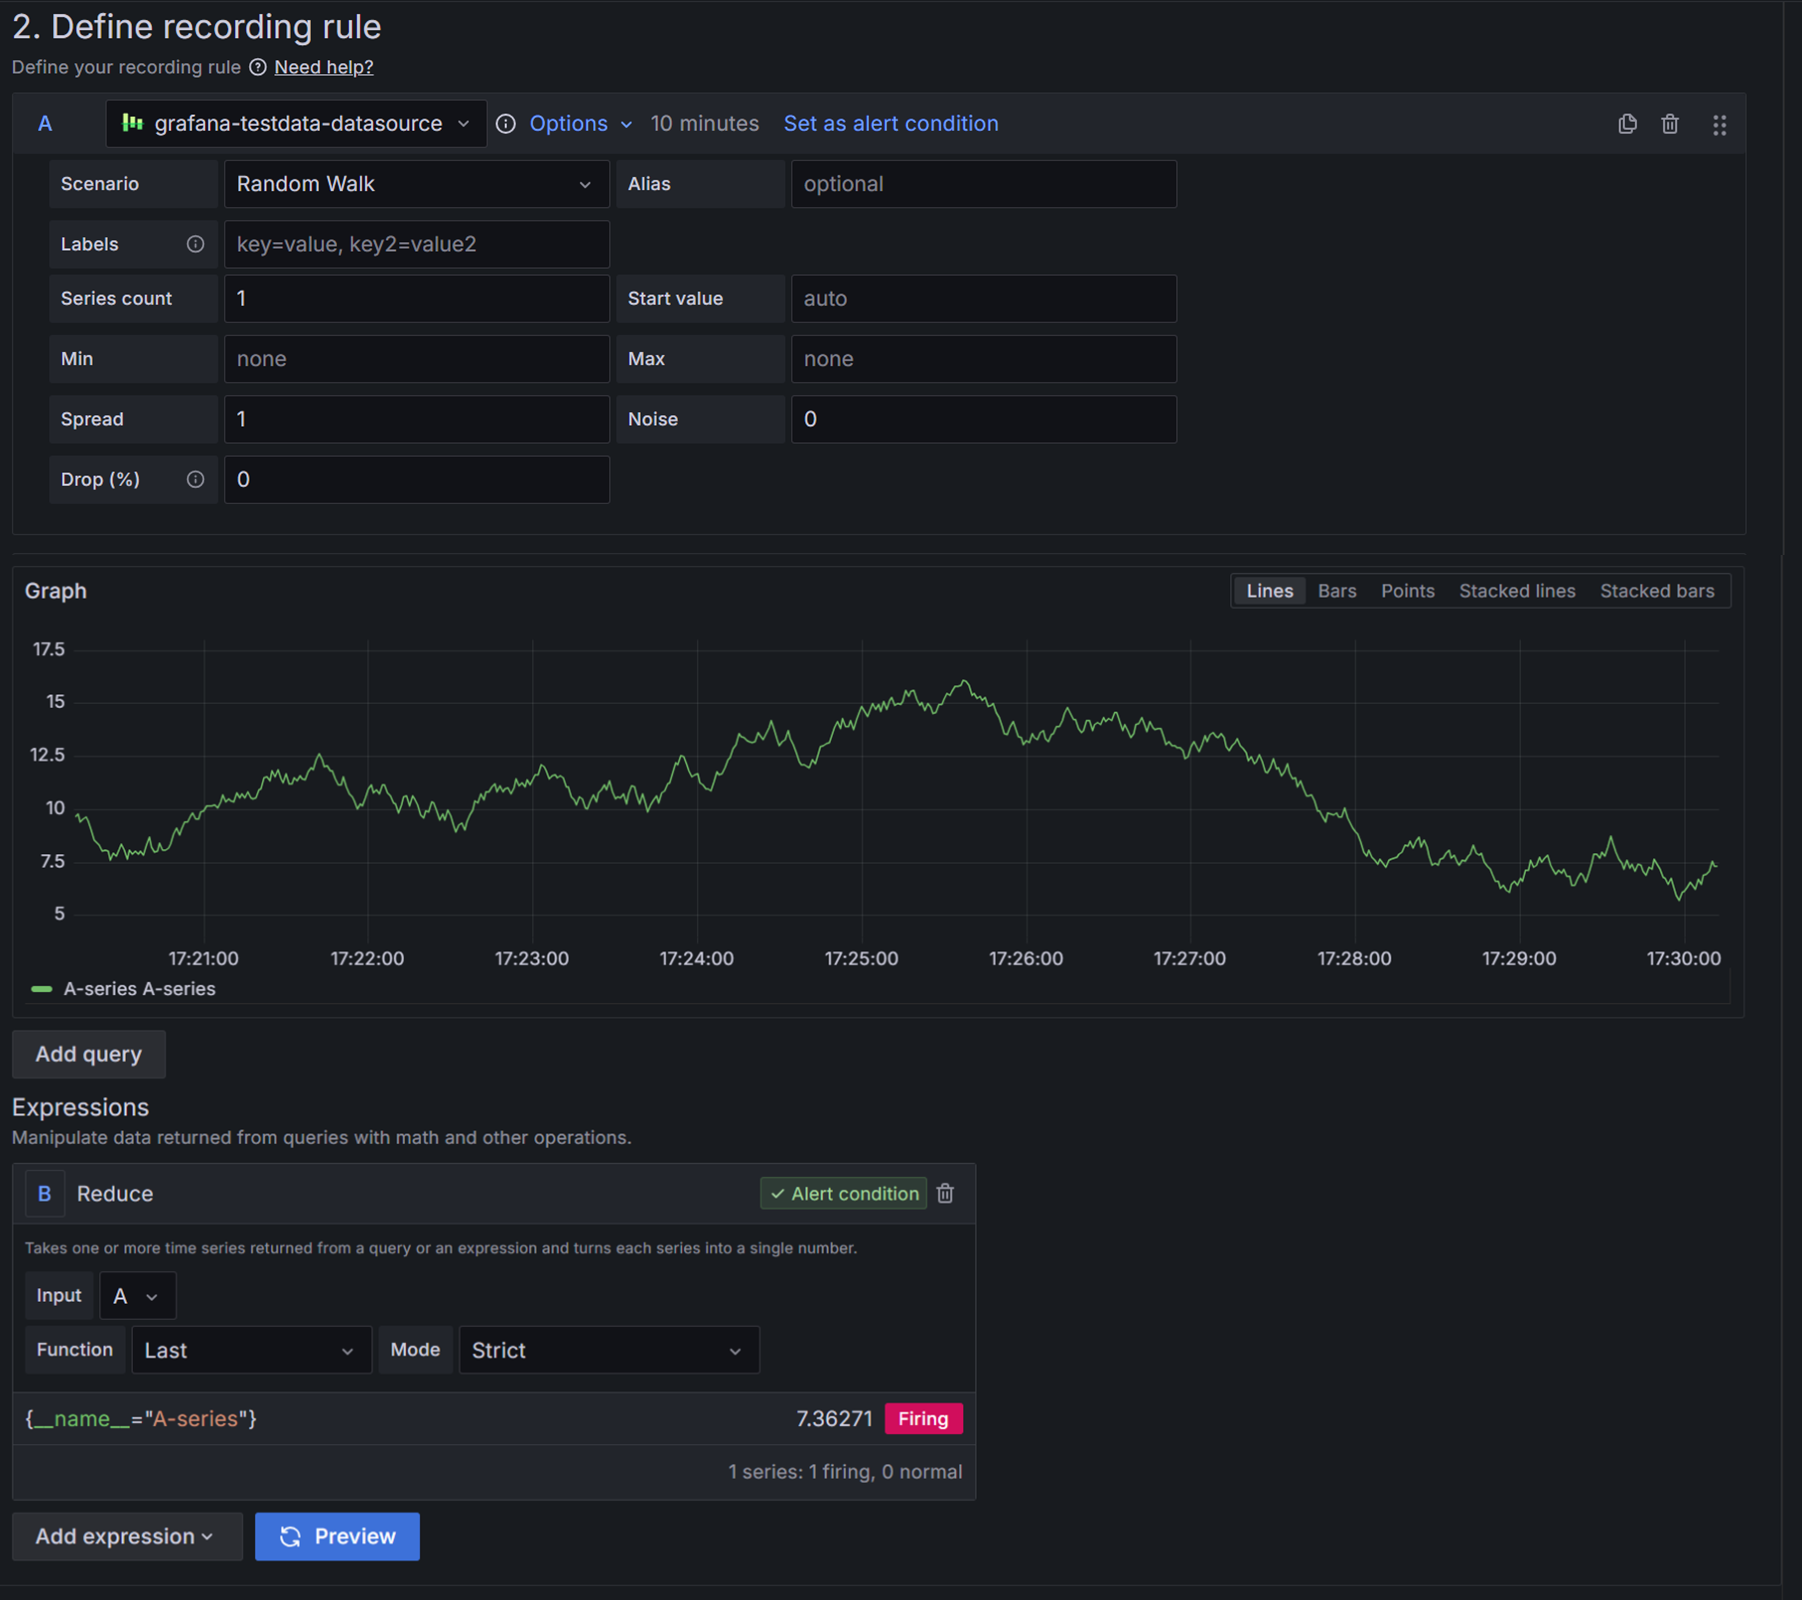
Set an evaluation behavior and optionally add labels.
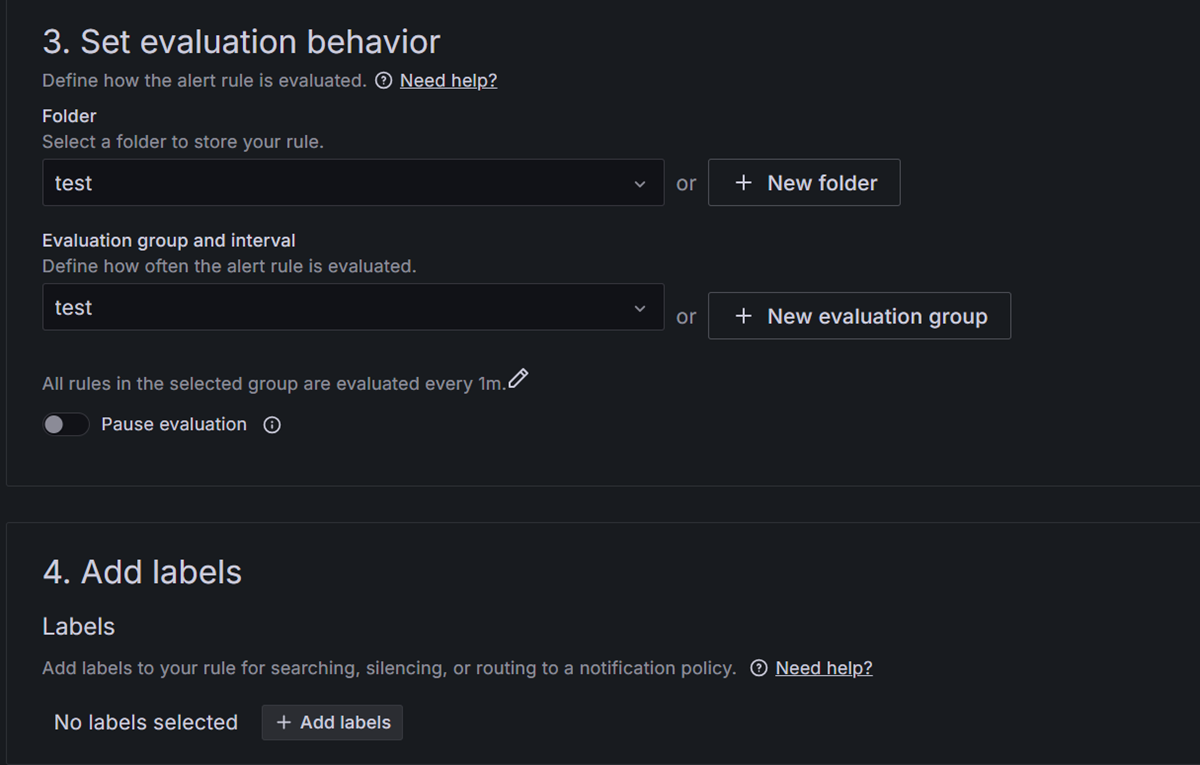
After saving, you can view the details of the recording rule under the folder you selected earlier. Select the View icon to view recorded metrics.

For detailed configuration options see, Create Grafana-managed recording rules.
View recorded Prometheus data (preview)
After you set up the recording rules, you can visualize the recorded Prometheus data in Grafana:
In the Grafana UI, go to Metrics and select the bundled-azure-prometheus data source to view the recorded data.
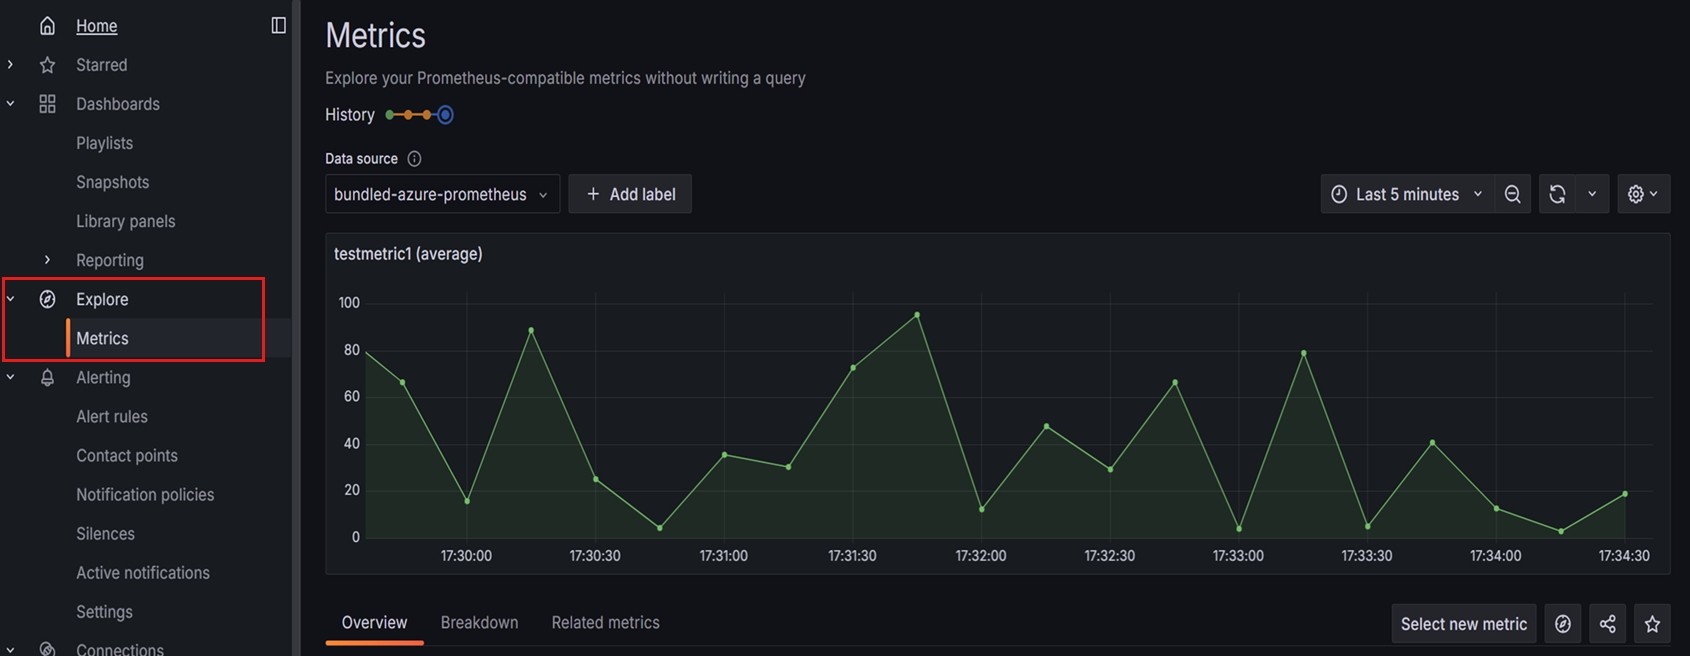
You can now add these recorded metrics to a Grafana dashboard. For detailed steps on creating visualizations with Prometheus data, see Display Prometheus data in Grafana. For more information about editing a dashboard, refer to Edit a dashboard panel.

Tip
If you don't see Prometheus data in your dashboard, check if your Azure Monitor workspace is collecting Prometheus data. For troubleshooting, see Troubleshoot collection of Prometheus metrics in Azure Monitor.
Disable bundled Prometheus (preview)
If you no longer need bundled Prometheus (preview), you can disable it from your Azure Managed Grafana workspace:
In your Azure Managed Grafana workspace, select Integrations > Bundled Prometheus (Preview) from the left menu.
Select Disable > Yes to confirm.
Optionally remove the role assignments previously added in the Azure Monitor workspace:
- In the Azure Monitor workspace resource, select Access control (IAM) > Role assignments.
- Under Monitoring Data Reader, select the row with the name of your Azure Managed Grafana resource. Select Delete > OK.
- Go to the overview page of the Azure Monitor workspace and select the Data collection rules resource.
- Go to Access Control (IAM) > Role Assignments, and under Monitoring Metrics Publisher, select the row with the name of your Azure Managed Grafana resource. Select Delete > OK.
- To continue accessing existing data in the Azure Monitor workspace, consider setting up Azure Monitor Workspace integration in Azure Managed Grafana
Note
Disabling bundled Prometheus removes the integration but doesn't delete existing data in your Azure Monitor workspace.