Note
Access to this page requires authorization. You can try signing in or changing directories.
Access to this page requires authorization. You can try changing directories.
The operations experience lets OT users manage resources such as their assets, devices, and data flows. The operations experience is a web-based user interface that provides a consistent way to manage assets and devices across different Azure IoT Operations sites and instances.
A site is a collection of Azure IoT Operations instances. Sites typically group instances by physical location and make it easier for OT users to locate and manage assets. Your IT administrator creates sites and assigns Azure IoT Operations instances to them. To learn more, see What is Azure Arc site manager (preview)?.
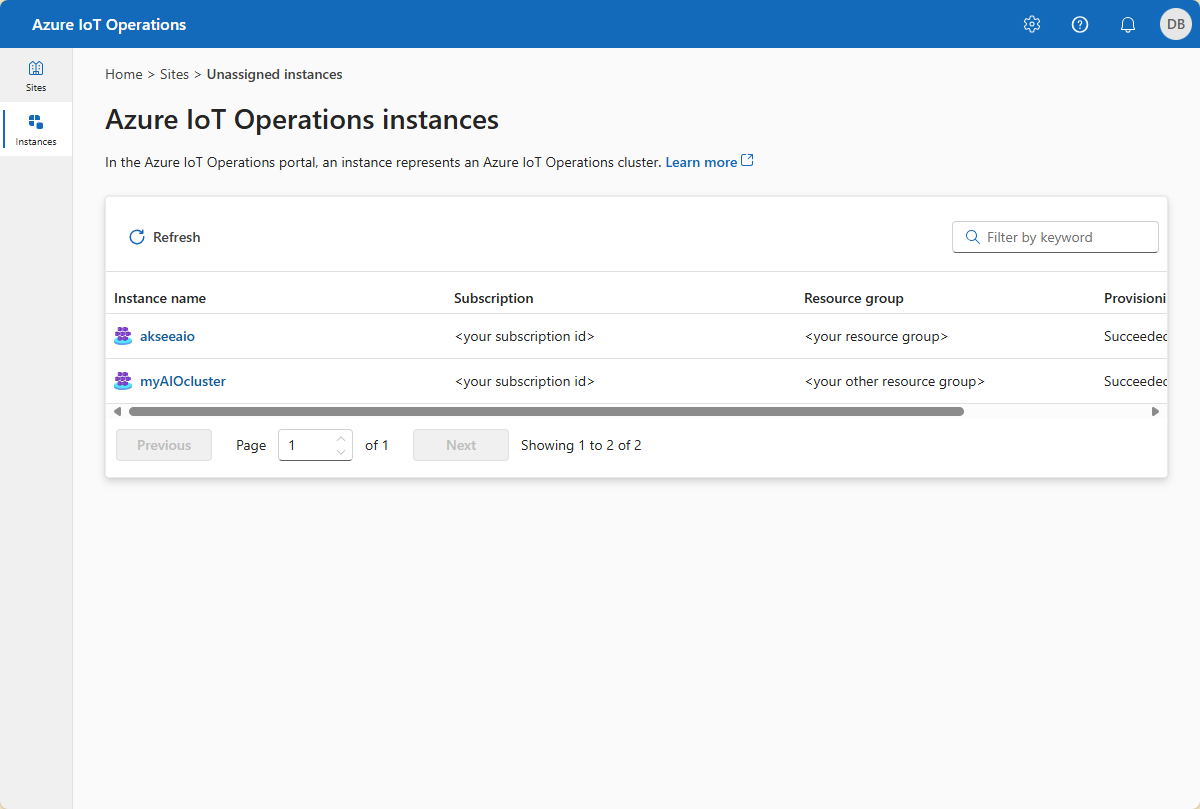
In the operations experience web UI, an instance represents an Azure IoT Operations cluster.
An asset in Azure IoT Operations is a logical entity that you create to represent a physical asset or device. An Azure IoT Operations asset can have custom properties, data points, streams, and events that describe its behavior and characteristics. An asset is associated with one or more devices. Azure IoT Operations stores asset definitions in the Azure Device Registry.
A device in Azure IoT Operations is a logical entity that defines the connections to physical assets or devices. Without a device, data can't flow from a physical device or asset to the MQTT broker. When you configure a device and asset, a connection is established to the physical asset or device and data point values, events, and streams arrive in Azure IoT Operations instance. A device has one or more inbound endpoints. Azure IoT Operations stores device definitions in the Azure Device Registry.
An inbound endpoint is a logical endpoint that you create to represent a physical device or asset. Inbound endpoints have a type, such as OPC UA or ONVIF, that determines the type of physical device or asset to connect to. The available types of inbound endpoints depend on the connector templates the IT admin configured in the Azure portal. Each type of inbound endpoint has its own set of properties that you can configure. For example, an OPC UA inbound endpoint has properties such as the OPC UA server URL, security mode, and security policy.
This article describes how to use the operations experience web UI:
- View sites and instances.
- Import and export devices and assets.
- Use notifications and activity logs.
Prerequisites
To use the operations experience, you need a running preview instance of Azure IoT Operations.
To sign in to the operations experience web UI, you need a Microsoft Entra ID account with at least contributor permissions for the resource group that contains your Kubernetes - Azure Arc instance. You can't sign in with a Microsoft account (MSA). To create a suitable Microsoft Entra ID account in your Azure tenant:
- Sign in to the Azure portal with the same tenant and user name that you used to deploy Azure IoT Operations.
- In the Azure portal, go to the Microsoft Entra ID section, select Users > +New user > Create new user. Create a new user and make a note of the password, you need it to sign in later.
- In the Azure portal, go to the resource group that contains your Kubernetes - Azure Arc instance. On the Access control (IAM) page, select +Add > Add role assignment.
- On the Add role assignment page, select Privileged administrator roles. Then select Contributor and then select Next.
- On the Members page, add your new user to the role.
- Select Review and assign to complete setting up the new user.
You can now use the new user account to sign in to the operations experience web UI.
Sign in
To sign in to the operations experience, go to the operations experience in your browser and sign in by using your Microsoft Entra ID credentials.
Select your site
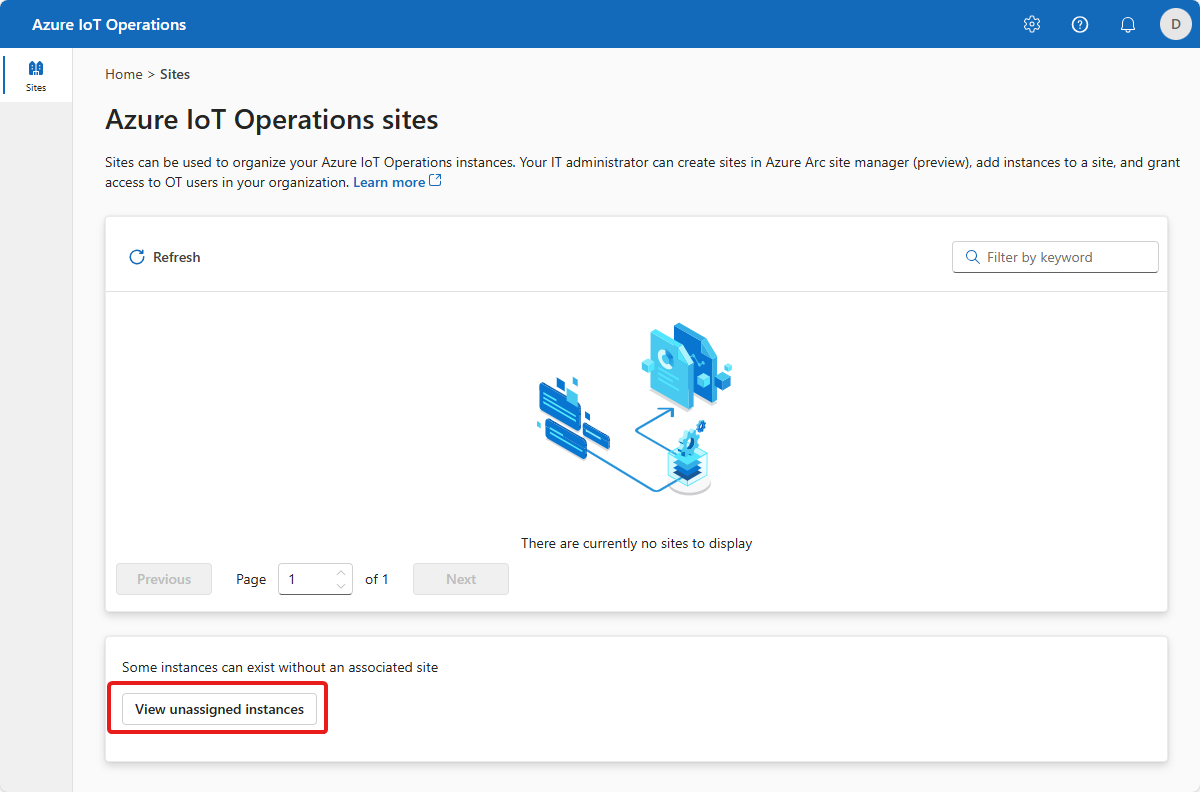
After you sign in, the operations experience displays a list of sites. Each site is a collection of Azure IoT Operations instances where you can configure and manage your assets. A site typically represents a physical location where you have physical assets deployed. Sites make it easier for you to locate and manage assets. Your IT administrator is responsible for grouping instances in to sites. Any Azure IoT Operations instances that aren't assigned to a site appear in the Unassigned instances node. Select the site that you want to use:
Tip
You can use the filter box to search for sites.
If you don't see any sites, you might not be in the right Azure Active Directory tenant. You can change the tenant from the top right menu in the operations experience. If you still don't see any sites that means you aren't added to any yet. Reach out to your IT administrator to request access.
Select your instance
After you select a site, the operations experience displays a list of the Azure IoT Operations instances that are part of the site. Select the instance that you want to use:
Tip
You can use the filter box to search for instances.
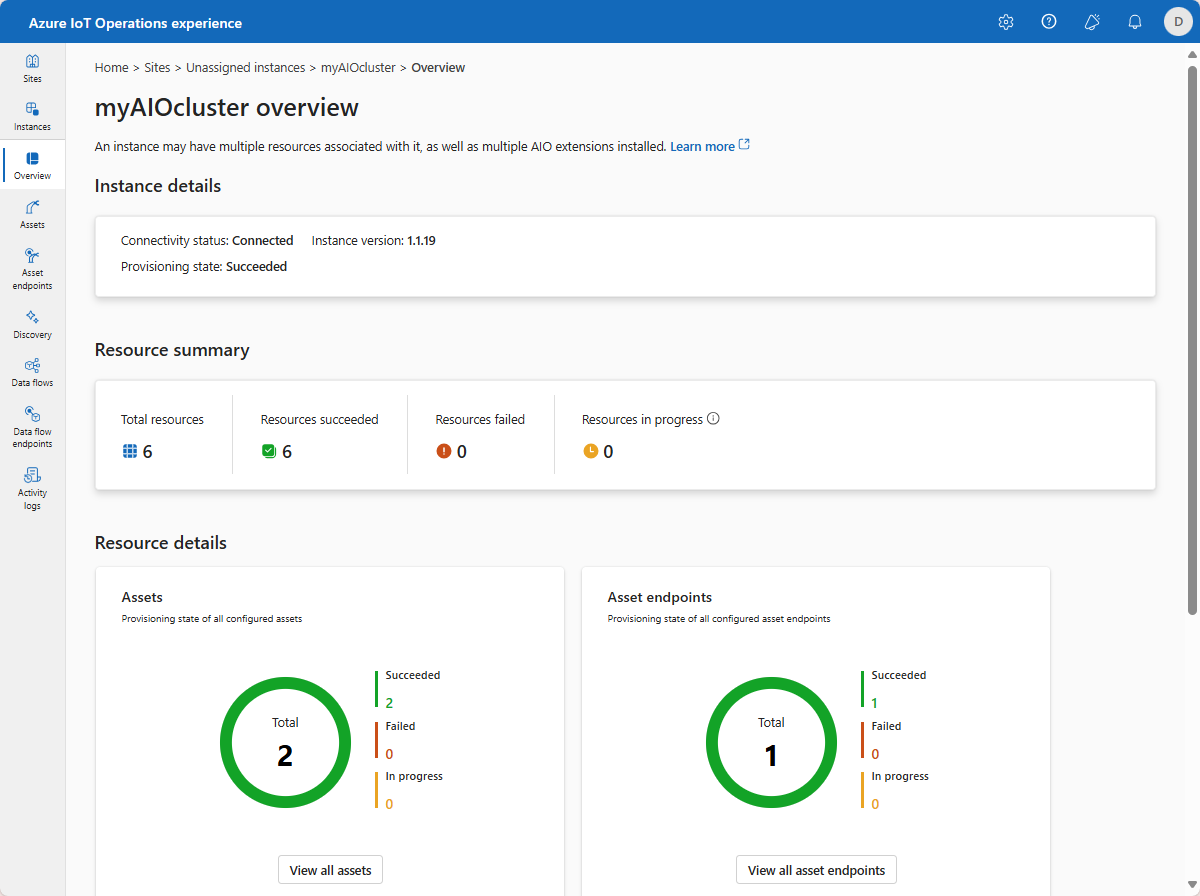
After you select your instance, the operations experience displays the Overview page for the instance. The Overview page shows the status of the instance and the resources, such as assets, that are associated with it:
Notifications
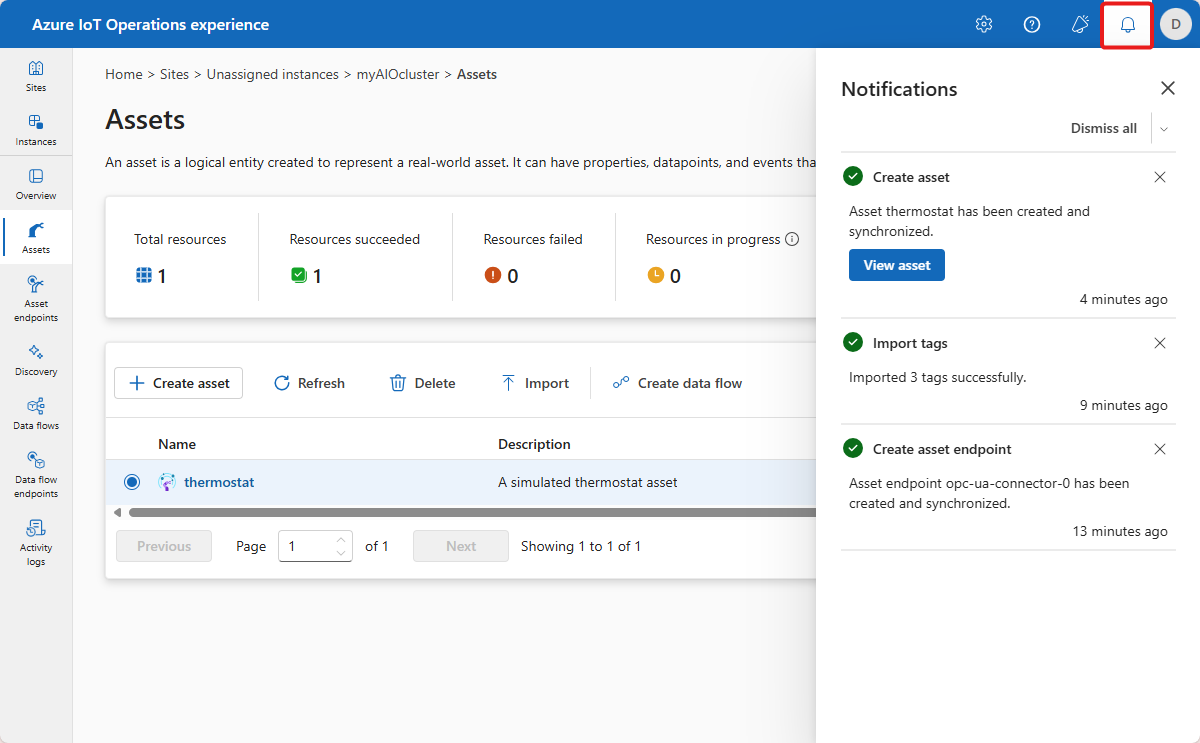
Whenever you make a change to a resource in the operations experience, you see a notification that reports the status of the operation:
View activity logs
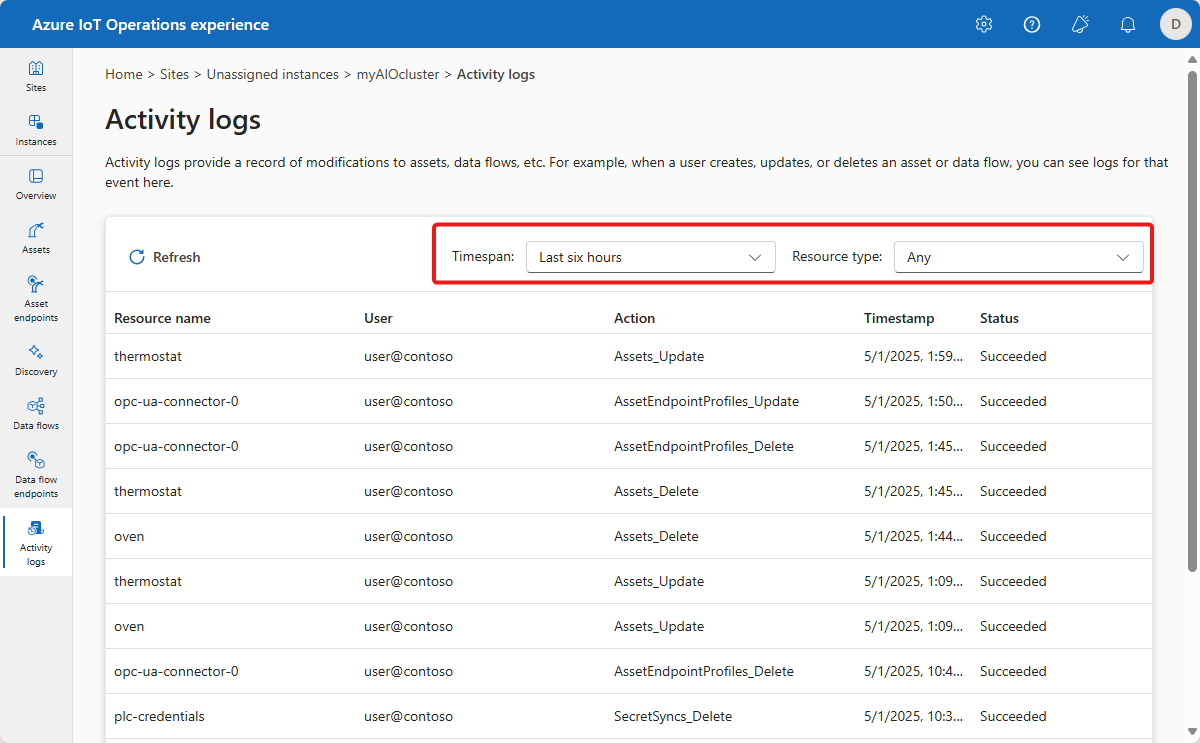
In the operations experience, you can view activity logs for each instance or each resource in an instance.
To view activity logs at the instance level, select the Activity logs tab. You can use the Timespan and Resource type filters to customize the view.
To view activity logs as the resource level, select the resource that you want to inspect. This resource can be an asset, device, or data pipeline. In the resource overview, select View activity logs. You can use the Timespan filter to customize the view.
