Note
Access to this page requires authorization. You can try signing in or changing directories.
Access to this page requires authorization. You can try changing directories.
Note
This capability is in preview and is subject to the Supplemental Terms of Use for Microsoft Azure Previews.
For the Azure resources that you logically organize as applications in an integration environment, you can monitor their health and performance by creating alerts. The integration environment lets you complete the following monitoring tasks:
- Create alerts to monitor and trigger on specific events that happen in Azure resources.
- Monitor all applications and resources in your integration environment from centralized dashboards.
- Trace messages across Azure resources with a single correlation ID.
- Get a full itinerary of message flow for easier troubleshooting.
- Find and monitor API connections in one place.
- Select and resubmit multiple logic app workflow runs in bulk.
- Customize filters for your monitoring needs.
Prerequisites
The Azure account and subscription for the Azure integration environment and Azure resources that you want to monitor.
The Azure integration environment and Azure resources organized into application groups, logically based on the components in your integration solutions.
Note
Your integration environment and all the Azure resources organized as application groups use the same Azure subscription, including any Business Process resources linked your application group. See Supported Azure resources.
An Azure Application Insights resource.
If you don't have an Application Insights resource, see Create an Application Insights resource.
A Log Analytics workspace to use as the centralized telemetry store where application groups send their telemetry. Your dashboards use this store to populate charts.
If you don't have a Log Analytics workspace, you can create or select a workspace for a specific application in your integration environment. Or, you can create the workspace in advance. For more information, see Create a Log Analytics workspace.
Set up the Azure resources in your integration environment to push logs to the same Log Analytics workspace for your Application Insights resource.
For more information, see the following documentation:
Service Documentation Azure API Management - Integrate Azure API Management with Azure Application Insights
- Integrate Application Insights to developer portalAzure Logic Apps Set up and view enhanced telemetry in Application Insights for Standard workflows Azure Service Bus Tracking with Azure Application Insights After the Azure resources in your applications generate and push data into the Log Analytics workspace in Application Insights, you can review that data on various dashboards.
Limitations and known issues
In some scenarios, traces for Azure Service Bus might not appear.
Set up application groups with a Log Analytics workspace
Your applications need a centralized telemetry store where they can send the data necessary to populate dashboards. To specify the Log Analytics workspace as the store, follow these steps:
In the Azure portal, open your integration environment resource.
On the resource sidebar, under Environment, select Applications.
On the Applications page, select the application that you want to set up.
On the application sidebar, select Resources. Under Log analytics workspace, select Set up.
On the Add workspace pane, for Default log analytics workspace, select your workspace, and then select Save.
Set up alerts
Alerts help you find and address issues before your customers notice them. When Azure Monitor collects log data indicating that your infrastructure or application might have a problem, alerts proactively notify you about the problem.
You can create an alert for any metric or resource that emits log data that's supported by Azure Monitor. For more information about available alert types, see What are Azure Monitor alerts?
The following table shows the default severity levels for the available alerts:
| Alert | Default severity level |
|---|---|
| Critical | 0 |
| Error | 1 |
| Warning | 2 |
| Informational | 3 |
| Verbose | 4 |
For more information, see Manage alert rules.
In the Azure portal, open your integration environment resource.
On the resource sidebar, under Environment, select Applications.
Select the application where you want to add alerts.
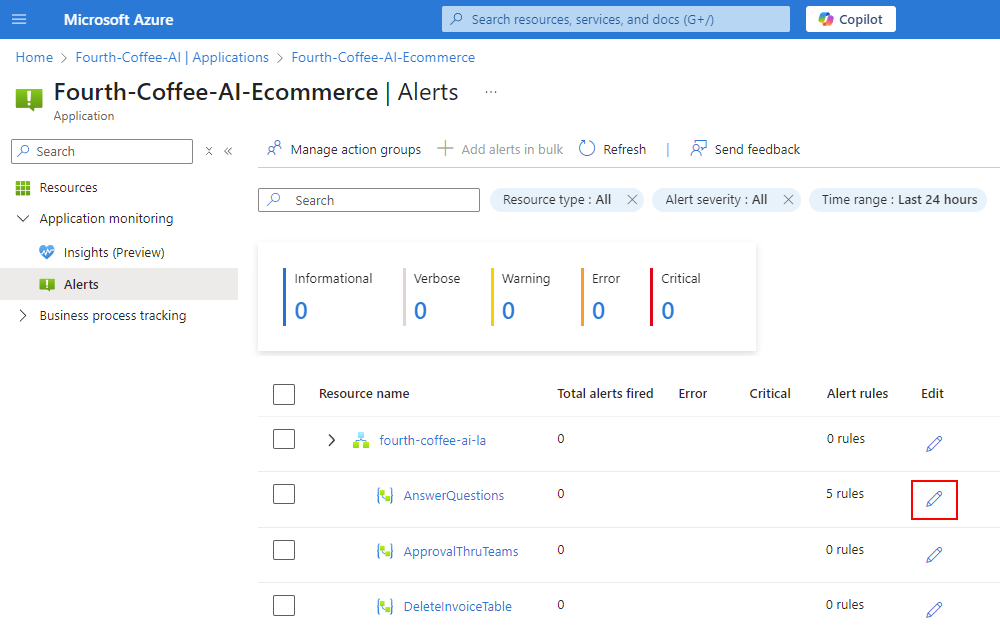
On the application sidebar, under Application monitoring, select Alerts.
On the Alerts page, in the Resource name column, find the parent resource or expand the parent to select a child resource.
For example, you can select a workflow for a logic app in Azure Logic Apps, an API in API Management, or a queue for Azure Service Bus.
Tip
To create alerts for multiple resources with the same type, follow these steps:
On the Alerts page, under Resource name, select resources that have the same type.
On the Alerts toolbar, select Add alerts in bulk.
Skip the next step, and continue with the step starting with the Alert rules tab.
In the Edit column, select Edit for the parent or child resource.
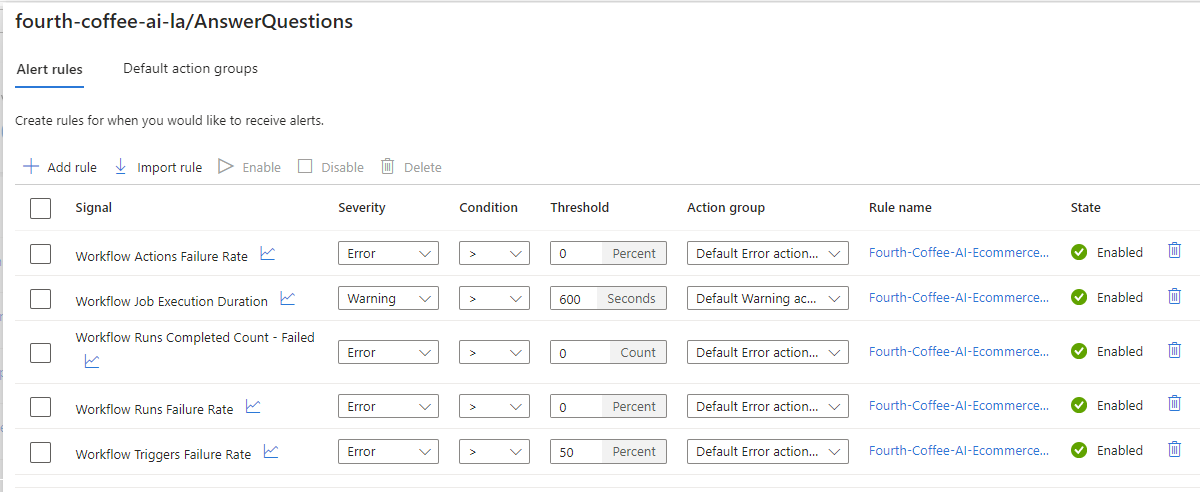
On the Alert rules tab, select either Add rule, or if no rules exist, select Start with recommended rules. Set up the rule that you want for monitoring the resource.
The following example shows some workflow alert rules that trigger based on various threshold conditions:
For more information, see Create alert rules for Azure resources.
When you're done, select Save.
Continue with the next section to set up notifications when alerts trigger.


Send notifications when alerts trigger
You can optionally create and map action groups to your alerts based on alert severity, so that you get notifications when alerts trigger. An action group is a collection of notification preferences and actions, which you can map to the alerts that you create.
In the Azure portal, open your integration environment resource and the application with the alerts where you want to create and set up action groups.
On the application sidebar, under Application monitoring, select Alerts.
On the Alerts toolbar, select Manage action groups.
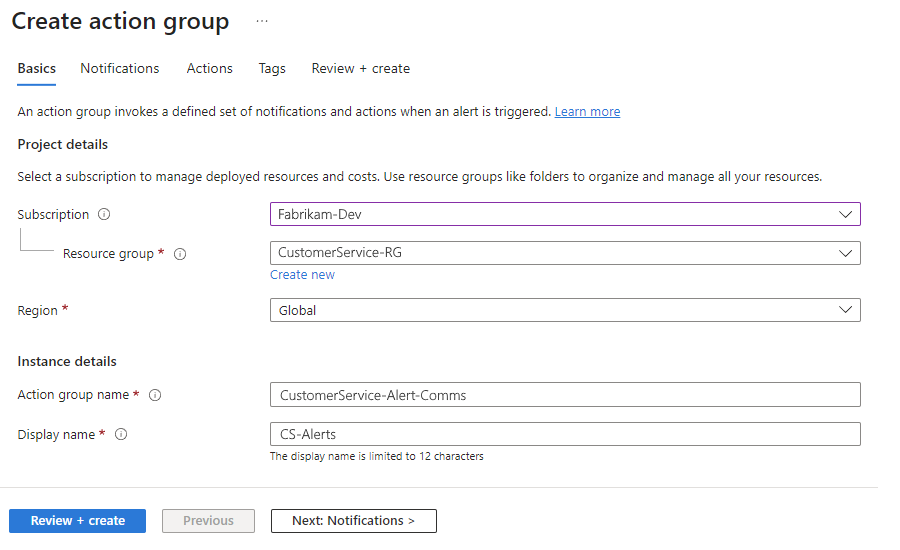
On the Action groups toolbar, select Create.
Follow the general steps to create an action group, for example:
When you're done, return to the Alerts page for your application group.
On the Alerts page, in the Resource name column, find the parent resource or expand the parent to select a child resource.
In the Edit column, select Edit for the parent or child resource that has the rules that you want to map.
On the Default action groups tab, for each alert severity level, select the action group for sending the notifications that you want, for example:
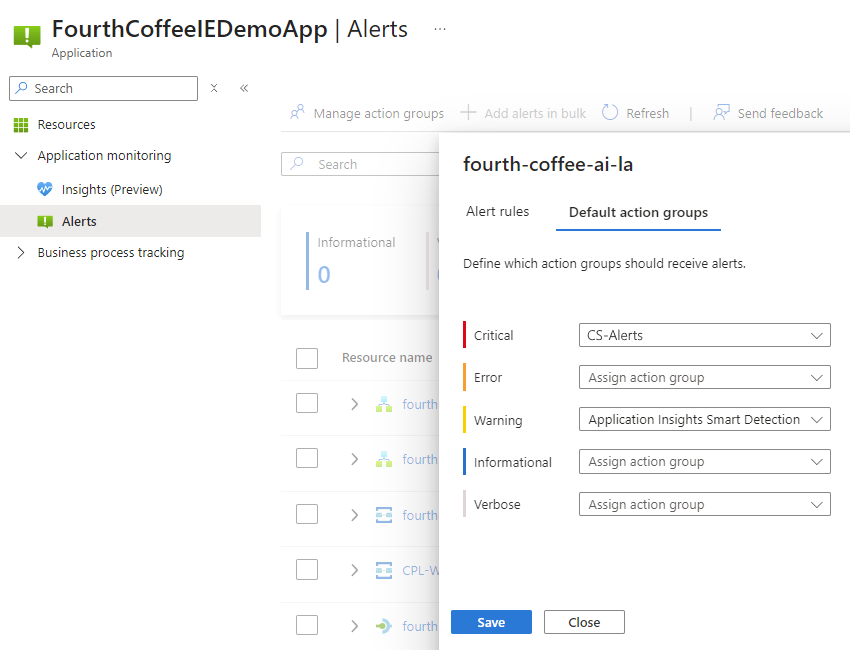
When you're done, select Save.


View health for a specific application
The visualizations for application-specific dashboards are built on Azure Workbooks in Azure Monitor and extensible based on your business needs.
In the Azure portal, open your integration environment resource.
On the resource sidebar, under Environment, select Applications.
On the Applications page, select the application that you want.
On the application sidebar, select Insights.
Under the Insights toolbar, select the time range that you want to review.
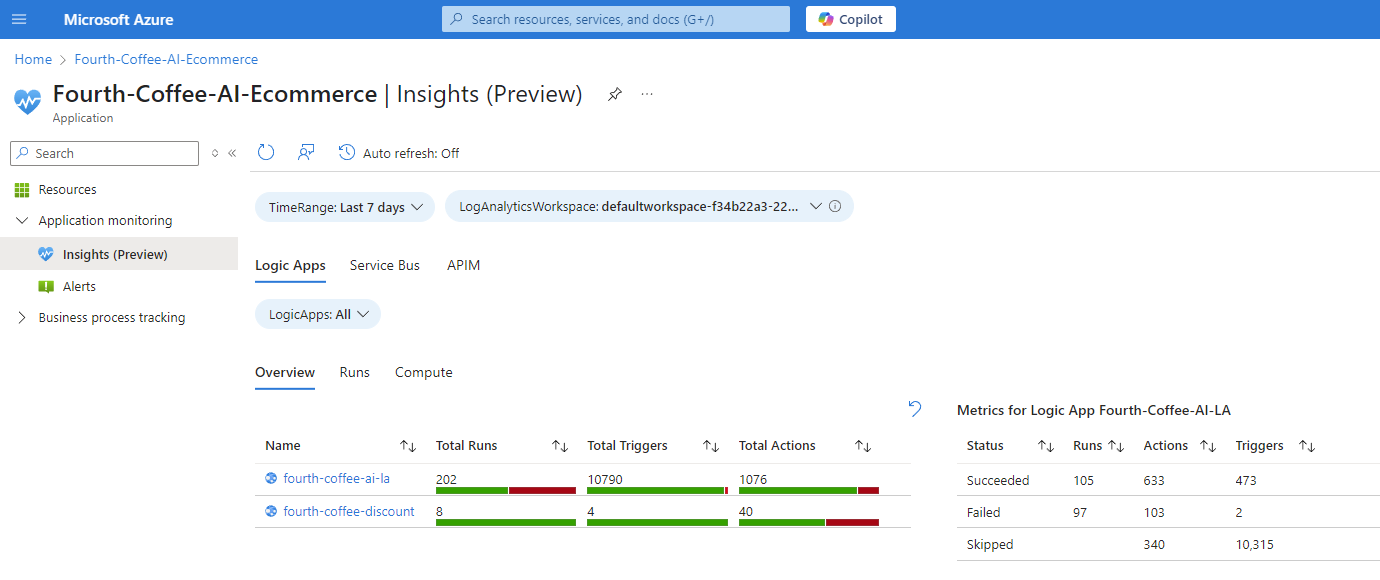
For the selected duration, the Insights page shows the resources in your application based on the Azure service category, such as Logic Apps, Service Bus, and APIM.
Select a service category, for example, Logic Apps.
Select the Overview tab to get aggregated health information for all logic app resources in an application.
The tab shows tables with the following information:
- Total runs, total triggers, and total actions for each logic app.
- Total runs, total actions, and total triggers, based on status.
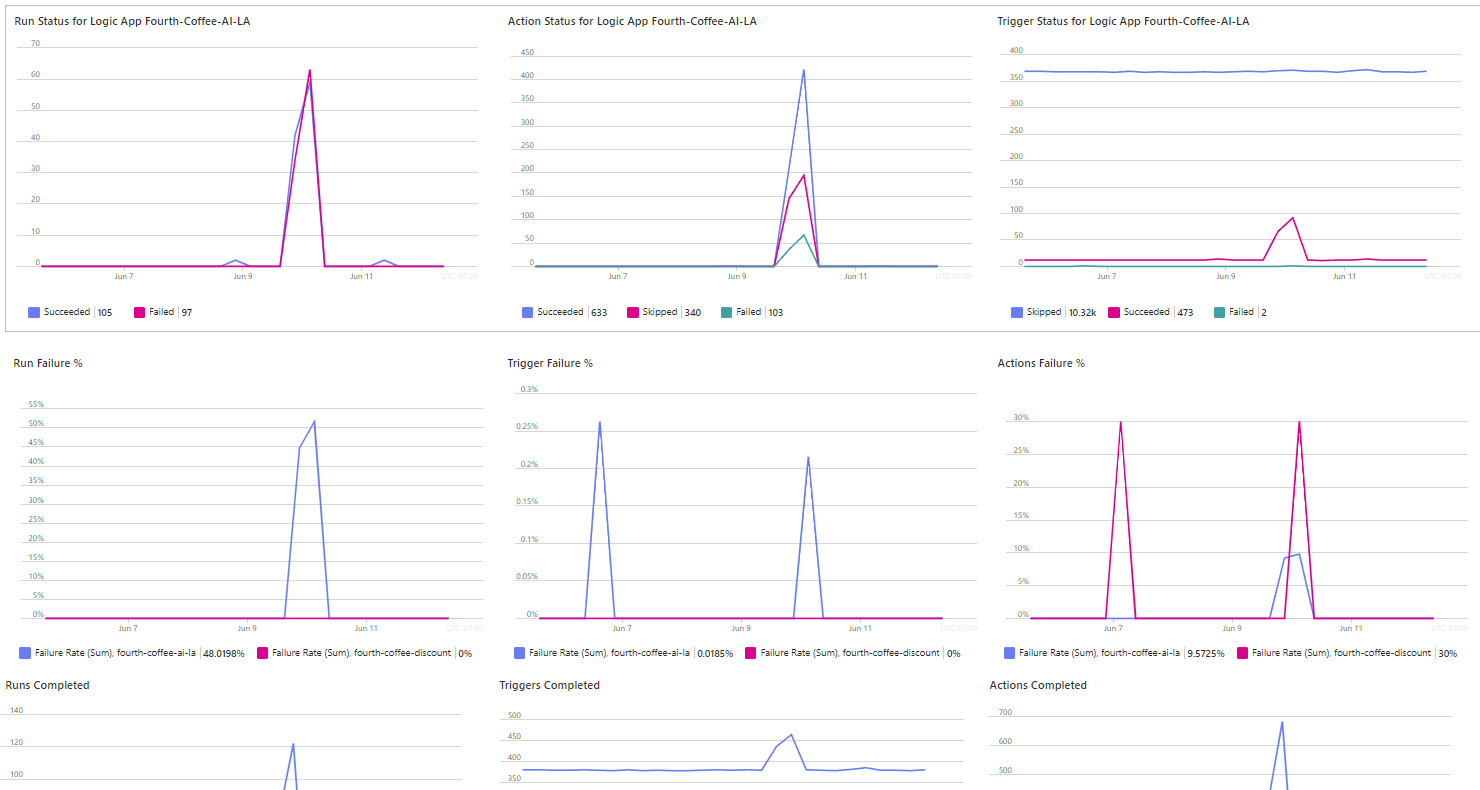
Scroll down the page to view trend charts that show logic app workflow runs and their trends over the selected duration.
The trend charts show the following information:
- Status for workflow runs, actions, and triggers.
- Failures for workflow runs, triggers, and actions.
- Completed workflow runs, triggers, and actions.
To troubleshoot specific workflow runs, select the Runs tab.
The Runs tab shows the logic apps, associated workflows, total workflow runs, and failure rates for triggers, workflow runs, and actions, for example:
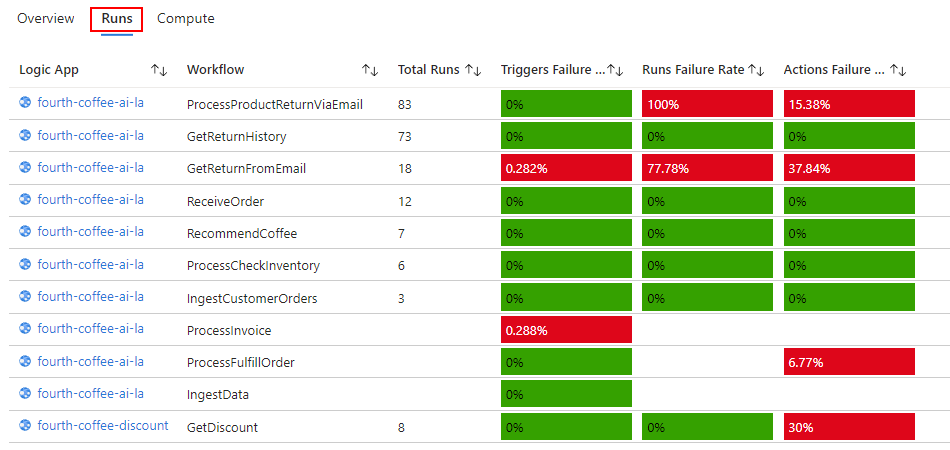
To get the run history and details for a specific workflow, select the row for that workflow.
Under the table with the failure rates for different workflows, a runs table appears for the selected workflow, for example:
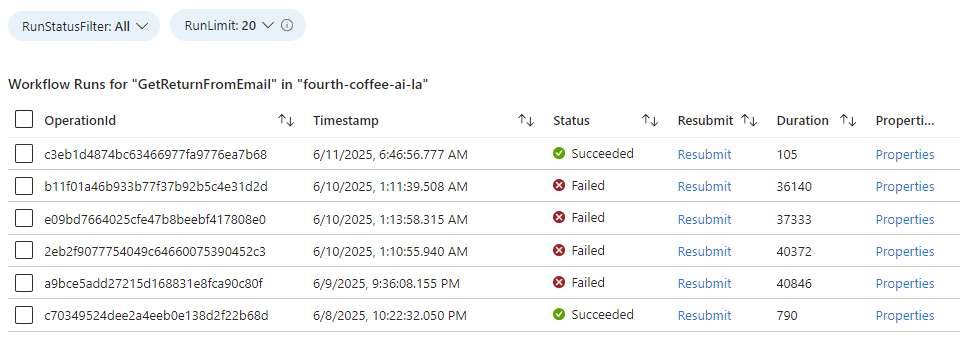
This runs table includes relevant details about each workflow run. Each row has a unique correlation ID, which tracks the data flow across all Azure resources in an application.
The following list describes other tasks that you can perform based on the metrics that you want to review:
Filter the table by run status so that you can more easily focus on specific scenarios.
For properties and other information about a specific run, in the Properties column, select the Properties link.
To view the processing hops for a message, select the row for a specific run.
The opened table provides a comprehensive view for the message's journey through Azure resources in the application. Azure stitches together the timelines for message processing across all Azure resources in the application by using the correlation ID.
To resubmit a failed run, choose an option:
Single run: In the Resubmit column, select the Resubmit link.
Multiple runs: Select the runs that you want, and then select Resubmit Selected Runs.


