Note
Access to this page requires authorization. You can try signing in or changing directories.
Access to this page requires authorization. You can try changing directories.
Azure DevOps Services | Azure DevOps Server 2022 - Azure DevOps Server 2019
To keep your team and stakeholders informed and projects on track, actionable dashboards in Azure DevOps are essential. This article explores how to design effective dashboards that align with your business objectives. You can create dashboards for projects that serve multiple teams or a specific team. You can also add widgets on the dashboard to show content for the active signed-in user.
Prerequisites
| Category | Requirements |
|---|---|
| Access levels | - Project member. - At least Basic access. |
| Permissions | Anyone with access to the project, including Stakeholders, can view Analytics views. For more information about other prerequisites regarding service and feature enablement and general data tracking activities, see Permissions and prerequisites to access Analytics. |
| Services | Azure Boards enabled. If Azure Boards is disabled, Analytics views doesn't display. Re-enable Azure Boards for individual users or for the entire organization. |
| Category | Requirements |
|---|---|
| Access levels | - Project member. - At least Basic access. |
| Permissions | Anyone with access to the project, except those granted Stakeholder access, can view Analytics views. For Stakeholders: View Analytics permission set to Allow. - For more information, see Grant permissions to access the Analytics service. - For more information about other prerequisites regarding service and feature enablement and general data tracking activities, see Permissions and prerequisites to access Analytics. |
| Services | - Azure Boards enabled. If Azure Boards is disabled, Analytics views doesn't display. Re-enable Azure Boards for individual users or for the entire organization. - Analytics service enabled. You must be an account owner or a member of the Project Collection Administrators group to enable the service. |
Choose the dashboard focus
To determine the focus of a dashboard, it's crucial to identify the information needs of the intended audience. The goal is to create dashboards that provide insights and help identify actions to take.
The focus of your dashboard determines whether you create a team or project dashboard, as shown in the following table.
| Focus | Description | Dashboard type |
|---|---|---|
| Stakeholder | Share team and organizational goals, information, links to work item templates to create bugs or new feature requests, and more. | Project or Team |
| Personal | Help each team member to focus on their backlog and current work. | Project or Team |
| Team | Provide information for a team to monitor status, track progress, identify bottlenecks, and ensure backlog items are well defined. | Team |
| Sprint | Review status during daily stand-ups to ensure the team is on track to meet sprint goals and address any issues that affect the goals. | Team |
| Release | Monitor status and track progress toward a major release that might involve contributions from several teams. | Project |
| Testing and deployment | Monitor continuous integration, builds, deployments, and releases. | Project or Team |
Choose the dashboard type and create it
When you create a team, Azure DevOps creates a Team dashboard by default titled Overview, which has no widgets. You can rename the dashboard later and add widgets for your team needs.
When you manually add a dashboard, you need to decide the type of dashboard to create:
A Project dashboard includes information for more than one team or if the content isn't team-focused.
A Team dashboard includes team-specific widgets.
To see the configurable widgets for a single team or multiple teams, review the Out Of Box widget catalog.
After you determine the dashboard type, create the dashboard. You can also streamline the process by copying another team's dashboard and modifying the widgets for the needs of your team.
After you determine the dashboard type, create the dashboard.
Share the dashboard with your team and stakeholders
After you create a dashboard, share the URL with your team and stakeholders. Specify the actions you want them to take and request feedback to make it more actionable and insightful.
The following conditions apply for viewing and editing dashboards:
All project members can view all dashboards unless specific restrictions are applied by using a security command line tool. For more information, see Security namespace and permission reference - DashboardsPrivileges.
All project members with Basic access can create a dashboard.
All team members with Basic access can create a team dashboard unless permissions are revoked. For details, see Set default team dashboard permissions.
All team members can edit all team dashboards unless the Edit dashboard permission is revoked for a specific dashboard or all team dashboards. For more information, see Set dashboard permissions.
Some dashboard charts and widgets contain data subject to specific data-level permissions and access. For more information, see FAQs on Azure DevOps dashboards, charts, and reports.
Fine tune dashboards for different scenarios
After your dashboard is in use, you can make adjustments based on feedback. Update queries as needed to refine data results. Periodically review your dashboards to ensure they deliver the information you, your team, and stakeholders need.
The following sections describe several dashboard scenarios and suggestions for fine-tuning.
Stakeholder dashboard
Stakeholders include any project members interested in your work. To create a dashboard that supports your stakeholders, use a combination of Markdown (.md) widgets and team-focused widgets that address stakeholder concerns:
- Team goals
- Team information
- Team members and key contacts
- Links to work item templates
- Team guidance linked to wiki content
Personal dashboard
A personal-focus dashboard allows each team member to see their own work assignments, other work they're following, or work where they're mentioned. You create a personal dashboard by using the Assigned to me widget and other query tiles or charts that reference an Assigned To = @Me query clause.
The following image shows a personal dashboard titled My Work Focus with several widgets that support the signed-in user:
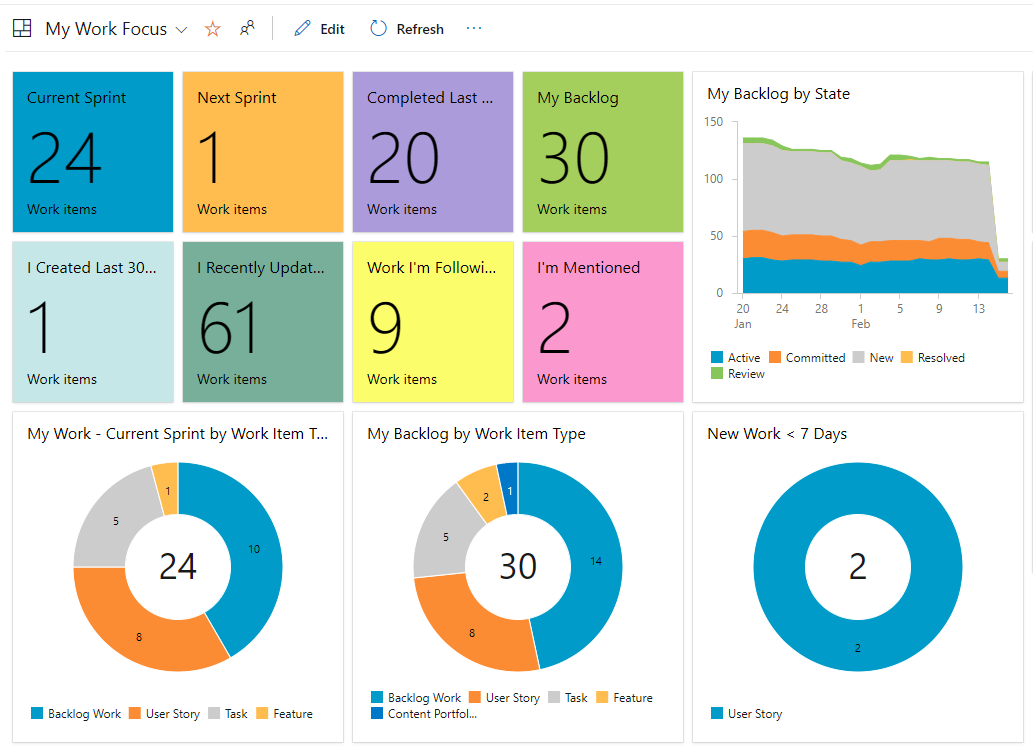
The example dashboard uses the following widgets:
- Current sprint: Work assigned to
@Mefor the current sprint. - Next sprint: Work assigned to
@Mefor the next sprint. - Completed last sprint: Work completed last sprint assigned to
@Me. - My backlog: Work assigned to
@Menew, proposed, or active. - I created last 30 days: Active work with the following clauses:
Created By = @MeandCreated Date >= @Today-30. - I recently updated: Active work for the
ID In @MyRecentActivity. - Work I'm following: Active work for the
ID In @MyFollows. - My backlog state: Stacked area chart showing work assigned to
@Mefor the past four weeks (query chart). - My work - Current sprint by work item type: Active work by type assigned to
@Mefor the current sprint (query chart). - My backlog by work item type: Work assigned to
@Meby type (query chart). - New work < 7 days: Active work assigned to
@MeandCreated Date >= @Today-7(query chart).
The dashboard user can select any query tile or widget to quickly navigate to the query and view a complete list of work items. To support this functionality, consider adding the following widgets to the personal-focus dashboard:
- New work item: Create new work items.
- Work links: Access links to a team's Backlog, Board, current sprint Taskboard, and the queries page.
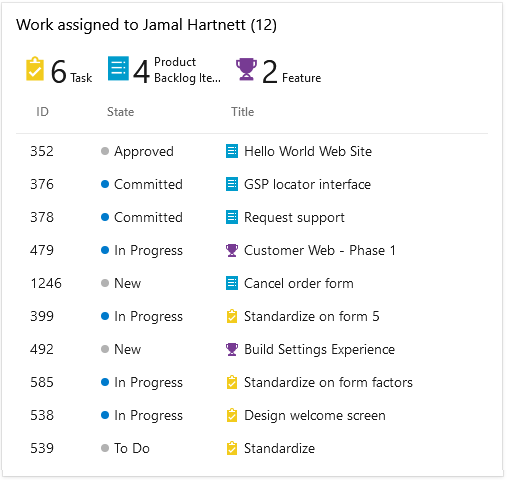
- Assigned to me: View a list of work items assigned to the active signed-in user.
The following image shows a personal dashboard that lists the work assigned to the signed-in user:
To learn how to construct the queries prepared for these examples, see Example query charts.
Team dashboard
A team dashboard helps members meet goals, monitor status, track progress, identify bottlenecks, and ensure backlog items are well defined. You create a team dashboard by including one or more of the following team-scoped widgets:
- Cumulative flow diagram (CFD) chart: Monitor the flow of work items and track work item count by sprint stages.
- Velocity metrics: Track the team's capacity to deliver work sprint after sprint.
- Cycle time: Add time measurements to track how long it takes your team to complete work items.
- Lead time: Add time measurements to track the time to create through the time to complete for work items.
Velocity helps teams understand how well they're planning and executing sprints. Lead and cycle time show the average time for work to move from inception to completion.
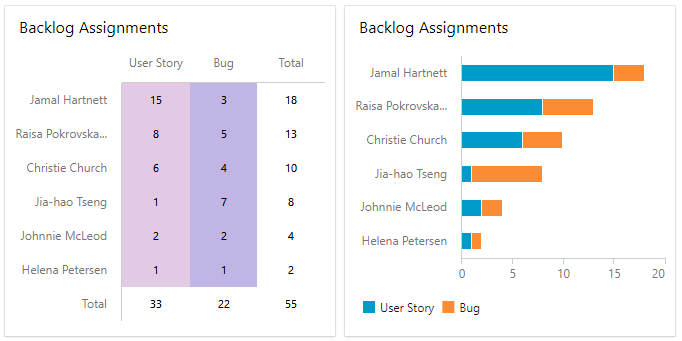
Consider adding a pivot table so users can quickly see the number of work items and their assignments. Use these charts to determine if the team needs to better balance the workload.
Many teams manage code, tests, builds, and releases by using Azure DevOps. To support these tasks, add the following widgets to your team dashboard:
- Code Tile: Include a summary of the contents of a code folder or Git repository.
- Test Results Trend (Advanced): Add near real-time visibility of test data for builds and releases.
- Pull Request: Show the active pull requests (PRs) requested by team members or requested by/assigned to the signed-in user.
- Build History: Add a histogram of all builds run for a specific build pipeline.
- Deployment status: Show the deployment status and test pass rate for specific build pipelines.
Sprint dashboard
Azure DevOps offers several sprint and team-specific widgets to track sprint progress, including Sprint overview, Sprint capacity, and Sprint burndown. You can show the Sprint capacity when your team tracks work by using tasks and sets the Sprint capacity.
The following image shows a sample sprint-focus dashboard:
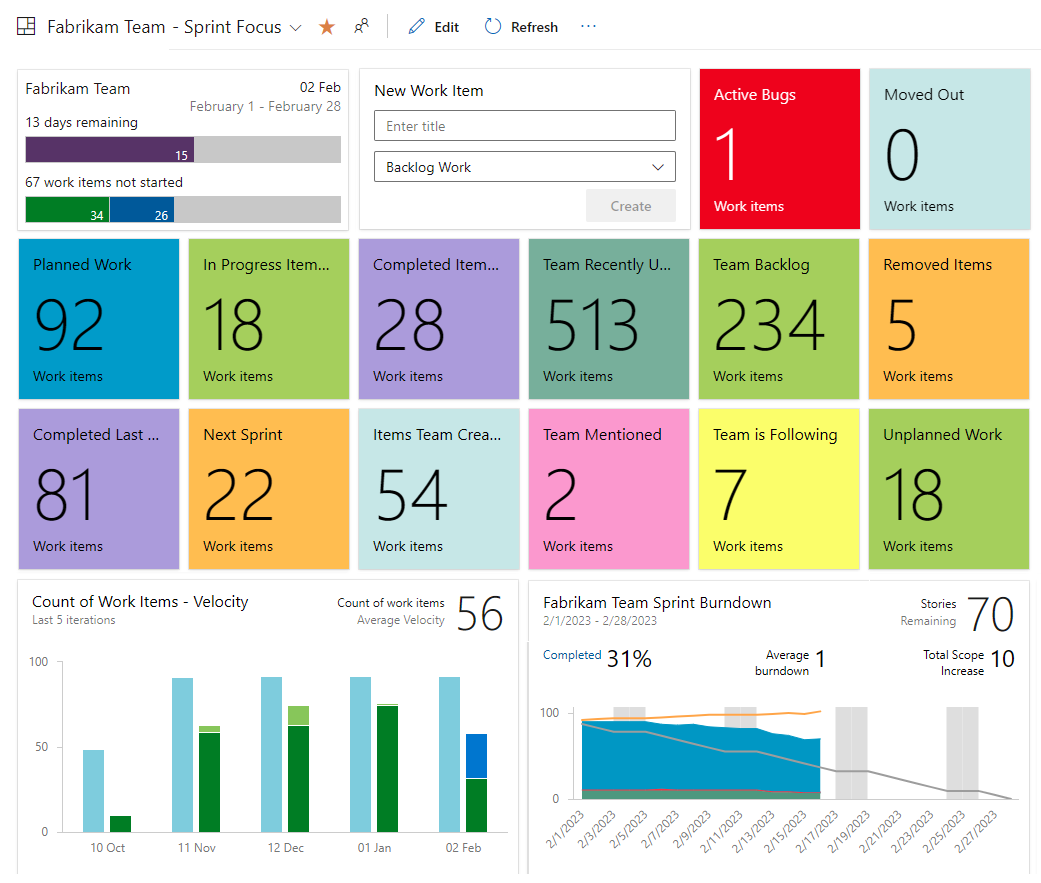
The example dashboard includes several query tiles and the following widgets:
- Sprint Overview: Chart the sprint progress as a count of story points or number of work items.
- New Work Item: Provide the ability for users to add work items directly from the dashboard.
- Velocity metrics: Track the team's capacity to deliver work sprint after sprint.
- Sprint Burndown: Monitor team progress by showing the work remaining for the sprint.
Release dashboard
Major software releases often involve contributions from multiple teams. Release burndown and burnup charts help product managers track progress across teams. These charts are highly configurable. You can choose teams, backlog work items or work item types, field criteria, countdown metrics, and time intervals. For more information, see Configure a burndown or burnup widget.
Note
Analytics-based charts use the WorkItemsSnapshot EntitySet, which models data as daily snapshots. Data aggregates based on assignments made on the date they're assigned. To filter a Burndown/Burnup widget by field or tag assignments, assign them before the period you want to monitor. Otherwise, the widget doesn't register them until the date they're applied.
Testing and deployment dashboard
Many teams have a dedicated dashboard to track the progress of tests, builds, and deployments. You can create a dashboard focuses on testing and deployments by adding the following widgets:
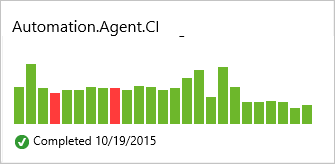
- Build History: Add a histogram of all builds run for a specific build pipeline.
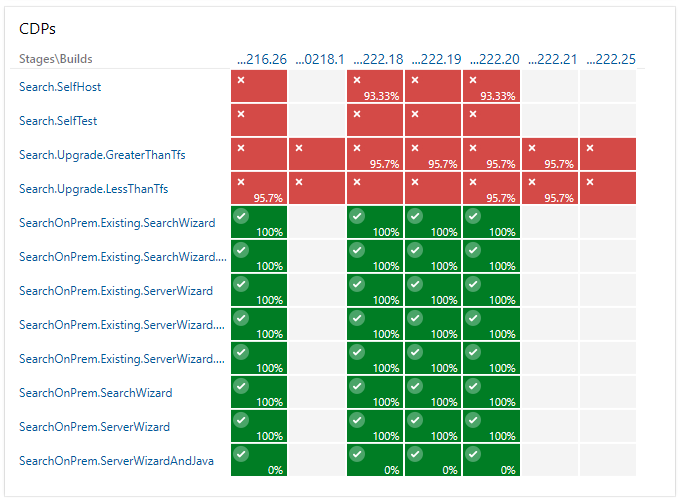
- Deployment status: Show the deployment status and test pass rate for specific build pipelines.
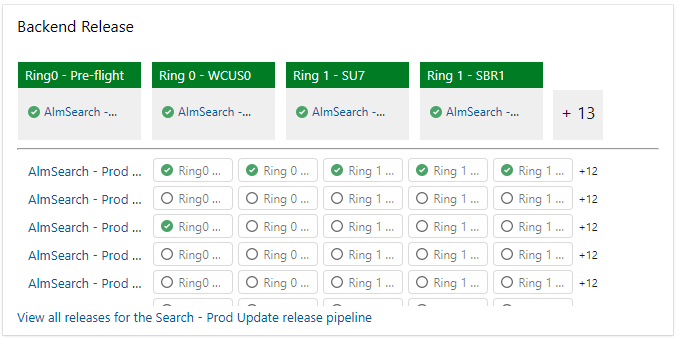
- Release Pipeline Overview: Show the status of stages in a release pipeline.
- Requirements quality: Show a mapping of the test requirements and latest test results.
The following image shows an example of Build History widget output on a dashboard:
The following image shows an example of Release pipeline overview widget output on a dashboard:
The following image shows an example of Deployment status widget output on a dashboard:
Extend your dashboard visibility
Extend the visibility of your dashboard by adding boards and dashboards as tabs to your Teams channel. For more information, see Create work items - Configure Azure DevOps tabs in Microsoft Teams.