Note
Access to this page requires authorization. You can try signing in or changing directories.
Access to this page requires authorization. You can try changing directories.
You can now get GitHub Secret Protection and GitHub Code Security as standalone products in Azure DevOps. Secret Protection provides access to secret scanning, push protection, and security overview experiences. Code Security provides access to all dependency scanning, code scanning, and security overview experiences.
In Test Plans, we are releasing new Test Plans directory to help you stay organized and save time. Now you can manage test plans more efficiently, having greater control over your workspace and reducing repetitive tasks.
Check out the release notes for details.
GitHub Advanced Security for Azure DevOps
General
- Restrict Personal Access Token (PAT) Creation Organization Policy now in Public Preview
- Removal of expired Azure DevOps OAuth Apps
- New Microsoft Entra OAuth scopes
- Request Access URL availability
Azure Pipelines
- Managed DevOps Pools - Image Deprecations
- New Triggers page
- StringList parameter type
- See the full YAML code of a pipeline run
Azure Test Plans
- Introducing New Test Plans Directory
- Advanced Test Case Result History
- View Test Case State in Execute Tab
- Default resume for paused test case
GitHub Advanced Security for Azure DevOps
GitHub Advanced Security is now available as GitHub Secret Protection and Code Security for Azure DevOps
GitHub Secret Protection and GitHub Code Security can now be purchased as standalone products on Azure DevOps for new customers.
Secret Protection provides access to secret scanning, push protection, and security overview experiences. Code Security provides access to all dependency scanning, code scanning, and security overview experiences.
All existing Advanced Security customers can continue using the bundled product experience without disruptions. If you're a current Advanced Security customer and interested in switching to the standalone products, contact Azure DevOps support via the Azure Portal. You can file a support ticket for the GitHub Advanced Security for Azure DevOps service and select Billing migration from bundled to standalone products as the problem type.
For more information on these products, see the Dev Blog.
General
Restrict personal access token (PAT) creation organization policy now in public preview
We’ve introduced a new organization-level policy in Azure DevOps—Restrict personal access token (PAT) creation—now available in public preview. This long-requested feature allows Project Collection Administrators to control who can create or regenerate PATs, helping reduce token sprawl and improve security. When enabled, only users on an allowlist can generate PATs, with optional support for packaging scopes. The policy also blocks global PAT usage unless explicitly permitted. Learn more about this policy and best practices for implementing this change in our blog post!
Removal of expired Azure DevOps OAuth Apps
As we prepare for the end-of-life for Azure DevOps OAuth apps in 2026, we'll begin regularly removing apps with secrets that have expired more than six months ago (180 days ago). App owners of these inactive apps will be informed and if there’s any further need for the app registration between now and Azure DevOps OAuth’s end-of-life in 2026, you are asked to rotate the app secret before June 9 when we begin app deletions. Learn more in our blog post.
New Microsoft Entra OAuth scopes
Azure DevOps has introduced two new Microsoft Entra OAuth scopes, vso.pats and vso.pats_manage to enhance security and control over personal access token (PAT) lifecycle management APIs. These scopes are now required for delegated flows that involve PAT creation and management, replacing the previously broad user_impersonation scope. This change enables app owners to reduce the permissions needed by their app to access PAT APIs. Downscope your user_impersonation apps to the minimum scopes needed today!
Request Access URL availability
Azure DevOps administrators can disable the Request Access policy and provide a URL for users to request access to an organization or project. This URL, previously available only to new users, is now also shown to existing users on the 404 page. To maintain confidentiality, the request access URL is displayed regardless of the project's existence.
Azure Pipelines
Managed DevOps Pools - Image Deprecations
Due to Windows Server 2019 hosted image deprecation and Ubuntu 20.04 deprecation, Managed DevOps Pools is deprecating the “Azure Pipelines – Windows Server 2019” image and Ubuntu 20.04 images. More details about the deprecations can be found here. You can read about life cycle of images offered by Managed DevOps Pools here.
New Triggers page
YAML pipelines provide you multiple powerful options to define when your pipeline should run. It's not always easy to reason if your pipeline is configured to run in response to an event, for example, a feeder pipeline completed.
This sprint, were introducing a Triggers page that gives you an overview of what triggers you have defined in your pipeline.
Imagine you have the following YAML pipeline defined in the main branch of a repo. Consider there's also a feature branch that has the same YAML pipeline code.
trigger:
- main

schedules:
  - cron: 0 0 * * *
    always: true
    displayName: Nightly build
    branches:
      include:
        - main

resources:
  pipelines:
    - pipeline: FabrikamFiber
      source: FabrikamFiber
      trigger: true
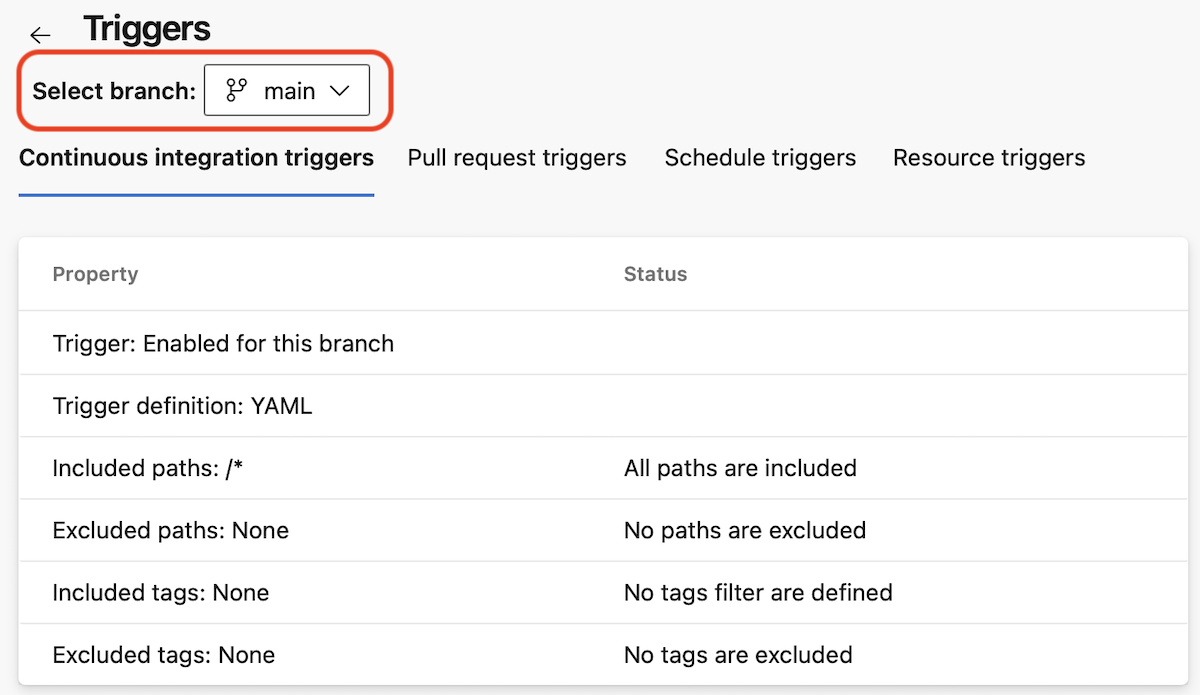
When you navigate to the Triggers page, you see the following
Notice the default branch of the pipeline, main, is preselected.
You see there is a Continuous integration trigger for this branch, and it's defined in the YAML file.
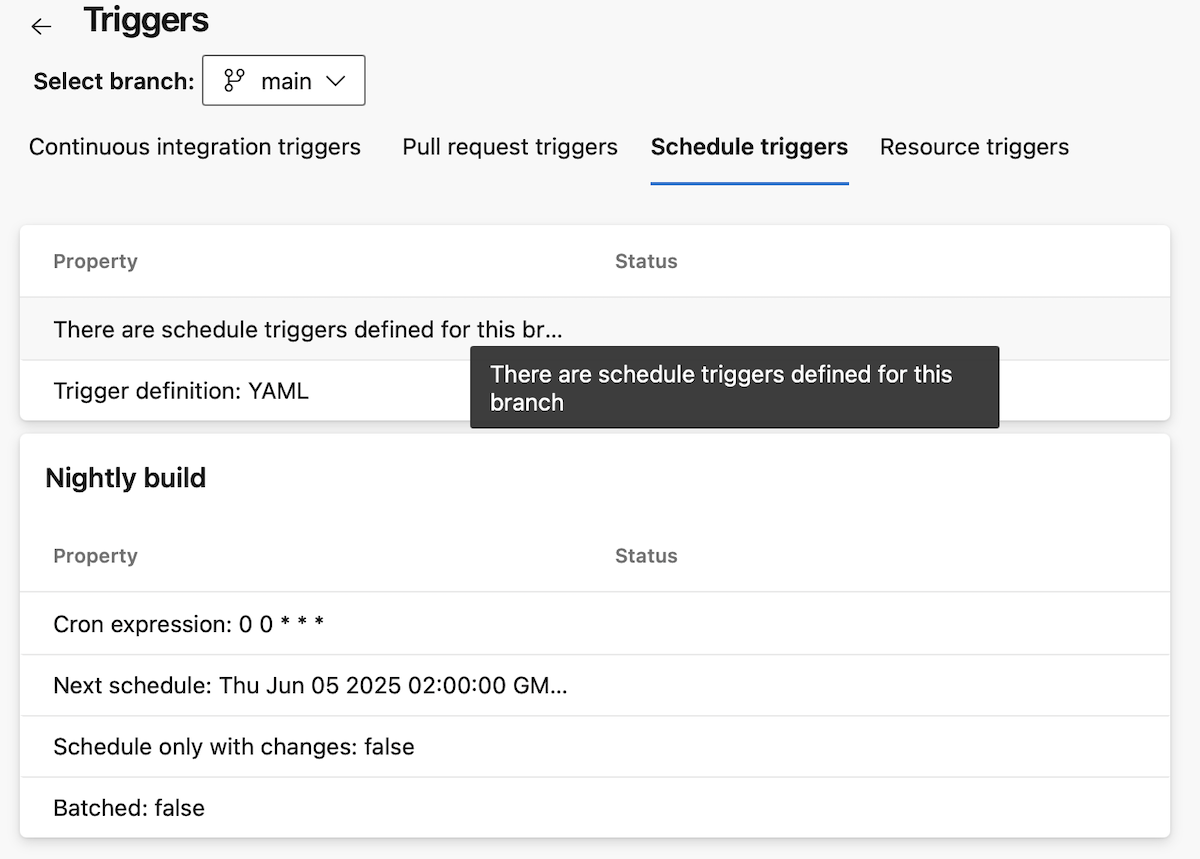
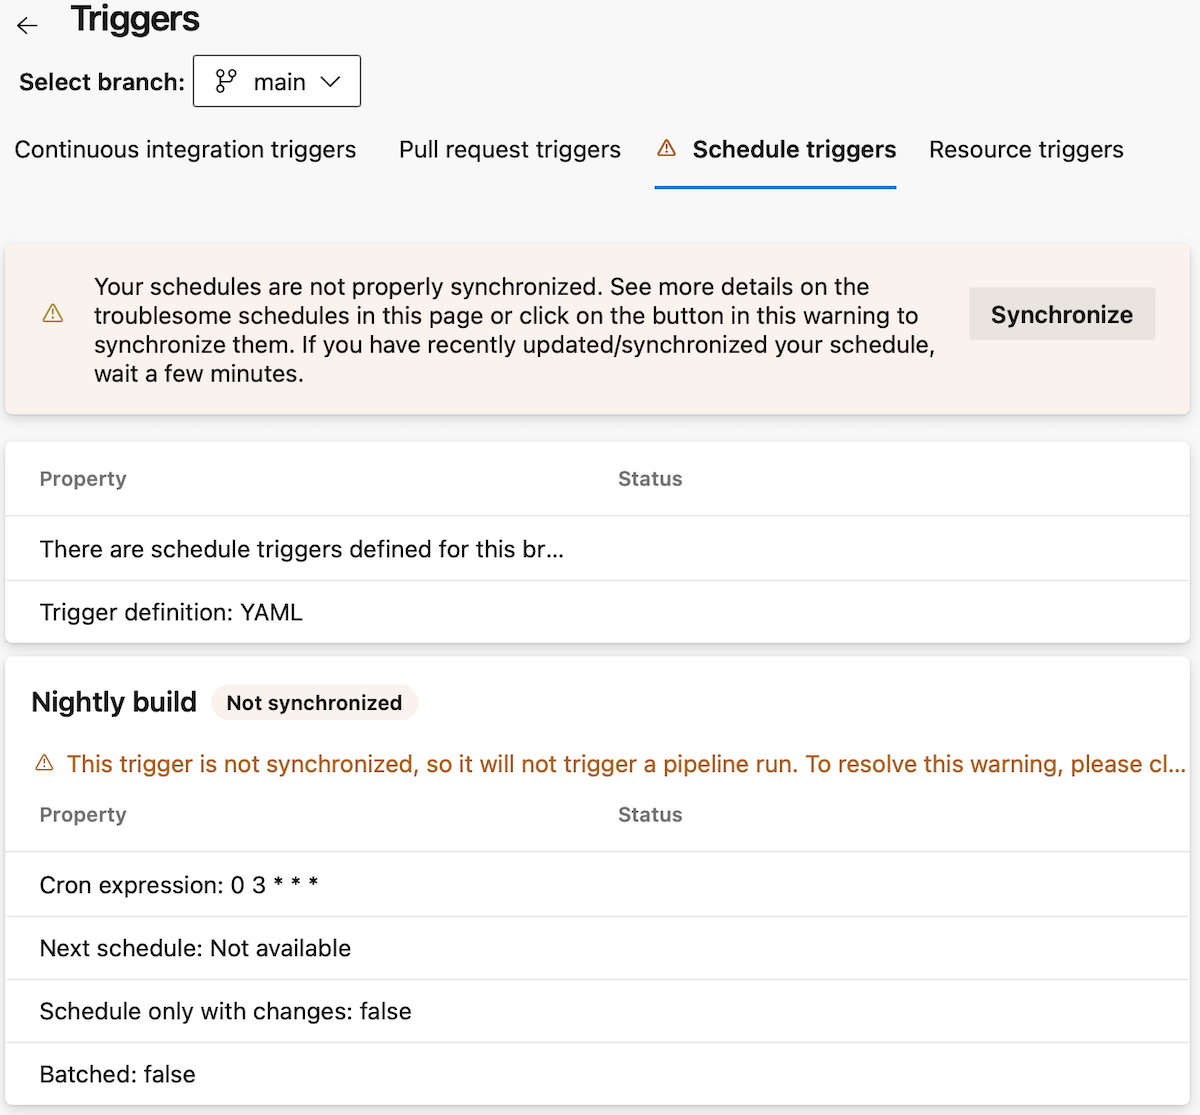
When you navigate to the Schedule triggers, you see there are triggers defined, and you can see their details.
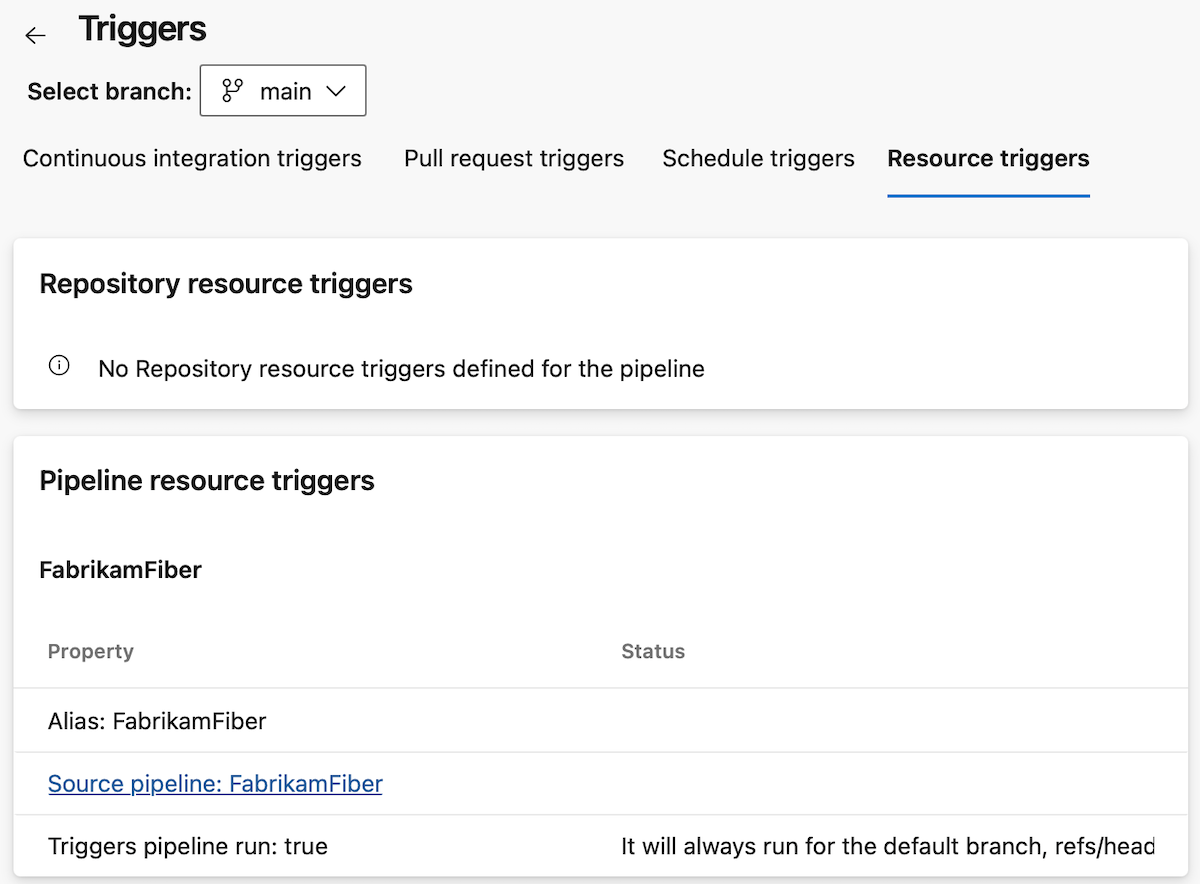
When you navigate to the Resource triggers section, you see the defined resource triggers and their details.
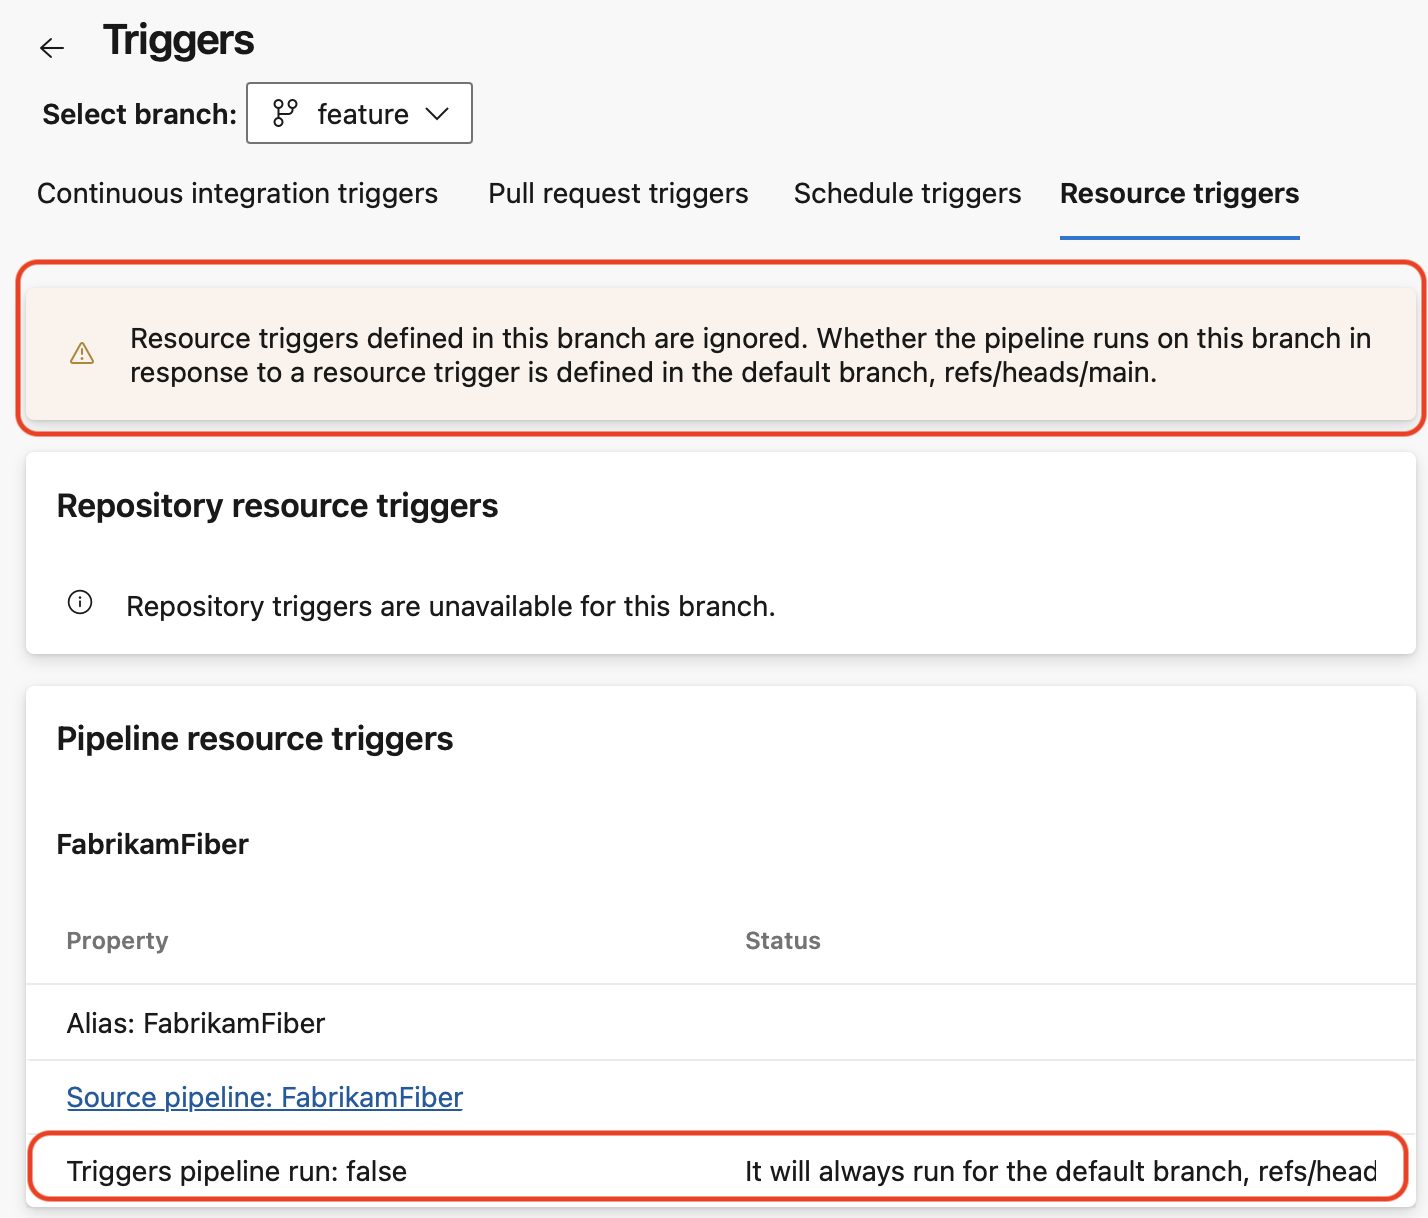
You can switch branches, from main to feature, to see what triggers you defined for the feature branch.
In the Resource triggers tab, when not on the default branch, you get a warning telling you the triggers defined for this branch are ignored.
When trigger definitions were not correctly processed by the system, you get a warning and indications on how to solve the problem.
StringList parameter type
One of the top requested YAML pipelines features in the Developer Community is to define parameters that contain a list of items.
Starting with this sprint, we've added a new parameter type, named StringList, that provides this capability.
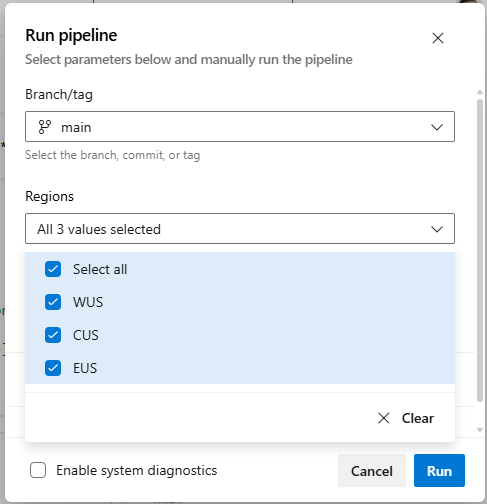
Say you want to allow those who queue pipeline runs to choose which regions they want to deploy a payload to. Now you can do this as shown in the example below.
parameters:
- name: regions
  type: stringList
  displayName: Regions
  values:
    - WUS
    - CUS
    - EUS
  default:
    - WUS
    - CUS
    - EUS

stages:
- ${{ each stage in parameters.regions}}:
  - stage: ${{stage}}
    displayName: Deploy to ${{stage}}
    jobs:
    - job:
      steps:
      - script: ./deploy ${{stage}}
When queuing this pipeline, you have the option of choosing multiple regions to deploy to, as shown in the following screenshot.
See the full YAML code of a pipeline run
YAML pipelines are composable. You may extend a template, to ensure your pipelines runs the necessary static analysis tools, and include templates to run common stages or jobs or tasks.
Debugging such pipelines was not easy, because you couldn't see the full YAML code it was running.
Say you have the following pipeline:
parameters:
- name: PoolName
  type: string
  default: Azure Pipelines
- name: VmImage
  type: string
  default: ubuntu latest

extends:
  template: security-enforcing-template.yml
  parameters:
    jobs:
    - template: job.monitoring.yml
    - template: job.build.yml
      parameters:
        PoolName: ${{parameters.PoolName}}
        VmImage: ${{parameters.VmImage}}
There are three templates used here. Each template may use conditional expressions based on parameter and variable values to determine the actual jobs or steps to run.
Furthermore, when looking at old pipeline runs, you don't know if the pipeline's code is the same now as when the run ran.
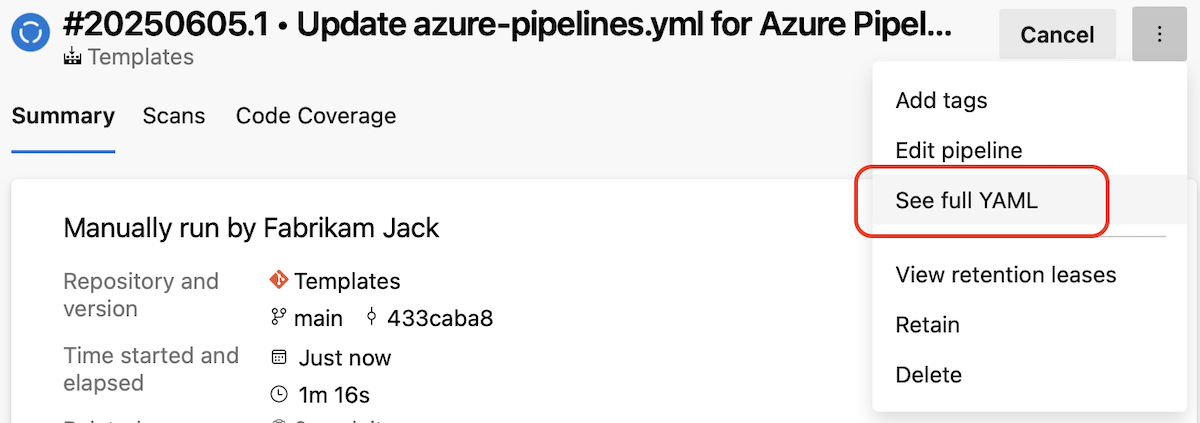
In this sprint, we're adding a new functionality that allows you to easily see the full YAML code of a pipeline run.
Azure Test Plans
Introducing New Test Plans directory
Stay organized and save time with the New Test Plans Directory. We are introducing several enhancements to help you manage test plans more efficiently, giving you greater control over your workspace and reducing repetitive tasks.
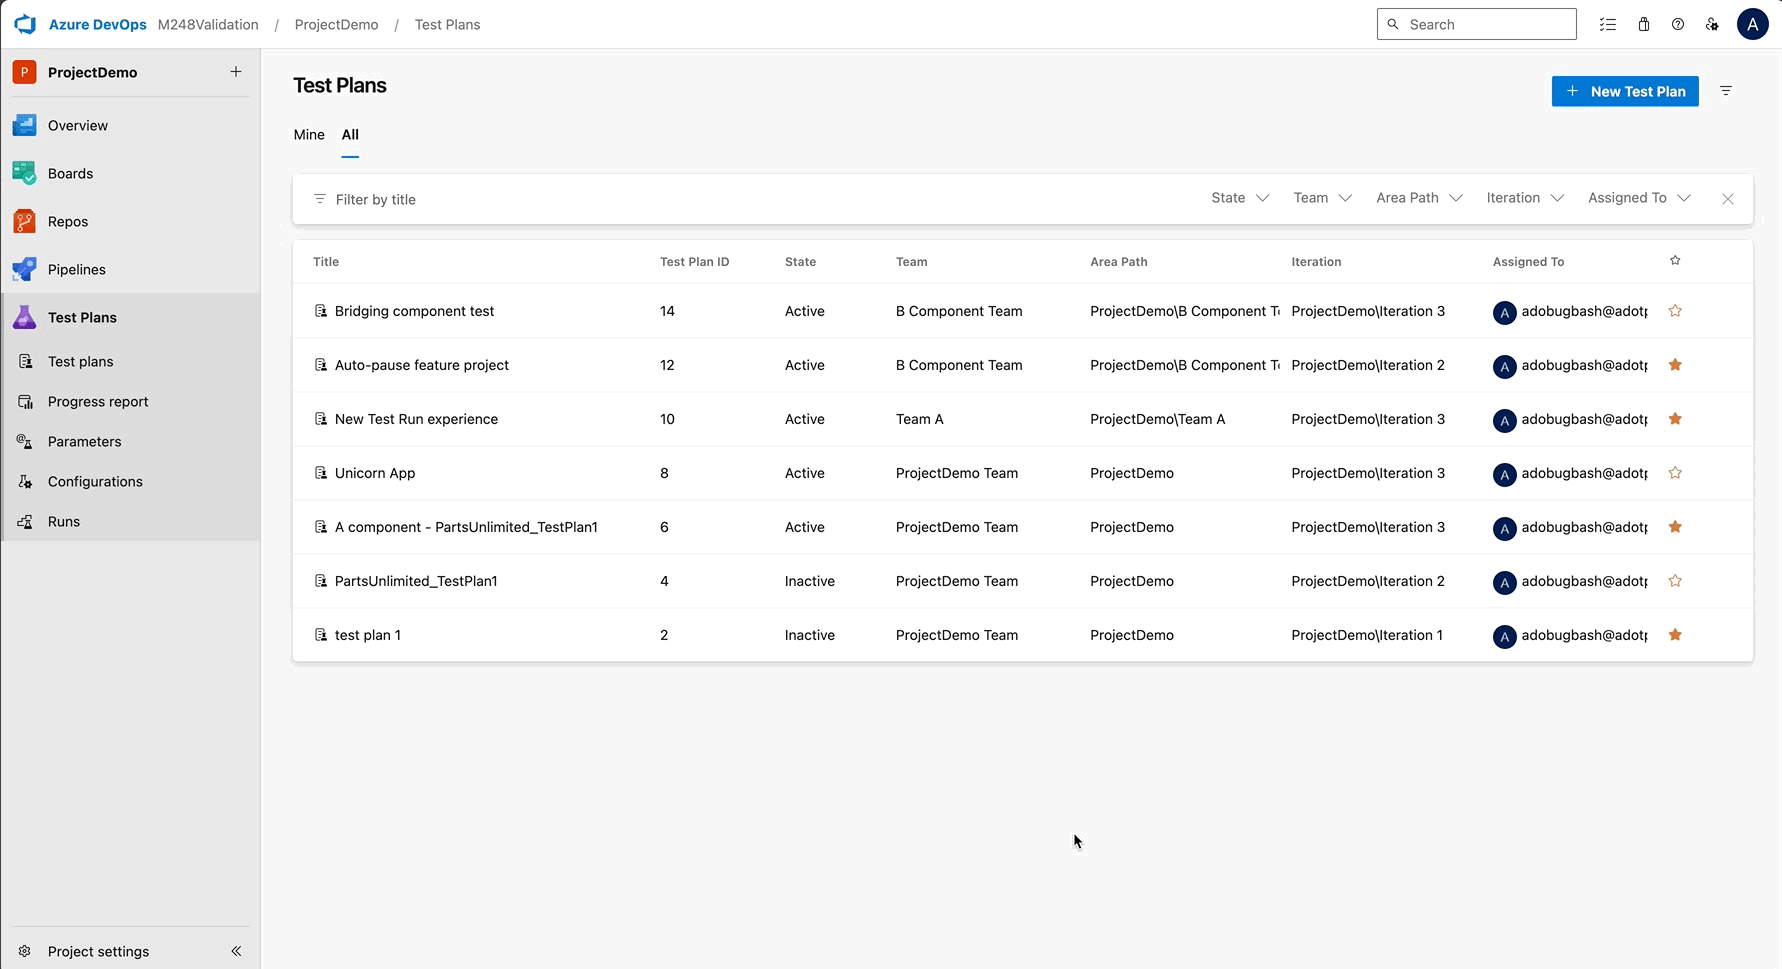
Here’s what’s new:
Cleaner UI Design: Navigate your test plans with ease using a modern interface that improves readability and reduces clutter, allowing you to focus on your tasks without distractions.
Column Sorting: Find what you need faster by sorting columns based on name, status, or other key attributes. This feature helps you quickly organize and prioritize your test plans for better productivity.
Team Filter in the All tab: Focus on what matters by filtering test plans by team, ensuring you only see relevant plans that align with your work and goals.
Persistent Filters: Save time with persistent filters that remember your settings. When you return to the page, your previously applied filters will stay intact, providing an organized view without needing to reapply filters every time.
These updates are designed to streamline your workflow, reduce repetitive tasks, and make it easier to track and manage your test plans. Give it a try and let us know via email what you think!
Advanced Test Case result history
Easily track key test run details with new enhancements to the test case result page. You’ll see critical information like Run ID, Pipeline ID, Owner, Iteration Path, and Area Path displayed right on the page, providing a complete view of each test run at a glance.
We've added horizontal scrolling for longer values and customizable columns, allowing you to personalize your layout and keep your preferences saved at the user level. To help you move faster, Run IDs and rows are clickable, giving you quick access to the Test Run view for deeper insights. These updates aim to improve visibility, save time, and streamline your workflow, making it easier to track and manage your test runs efficiently. Give it a try and let us know via email if you have any feedback. We would love to hear from you!
View Test Case State in Execute tab
You can now add the "Test Case State column" to the Execute tab to quickly see the status of each test case. Whether it’s Approved, In Progress, or any other state, this update gives you clearer visibility into test readiness without switching browser tabs or running complex queries.
The column is optional and can be enabled via the column picker. It also aligns with the existing State filter, allowing you to filter and view test case states side by side, all in one place.
This enhancement helps ensure testers begin execution with test cases that are truly Ready or Approved, reducing the risk of running incomplete or draft items, and making your test runs more efficient from the start.
Default resume for paused test case
Quickly resume your paused test cases with a single click. We've made "Resume" the default action for paused test cases, allowing you to pick up right where you left off without extra navigation. This update makes it faster and easier to continue your work without interruption.
To further protect your progress, we're introducing a confirmation prompt to prevent accidental overwrites of paused test progress. This safeguard ensures your partially saved work stays intact, giving you peace of mind while managing your test runs. Give it a try and let us know via email what you think!
Next steps
Note
These features will roll out over the next two to three weeks. Head over to Azure DevOps and take a look.
How to provide feedback
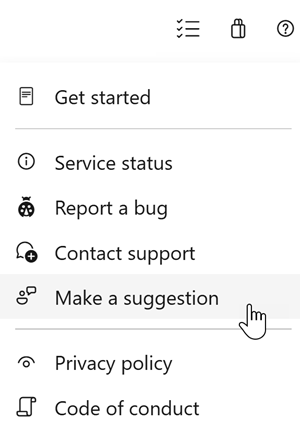
We would love to hear what you think about these features. Use the help menu to report a problem or provide a suggestion.
You can also get advice and your questions answered by the community on Stack Overflow.


