Note
Access to this page requires authorization. You can try signing in or changing directories.
Access to this page requires authorization. You can try changing directories.
Filters limit the data presented in dashboard visualizations so that users can focus on data that meets specific criteria. This page explains available filter types and how to work with them.
Filter interactivity and scope
Dashboard authors can configure filters to be interactive, enabling viewers to adjust values dynamically or statically, where the dashboard author predefines filter values. Interactive filters let dashboard viewers select the dataset values in related visualizations. A dashboard editor configures static filter values and applies them only to the widget where they are configured, enabling unique views of the same dataset across widgets.
Dashboard filters operate at different scopes, each with specific characteristics:
Global filters: Interactive filters that apply across all pages in a dashboard for visualizations that share one or more datasets. Viewers can adjust these values dynamically, and changes affect the entire dashboard. See Global filters.
Page-level filters: Interactive filter widgets that apply to all visualizations on the same page that share one or more datasets. Viewers can modify these values to change the view for that specific page.
Widget-level filters: Static filters that apply only to individual visualization widgets where they are configured. Dashboard authors set filters with values that viewers cannot change. These filters create unique views of the same dataset across different widgets.
Global filters
To view all global filters, click the ![]() filter icon in the upper-left corner of the dashboard. A panel opens on the right side of the dashboard.
filter icon in the upper-left corner of the dashboard. A panel opens on the right side of the dashboard.
To create a global filter:
- Click the
 filter icon in the upper-left corner of the dashboard canvas.
 - Click +. The filter configuration panel opens on the right side of the canvas.
- Set up the filter configuration as you would any other interactive filter widget. For examples of setting up filter widgets, see Dashboard filter types.
Note
When you publish a dashboard with the global filters panel open, the panel remains open for viewers when they first load the published dashboard.
Filter widgets
Filter widgets are interactive elements that allow viewers to adjust page-level filter values on dataset fields and parameters.
To create a filter widget:
- Click Add a filter (field/parameter) to add a filter widget. Then, place the filter on a page in the dashboard canvas. The filter is selected and a configuration panel opens on the right side of the screen.
- Turn on Widget title to show a title field in the widget. Edit the title on the widget.
- Turn on Description.
- From the Filter drop-down menu in the configuration panel, select Date range picker.
- Click the
 plus icon next to the Fields menu. Click tpep_pickup_datetime from the drop-down menu.
Note
Query-based parameters combine a field filter and a parameter filter in a single widget. For more information, see Query-based parameters.
Set default filter values
Default values are used when the dashboard is refreshed without selecting a new filter value. To set a default value, select a value from the Default value drop-down in the filter widget's configuration settings.
Filters apply to the entire dataset. For small datasets, filters are applied in the browser to optimize performance. If the dataset is larger, the filter is added to the query that is run in the SQL warehouse. See Dataset optimization and caching.
Filter on fields
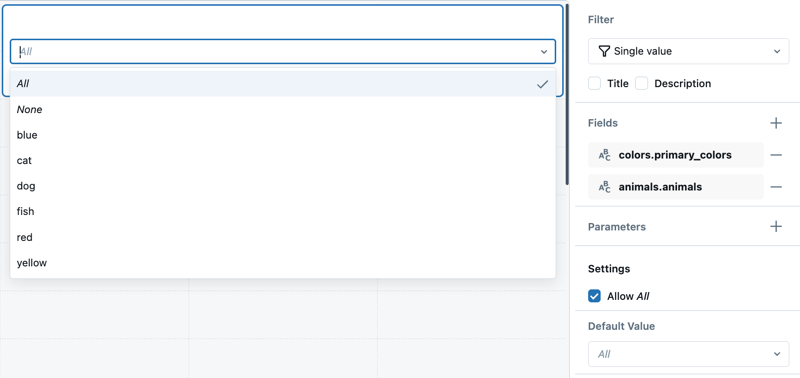
Field filters narrow data by specific dataset fields. For example, a field filter might limit data to a particular date range based on a date field in a dataset. Field filters can be connected to one or more datasets, allowing dynamic changes to available filter values based on selections. To connect a filter to fields from more than one dataset, add multiple Fields, up to one per dataset. The filter applies to all visualizations built on the selected datasets. Selecting a value for one filter dynamically changes the available values shown in the drop-down menus for other filters. The following image shows a filter configuration panel set to filter on two fields.
Filter on parameters
Parameter filters modify the SQL query directly, offering dynamic query adjustments. Filters can be connected to one or more parameters. To connect a filter to more than one parameter, add multiple Parameters in the filter configuration panel. A default value set in a filter widget overrides the default value set in the query editor. If a filter is connected to a parameter, it runs a query against the SQL warehouse, regardless of the dataset size. See Work with dashboard parameters.
You can set parameter values to accept one of the following data types:
- String
- Numeric
- Integer
- Decimal
- Date
- Date and Time
- Date Range
- Date and Time Range
Should I filter on a field or a parameter?
The following table compares filtering directly on dataset fields with filtering using parameters.
| Filtering type | Description | Performance | Versatility |
|---|---|---|---|
| Filtering on a field | Applied directly to dataset fields without modifying the dataset. | Typically faster. Small datasets can be filtered in the browser. Large datasets are filtered by re-running the query with the filter predicate applied. See Dataset optimization and caching. | Limited to filtering resolved dataset results. Cannot be used in subqueries or in custom conditional logic. |
| Filtering on a parameter | Substitutes values directly into the dataset query at runtime. | Requires re-running the query whenever the parameter value changes. | Can be used in subqueries, conditional logic, or to modify query structure. |
Filter types
Field and parameter filters support various filter types:
- Field filters: Single value, multiple values, date picker, date range picker, text entry, range slider.
- Parameter filters: Single value, multiple values, date picker, date range.
For examples that show how to configure different filter types, see Dashboard filter types.
Filters in published dashboard URLs
Published dashboards store field filters and parameter selections in the URL. This allows users to bookmark or share a dashboard with specific filter configurations. When a user opens the URL, the dashboard loads with those filter values already applied.
Filter identifiers are not stored as named values. Each filter is identified by a combination of the page name value and widget name value, separated by a tilde (~). These values are automatically generated by default. The filter identifier and value are passed as part of the URL to load the dashboard with the specified filter selection.
Note
The name key appears in the serialized file that defines the dashboard and is not accessible from the Azure Databricks UI. It is separate from the "displayName" value, which defines the page name shown in the UI. See Edit a dashboard file.
The following example shows the structure of a dashboard URL with a selected filter value:
<databricks-instance>/dashboardsv3/<dashboard-id>/published?o=<workspace-id>&f_<page-name>~<widget-name>=<filter-value>
- The first part of the URL identifies the published dashboard. See Dashboard URL and ID.
- The section that identifies the filter starts with
f_and is followed by thepage-nameandwidget-name, separated by a tilde (~). - The value to the right of the equals sign (
=) is the selected filter value.
The page-name and widget-name values are automatically generated when the dashboard is created. You can edit these names in the serialized lvdash.json file. The names persist across operations such as import, export, and republish. See Edit a dashboard file.
Access and set filter values in the URL
The following example shows a URL for a published dashboard that includes a selected filter value:
<databricks-instance>/dashboardsv3/<dashboard-id>/published?o=<workspace-id>&f_53eadf26~3490f286=10013
This example references a dashboard with three filters: Time Range, Pickup Zip, and Dropoff Zip. Only the Pickup Zip filter is assigned a value. In the URL, it has been set to 10013 using the identifier f_53eadf26~3490f286.
To create a dashboard similar to the one used in this example, see Create a dashboard.
Specify relative date range values in the URL
If a relative time filter is used, such as Last 5 minutes or Last 12 hours, the corresponding value appears in the URL.
The following example shows a URL with the Last 12 hours selected.
<databricks-instance>/dashboardsv3/<dashboard-id>/published?o=<workspace-id>&f_53eadf26~3490f286=now-12h
In this case, the filter identifier f_53eadf26~3490f286 is set to the relative value now-12h.
Static widget filters
Static widget-level filters display a view of the dataset set by the dashboard author. These apply only to the widget where they are configured, enabling unique views of the same dataset in different widgets. Unlike global and page-level filters, static widget filters apply only to the visualization widget where they are configured. Their filter values cannot be changed by dashboard viewers.
Example use case
Suppose you are creating a sales dashboard that analyzes regional performance. You use a dataset with sales data for all regions. By applying static widget filters, you can configure one widget to display sales for Region A and another widget to display sales for Region B. This approach allows viewers to compare regional performance side by side, even though both widgets draw from the same dataset. Because static widget filters are fixed, viewers cannot modify the filters, ensuring the dashboard always presents a consistent view of the data.
Add a static widget-level filter
To add a static widget-level filter to a visualization:
Add a visualization widget to the draft dashboard canvas.
With the new widget selected, choose a dataset from the Dataset drop-down in the configuration panel.
Click Show filters. A Filter fields option appears under the dataset title. For datasets that include parameters, a Parameters section also appears.
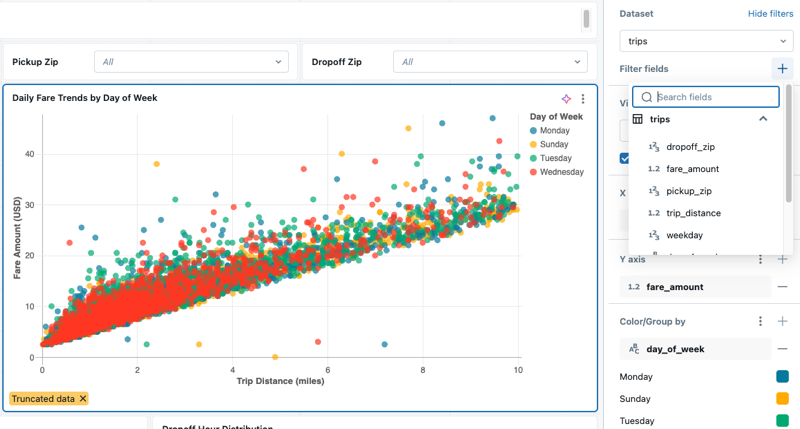
To add a field filter, do the following:
- Click the plus sign to the right of the Filter fields heading and choose a field from the drop-down menu.
- By default, the filter value is set to All. Use the drop-down menu to choose a new value. Navigate away from the drop-down menu to show the visualization with the new filter applied.
- Review your dashboard.
To learn about setting a static widget-level parameter, see Static widget parameters.