Note
Access to this page requires authorization. You can try signing in or changing directories.
Access to this page requires authorization. You can try changing directories.
In this quickstart, you get started with Carbon optimization, ensuring you have the right level of access and permissions to view and act on emissions data. Following the steps helps you effectively manage and reduce carbon emissions in your Azure environment.
Prerequisites
Before you can use this quickstart, you need:
An active Azure subscription. If you don't have an Azure subscription, you can create a free account.
Carbon optimization data is published monthly, so you need at least one month of Azure usage to see data.
An Azure account with the following role-based access control (RBAC) roles assigned to you. Without the right roles, you can't view or act on the emissions data. To learn how to assign roles, see Assign Azure roles using the Azure portal. For more information about carbon optimization roles, see Assign access to carbon optimization.
Role Description Carbon Optimization Reader Used to view and analyze carbon emissions data. • Subscription Reader
• Subscription Contributor
• Subscription Owner• Used to view emission reduction recommendations.
• Used to access subscription information.- Ensure you have access to the Carbon Optimization Reader role. This role is crucial as it grants you the necessary permissions to view and analyze carbon emissions data.
- Ensure that you have access to the Subscription Reader role for each subscription. The role is used to view emission reduction recommendations. It also provides access to subscription information.
Select subscriptions
You select subscriptions to view emissions data for only the ones you select.
- Sign in to the Azure portal.
- In the search box, type Carbon optimization and select Carbon optimization.
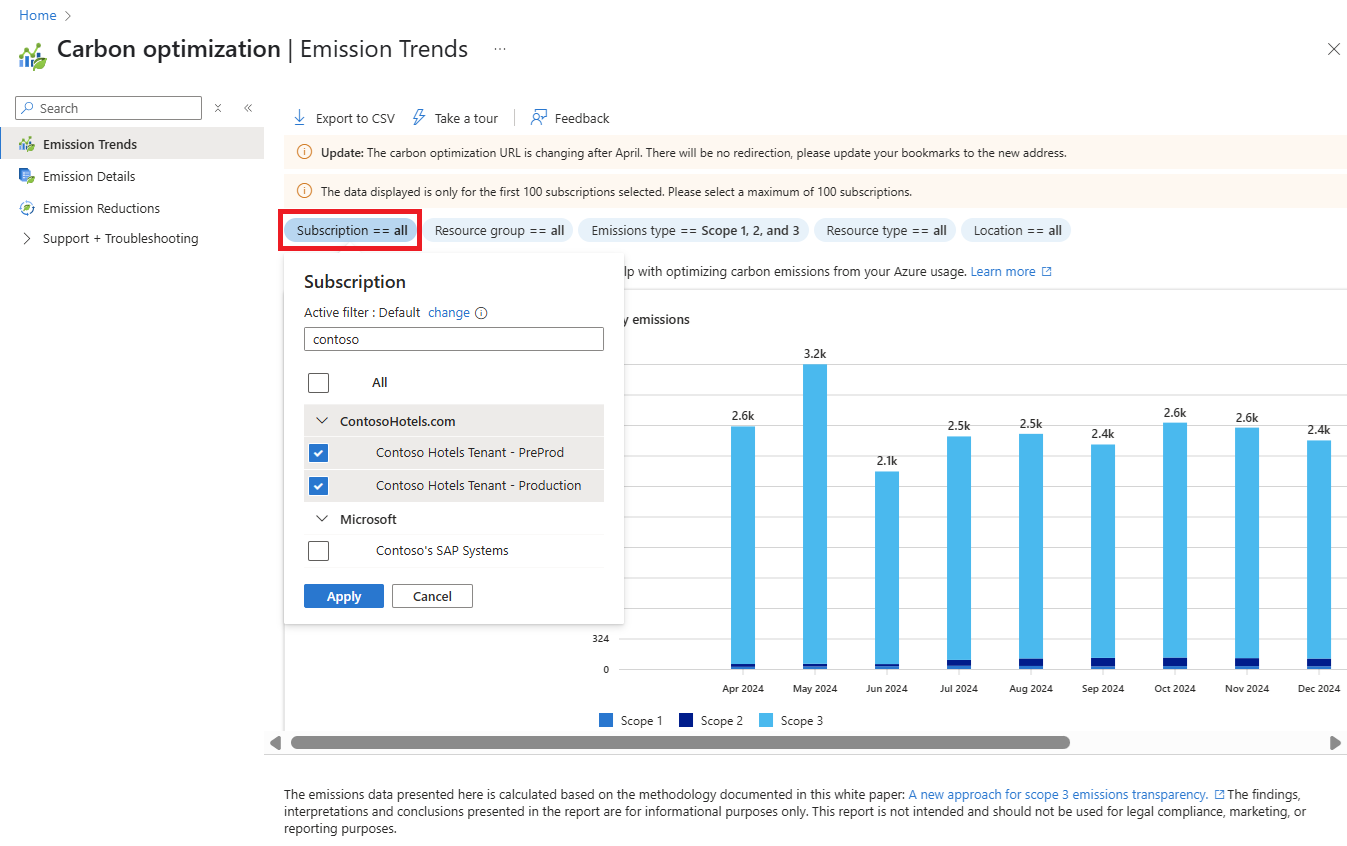
- On the Carbon optimization page, select Subscription to filter emissions data.
- We recommend that you select four to five subscriptions to focus on. Fewer subscriptions help to minimize the amount of data to return so that you can focus on optimizing specific areas. You can select up to 100 subscriptions. Select subscriptions and then select Apply.

View emission trends
Emission trends help you identify patterns for carbon emissions and areas that might need attention. The information shown helps you make informed decisions about where to focus optimization efforts.
- View your Monthly emissions trends bar chart over the last 12 months to assess trends and performance over time. You can hover over a bar chart to view a breakdown by emissions type.
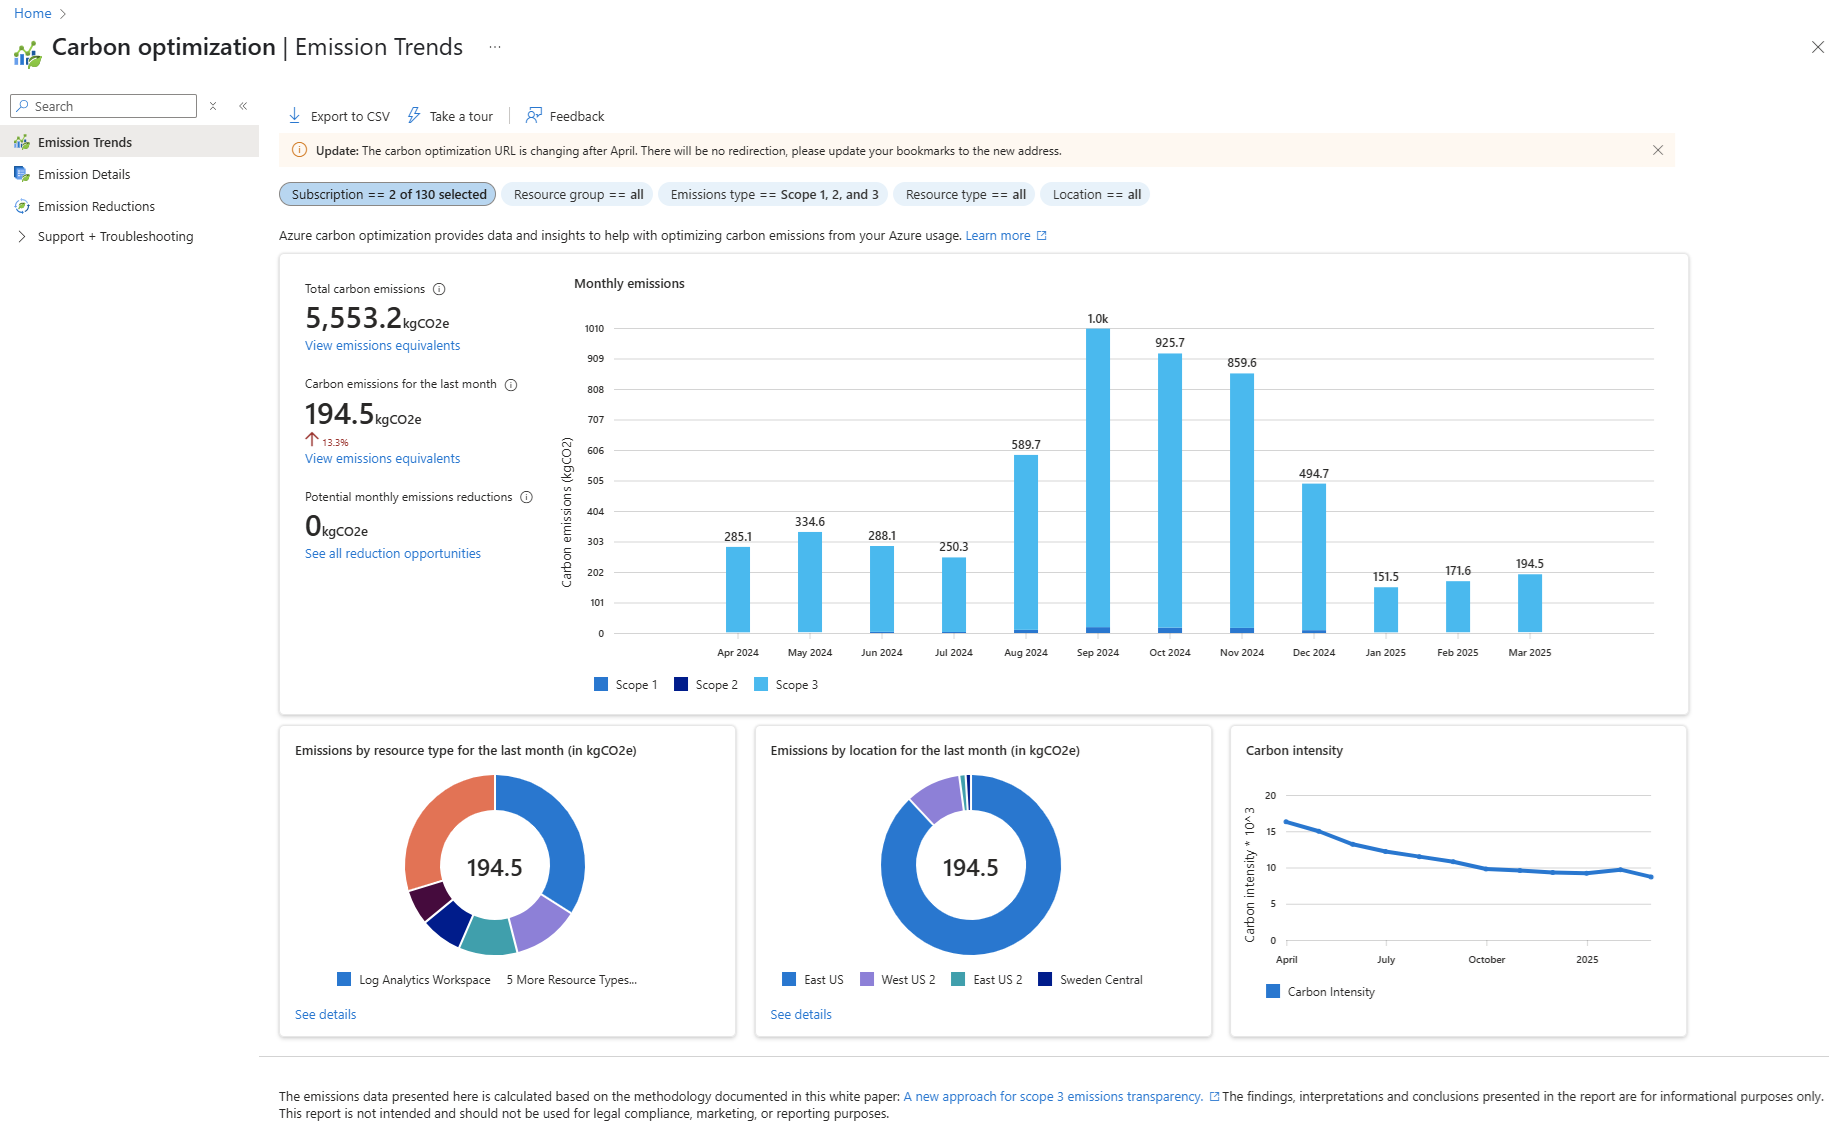
- View your Emissions by resource type for the last month. The donut chart shows emissions based on Azure resource type to identify top emitters and potential reductions.
- View Emissions by location for the last month. The donut chart shows emissions by Azure region.
- View Carbon intensity. The line graph shows your organization's allocation of Microsoft's carbon emissions. The value is divided by your company's cloud usage hours during the selected period. Usage hours are based on a sum of your company's Azure usage. Emissions usage calculations might differ from billing data.
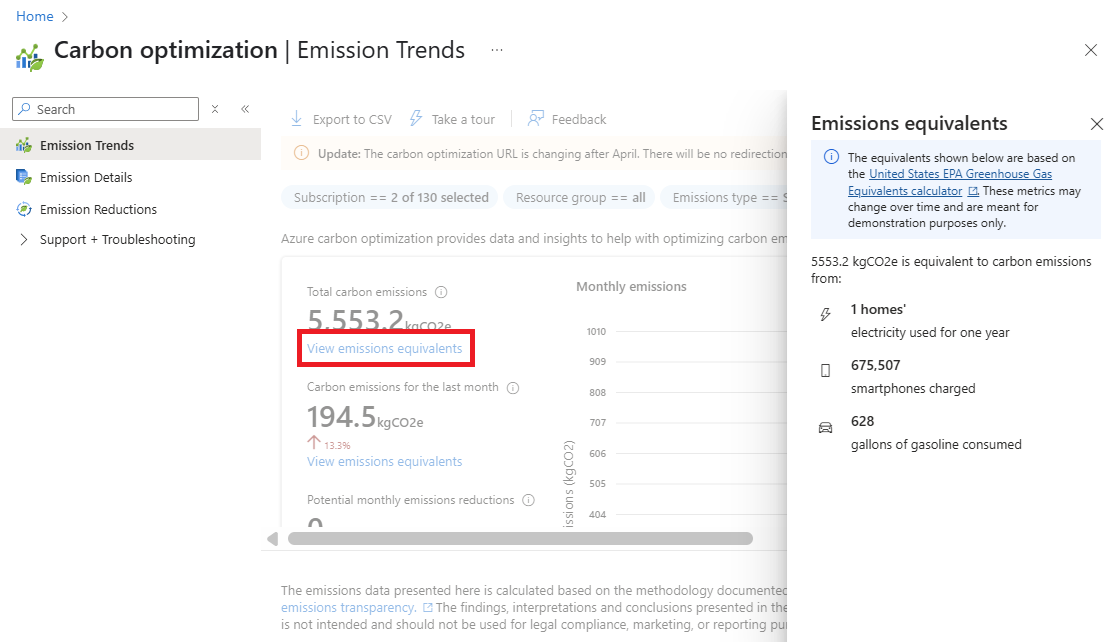
- Select View emissions equivalents to see equivalent carbon emissions for everyday real-world usage examples.


Analyze resource group emission details
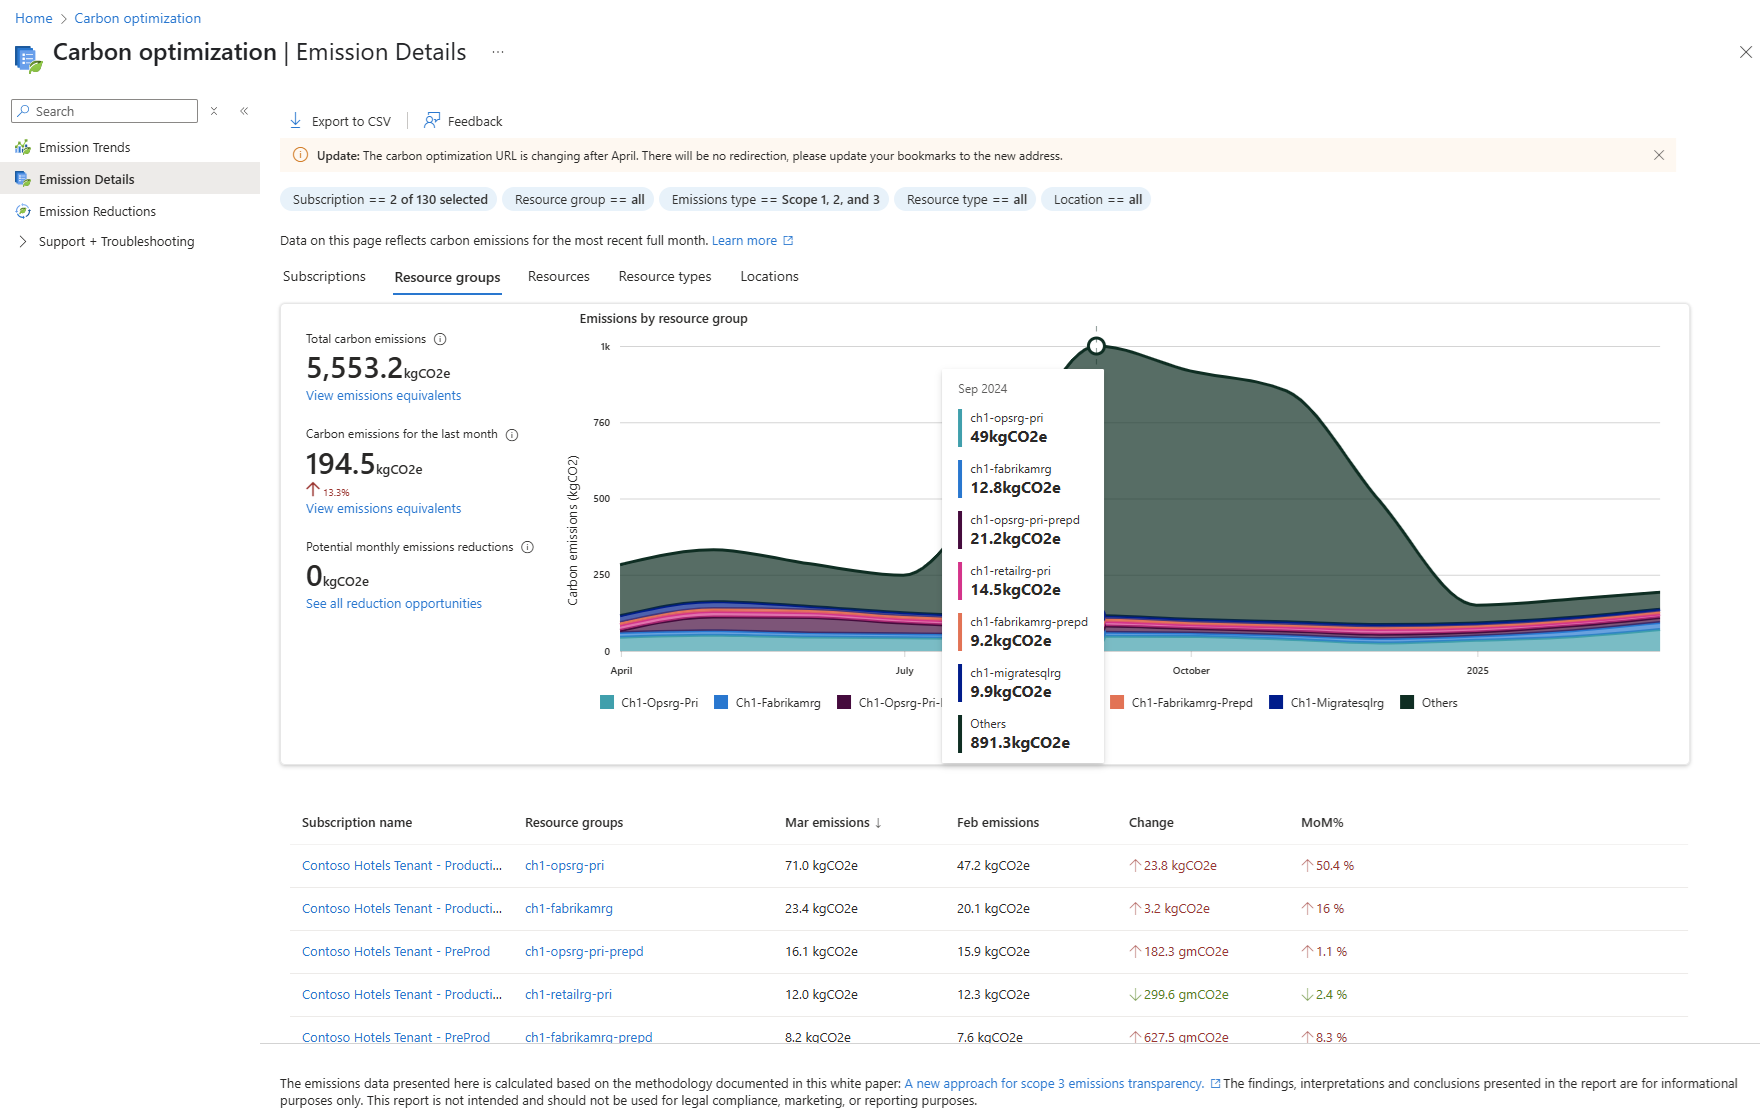
Resource group emissions details show monthly emissions for all the resources in the resource groups of the subscriptions you previously selected. You can also see the emissions change from the previous month and the percentage of change, month-to-month. The information can help you identify the main contributors to carbon emissions. By targeting these groups, you can achieve reductions in emissions.
- In the left navigation pane, select Emissions Details and then select the Resource groups tab.
- You can hover over the chart to view emissions for a specific month in the history.

Review recommendations from Emission Reductions
Emission Reductions provides recommendations to help you act to reduce emissions and optimize your carbon footprint. Recommendations identify idle and underutilized resources and show associated carbon and potential cost savings of implementing the recommendations.
Note
Cost savings shown in the following screenshots are fictitious and aren't based on actual usage or billing data.
- In the left navigation pane, select Emission Reductions.
- Review the list of recommendations and then select one.
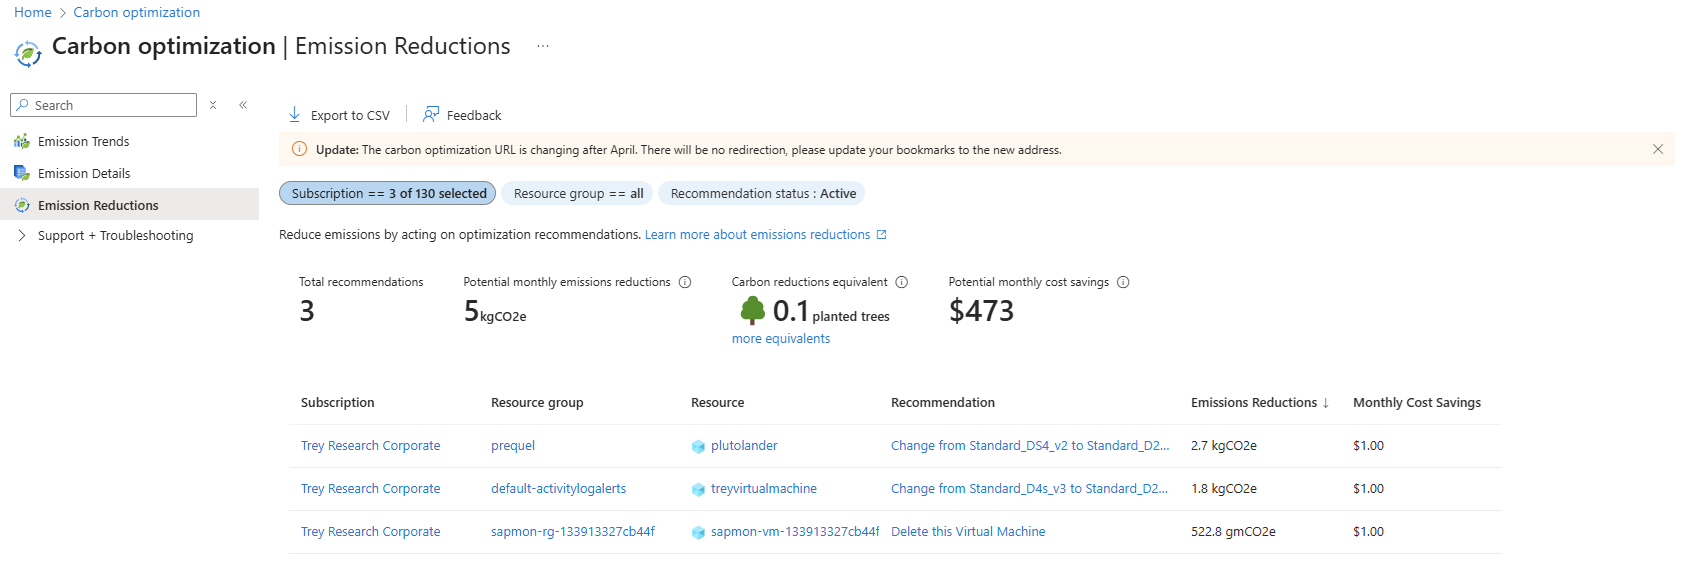
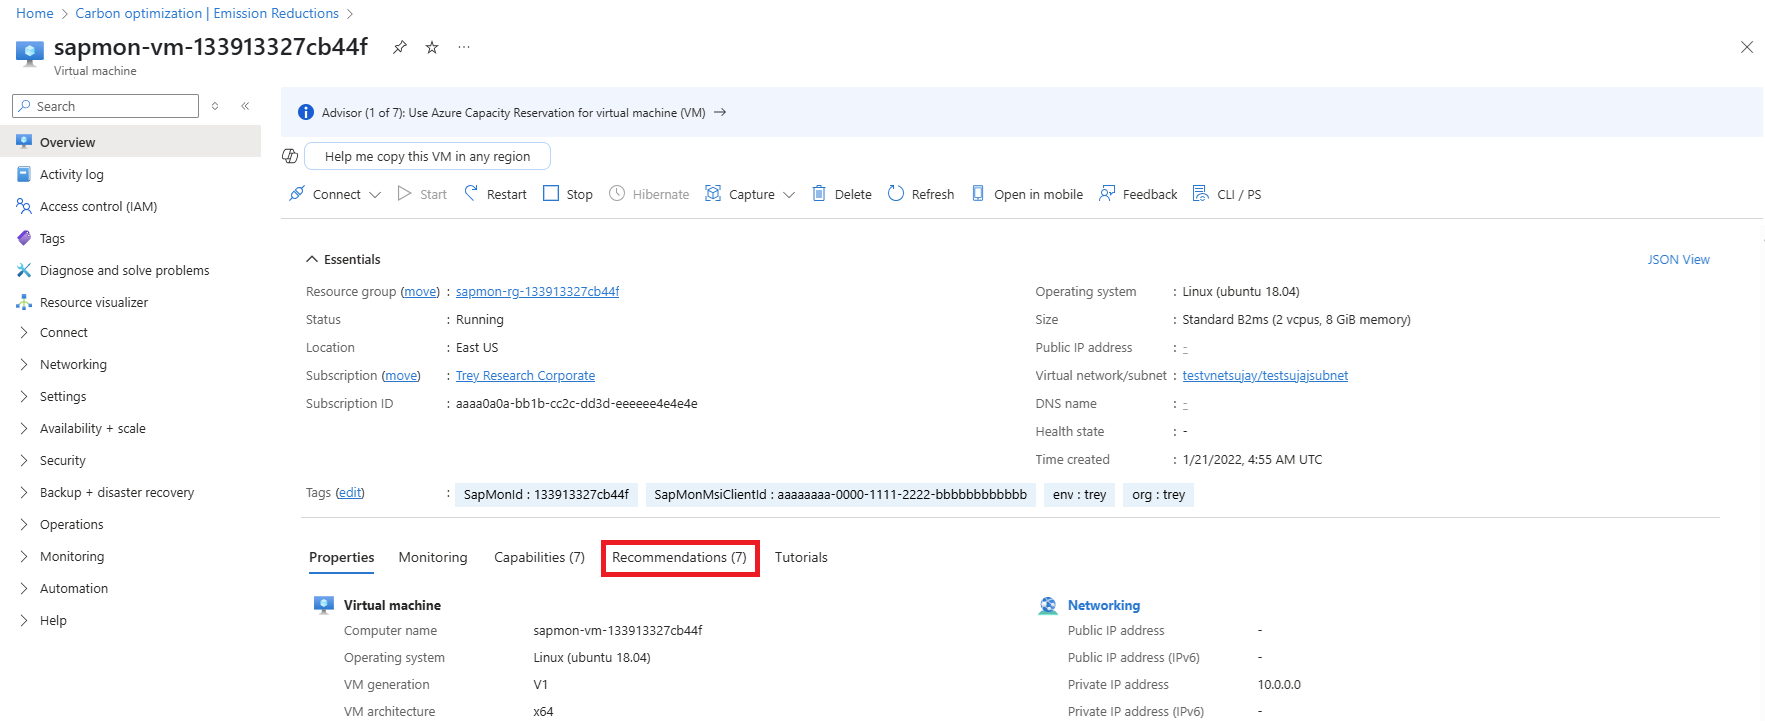
- For example, assume you select a Delete this Virtual Machine recommendation. Carbon optimization shows the following example. Select the Recommendations tab to view more detailed information.
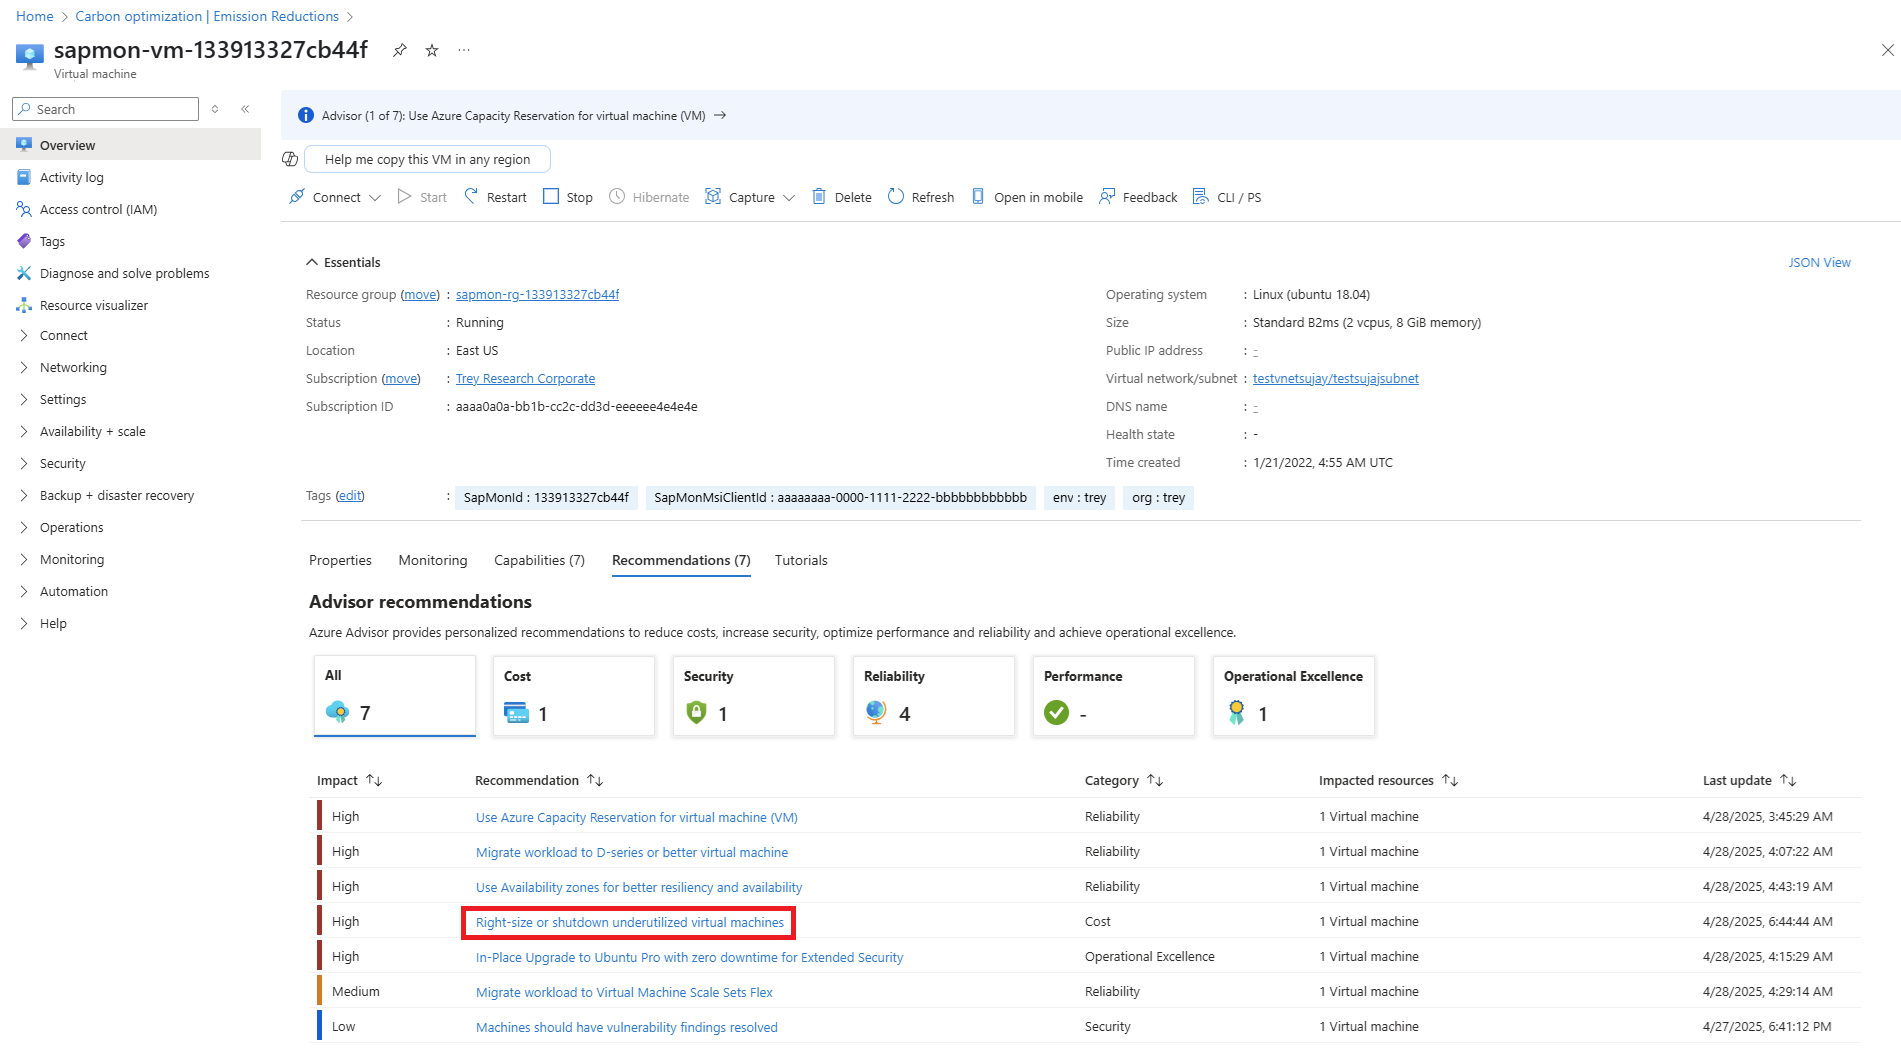
- Next, in the list of recommendations select the recommendation that corresponds to the one you selected previously. For this example, select Right-size or shutdown underutilized virtual machines.
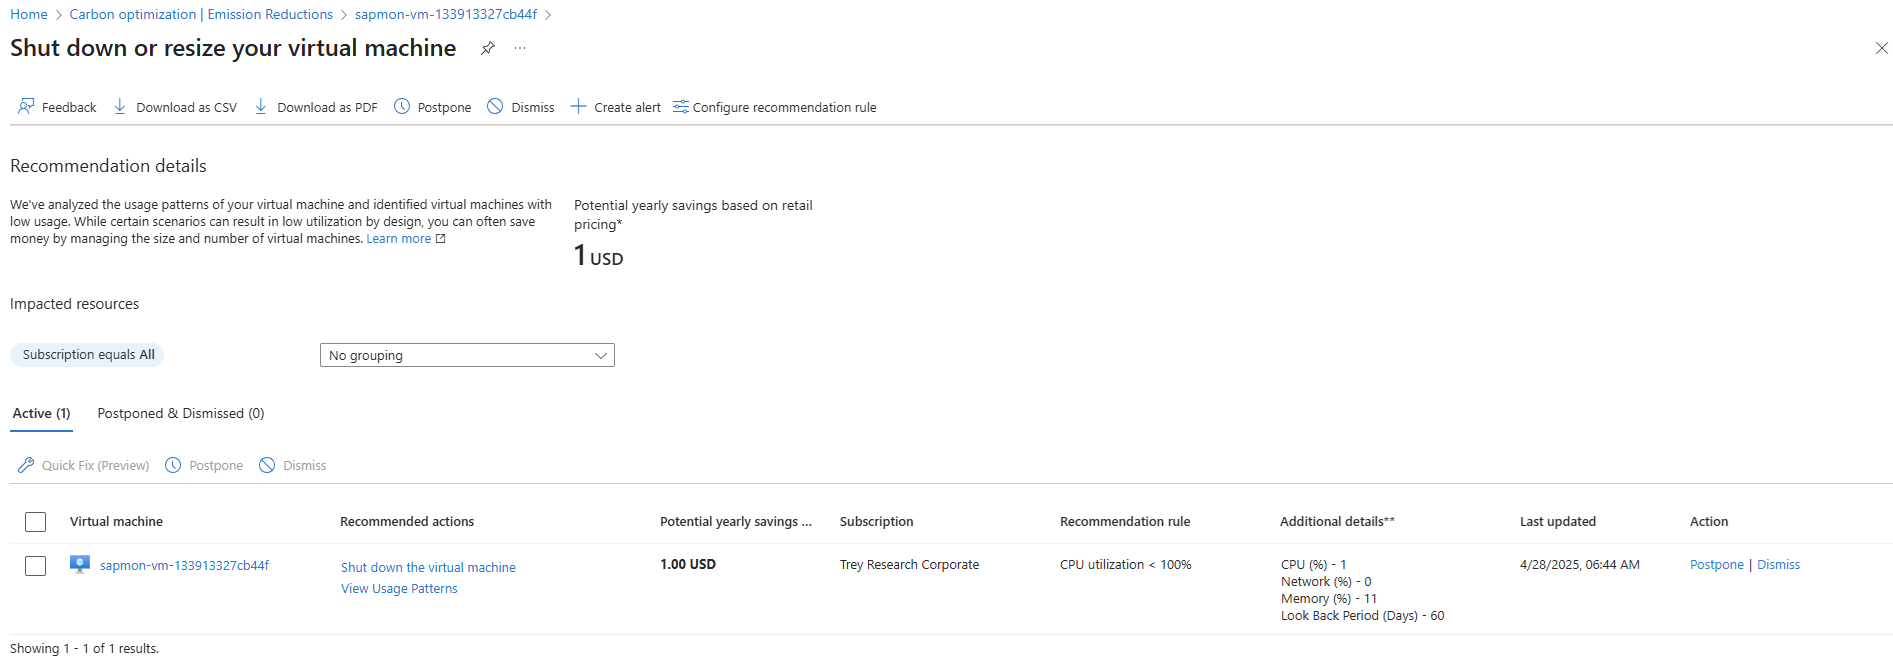
- In the recommendation details, we can see why the recommendation is to shut down the virtual machine (VM) in Additional details. It's because VM CPU usage is 1%, network usage is 0%, and memory usage is 11%.


Related content
- Assign carbon optimization roles to other people.
- Understand carbon optimization terminology.