Note
Access to this page requires authorization. You can try signing in or changing directories.
Access to this page requires authorization. You can try changing directories.
After you set up and configure Code Optimizations on your app, you can access and view any insights you receive.
Access Code Optimizations
You can access Code Optimizations through two entry points:
Code Optimizations consolidated overview page (preview)
View your Code Optimizations results by using the Code Optimizations overview page. In this consolidated overview, you can access results across multiple subscriptions for multiple Application Insights resources.

You can filter the consolidated results by searching for a filter field or setting the following filters:
| Filter | Description | Default |
|---|---|---|
| Time Range | Select the time range from which you want to view Code Optimizations results. | Last 24 Hours |
| Role | The role name assigned to the reporting services machine or workload. Can be updated through the Application Insights configuration. | All Roles |
| Subscription | The subscription that the insight belongs to. You can select more than one. | N/A |
| Application Insights | The Application Insights resource with which your application is associated. You can select more than one. | N/A |
| Insight Type | The type of issue, such as CPU, memory, blocking, and exceptions. | All Types |
You can then sort the columns in the insights results based on your desired view, including by:
- Performance issue
- The full name of the parent method
Individual Application Insights resources
You can access Code Optimizations specific to individual Application Insights resources from that resource's left menu. Select Investigate > Performance and select the Code Optimizations button from the top menu.

You can filter the consolidated results by searching for a filter field or setting the following filters:
| Filter | Description | Default |
|---|---|---|
| Time Range | Select the time range from which you want to view Code Optimizations results. | Last 24 Hours |
| Role | The role name assigned to the reporting services machine or workload. Can be updated through the Application Insights configuration. | All Roles |
| Insight Type | The type of issue, such as CPU, memory, blocking, and exceptions. | All Types |
You can then sort the columns in the insights results based on your desired view, including by:
- Performance issue
- The number of profiles that contained that issue
- The full name of the parent method
Interpret estimated Memory and CPU peak usage percentages
The estimated CPU and Memory are determined based on the amount of activity in your application. In addition to the Memory and CPU percentages, Code Optimizations also includes:
- The actual allocation sizes (in bytes)
- A breakdown of the allocated types made within the call
Memory
For Memory, the number is a percentage of all allocations made in the trace. For example, if an issue takes 24% memory, you spent 24% of your allocations in that call.
CPU
For CPU, the percentage is based on the number of CPUs in your machine (four core, eight core, etc.) and the trace time. For example, suppose your trace is 10 seconds long and you have 4 CPUs: you have a total of 40 seconds of CPU time. If the insight says the line of code is using 5% of the CPU, it's using 5% of 40 seconds, or 2 seconds.
Blocking
Shows where threads spent time waiting for resources such as I/O operations, locks, or sleeps. Blocking time is reported in seconds and aggregated across all threads and cores, so totals can exceed the capture duration, following the same aggregation rule as CPU metrics.
Use this metric to identify latency bottlenecks, such as:
- Lock contention between threads
- Synchronous I/O operations
- Blocking calls on asynchronous operations
Exceptions
Exception insights are extracted from the snapshots collected by the Snapshot Debugger. If Snapshot Debugger is enabled in your app, and snapshots are being collected, they're automatically processed for insight extraction in Code Optimizations.
View insights
After sorting and filtering the Code Optimizations results, you can select each insight to view the following details in a pane:
- Detailed description of the performance bug insight.
- The full call stack.
- Recommendations on how to fix the performance issue.
- The timeline of the issue's trend impact and threshold.
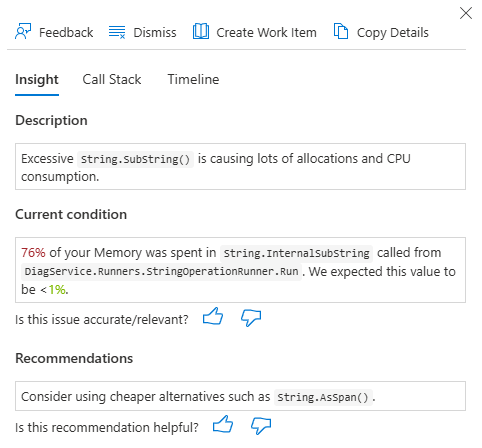
Insights
The Insights tab provides:
- A brief description of the selected issue.
- The current condition of your resource memory or CPU usage.
- An AI-generated recommendation for fixing the issue.
Note
If you don't see any insights, it's likely that the Code Optimizations service didn't notice any performance bottlenecks in your code. Check back to see if any insights appear.
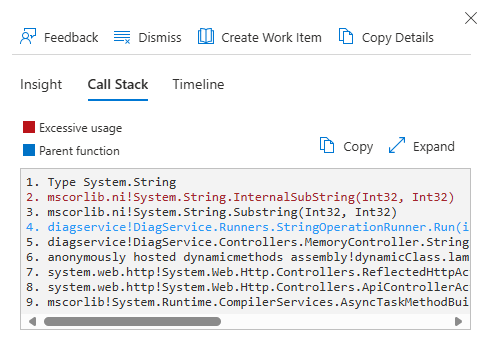
Call Stack
In the insights details pane, under the Call Stack heading, you can:
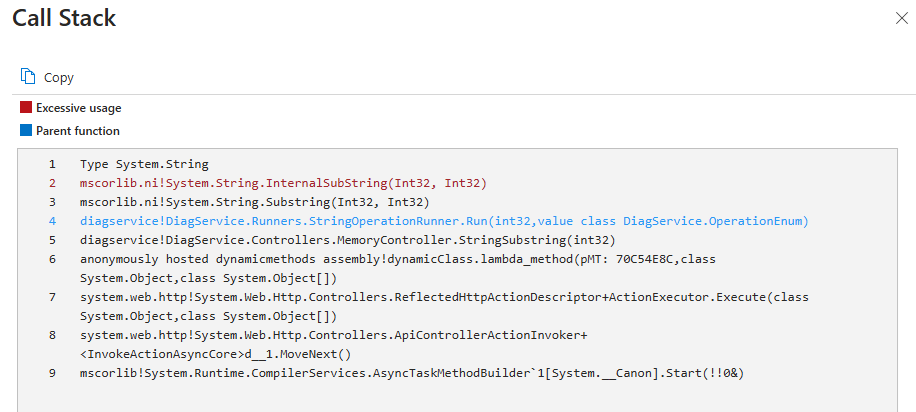
- Select Expand to view the full call stack surrounding the performance issue.
- Select Copy to copy the call stack.
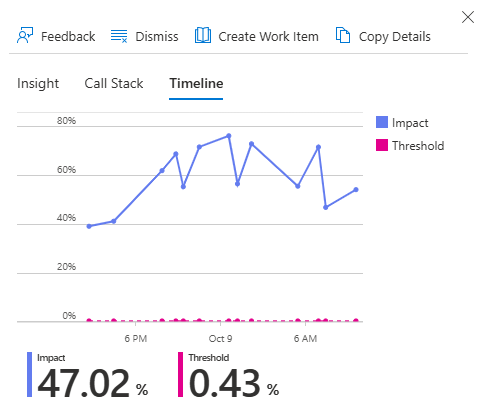
Timeline
In the details pane, under Timeline, you can also view a graph depicting the timeline of a specific performance issue's impact and threshold. The results vary depending on the filters you set. For example, a Memory "Inefficient String.SubString()" performance issue's insights seen over the last 24 hours might look like: