Note
Access to this page requires authorization. You can try signing in or changing directories.
Access to this page requires authorization. You can try changing directories.
Monitoring and observability play a key role in maintaining high performance and low cost of your AI workload deployments in Azure Kubernetes Service (AKS). Visibility into system and performance metrics can indicate the limits of your underlying infrastructure and motivate real-time adjustments and optimizations to reduce workload interruptions. Monitoring also provides valuable insights into resource utilization for cost-effective management of computational resources and accurate provisioning.
The Kubernetes AI Toolchain Operator (KAITO) is a managed add-on for AKS that simplifies deployment and operations for AI models in your AKS cluster.
In KAITO version 0.4.4 and later versions, the vLLM inference runtime is enabled by default in the AKS managed add-on. vLLM is a library for language model inference and serving. It surfaces key system performance, resource usage, and request processing for Prometheus metrics that you can use to evaluate your KAITO inference deployments.
In this article, you'll learn how to monitor and visualize vLLM inference metrics using the AI toolchain operator add-on with Azure Managed Prometheus and Azure Managed Grafana on your AKS cluster.
Before you begin
- This article assumes that you have an existing AKS cluster. If you don't have a cluster, create one by using the Azure CLI, Azure PowerShell, or the Azure portal.
- Install and configure Azure CLI version 2.47.0 or later. To find your version, run
az --version. To install or update, see Install the Azure CLI.
Prerequisites
- Install and configure kubectl, the Kubernetes command-line client. For more information, see Install kubectl.
- Enable the AI toolchain operator add-on in your AKS cluster.
- If you already have the AI toolchain operator add-on enabled, update your AKS cluster to the latest version to run KAITO v0.4.4 or later.
- Enable the managed service for Prometheus and Azure Managed Grafana in your AKS cluster.
- Have permissions to create or update Azure Managed Grafana instances in your Azure subscription.
Deploy a KAITO inference service
In this example, you collect metrics for the Qwen-2.5-coder-7B-instruct language model.
Start by applying the following KAITO workspace custom resource to your cluster:
kubectl apply -f https://raw.githubusercontent.com/Azure/kaito/main/examples/inference/kaito_workspace_qwen_2.5_coder_7b-instruct.yamlTrack the live resource changes in your KAITO workspace:
kubectl get workspace workspace-qwen-2-5-coder-7b-instruct -wNote
Machine readiness can take up to 10 minutes, and workspace readiness can take up to 20 minutes depending on the size of your language model.
Confirm that your inference service is running and get the service IP address:
export SERVICE_IP=$(kubectl get svc workspace-qwen-2-5-coder-7b-instruct -o jsonpath='{.spec.clusterIP}')

echo $SERVICE_IP
Surface KAITO inference metrics to the managed service for Prometheus
Prometheus metrics are collected by default at the KAITO /metrics endpoint.
Add the following label to your KAITO inference service so that a Kubernetes
ServiceMonitordeployment can detect it:kubectl label svc workspace-qwen-2-5-coder-7b-instruct App=qwen-2-5-coderCreate a
ServiceMonitorresource to define the inference service endpoints and the required configurations to scrape the vLLM Prometheus metrics. Export these metrics to the managed service for Prometheus by deploying the followingServiceMonitorYAML manifest in thekube-systemnamespace:cat <<EOF | kubectl apply -n kube-system -f - apiVersion: azmonitoring.coreos.com/v1 kind: ServiceMonitor metadata: name: prometheus-kaito-monitor spec: selector: matchLabels: App: qwen-2-5-coder endpoints: - port: http interval: 30s path: /metrics scheme: http EOFCheck for the following output to verify that
ServiceMonitoris created:servicemonitor.azmonitoring.coreos.com/prometheus-kaito-monitor createdVerify that your
ServiceMonitordeployment is running successfully:kubectl get servicemonitor prometheus-kaito-monitor -n kube-systemIn the Azure portal, verify that vLLM metrics are successfully collected in the managed service for Prometheus.
In your Azure Monitor workspace, go to Managed Prometheus > Prometheus explorer.
Select the Grid tab and confirm that a metrics item is associated with the job named
workspace-qwen-2-5-coder-7b-instruct.Note
The
upvalue of this item should be1. A value of1indicates that Prometheus metrics are successfully being scraped from your AI inference service endpoint.
Visualize KAITO inference metrics in Azure Managed Grafana
The vLLM project provides a Grafana dashboard configuration named grafana.json for inference workload monitoring. Navigate to the bottom of this page and copy the entire contents of the
grafana.jsonfile.Go to the bottom of the examples page and copy the entire contents of the
grafana.jsonfile: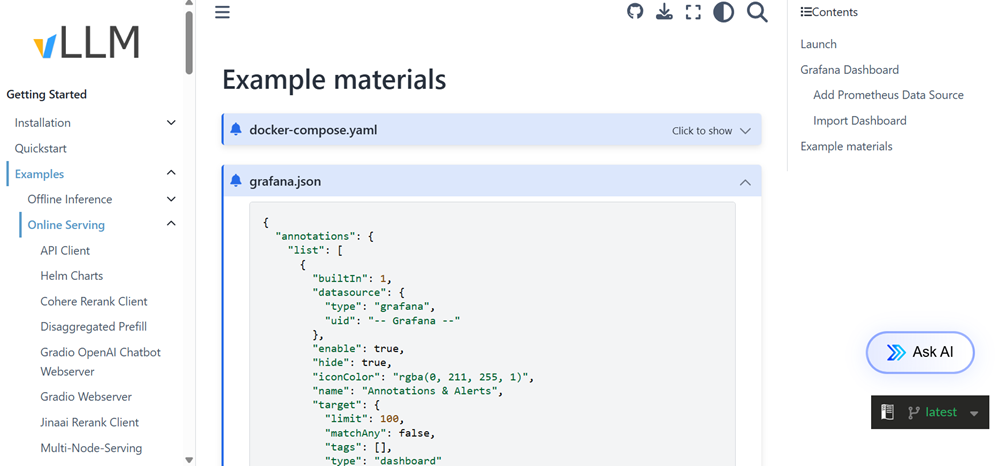
Complete the steps to import the Grafana configurations into a new dashboard in Azure Managed Grafana.
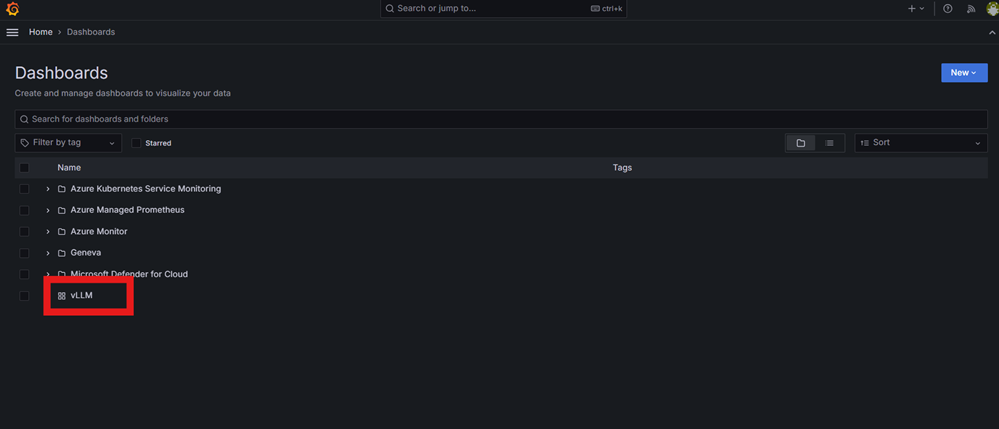
Go to your Managed Grafana endpoint, view the available dashboards, and select the vLLM dashboard.
To begin collecting data for your selected model deployment, confirm that the datasource value shown at the top left of the Grafana dashboard is your instance of the managed service for Prometheus you created for this example.
Copy the inference preset name defined in your KAITO workspace to the model_name field in the Grafana dashboard. In this example, the model name is qwen2.5-coder-7b-instruct.
In a few moments, verify that the metrics for your KAITO inference service appear in the vLLM Grafana dashboard.
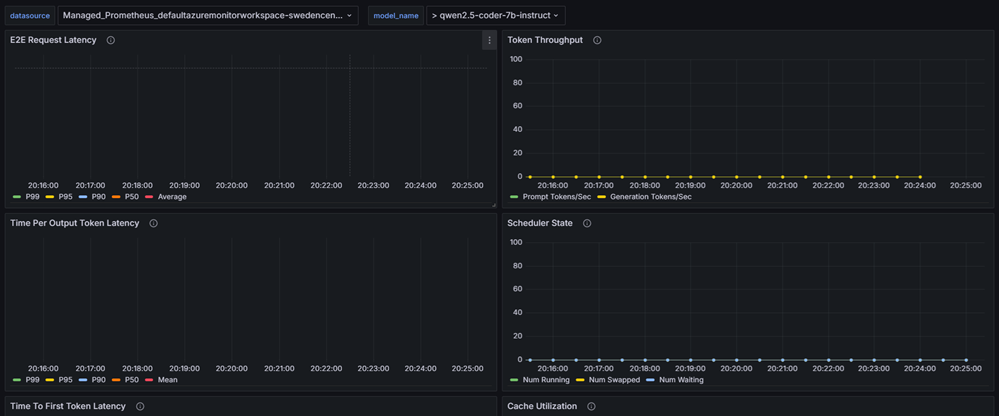
Note
The value of these inference metrics remains 0 until the requests are submitted to the model inference server.


Related content
- Monitor and visualize your AKS deployments at scale.
- Fine-tune an AI model by using the AI toolchain operator add-on in AKS.
- Learn about AKS GPU workload deployment options on Linux and Windows.
Collaborate with us on GitHub
The source for this content can be found on GitHub, where you can also create and review issues and pull requests. For more information, see our contributor guide.

Azure Kubernetes Service