Note
Access to this page requires authorization. You can try signing in or changing directories.
Access to this page requires authorization. You can try changing directories.
Syed Aslam Basha here from the Information Security Tools team.
This blog post is in continuation with How To: Identify Memory Leaks In An Unmanaged Application blog post. I will show how to setup perfom to collect data for the selected counter in Windows 7.
Steps to configure perfmon:
- Click on start –> Click on Run
- Enter Perfmon and press enter, click on Yes
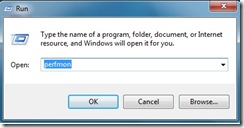
- It launches performance monitor
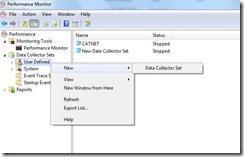
- Click on Data Collector Sets
- Select User Defined node and right click on it
- Select New and Data collector Set
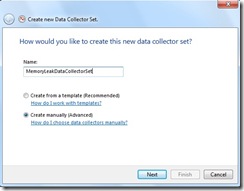
- Enter a Name, select create manually and click on Next
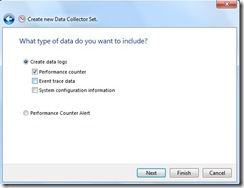
- Select create data logs, performance counter and click on Next
- Click on Add
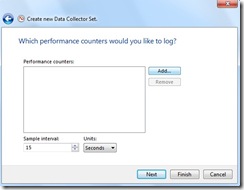
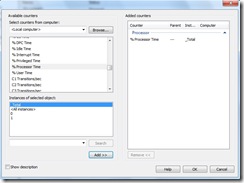
- Select the required counters say processor Time, Add and click on Ok
- Click on Next
- Browse to a folder, click on next
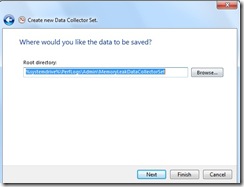
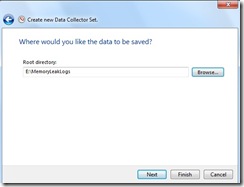
- You can enter run as user details by clicking on change button
- Select save and close and click on finish
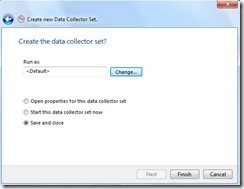
- The user data collector is created
- Right click on the newly crated data set and click on start
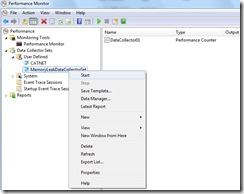
- Right click and select properties if you wish to change properties defined at any point of time
- Once you are done with your application testing, right click and select stop
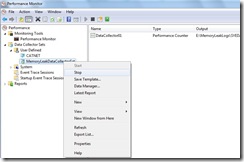
- The log file is created and stored at the folder mentioned in the above steps
- Open the log file and analyze the data for each counter
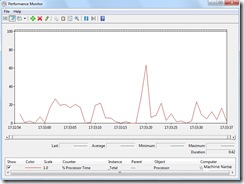
- Publish the results
-Syed Aslam Basha ( syedab@microsoft.com )
Microsoft Information Security Tools (IST) Team
Test Lead
---------------------------------------------------------
Please leave a comment if the blog post has helped you.