Note
Access to this page requires authorization. You can try signing in or changing directories.
Access to this page requires authorization. You can try changing directories.
Note this is part of a System Center 2016 – Operations Manager and Operations Management Suite (OMS) 101 Series: https://aka.ms/101
The first thing to determine is whether the performance data you need is already being collected in Operations Manager. The easiest way to do this is to create a view showing all performance counters
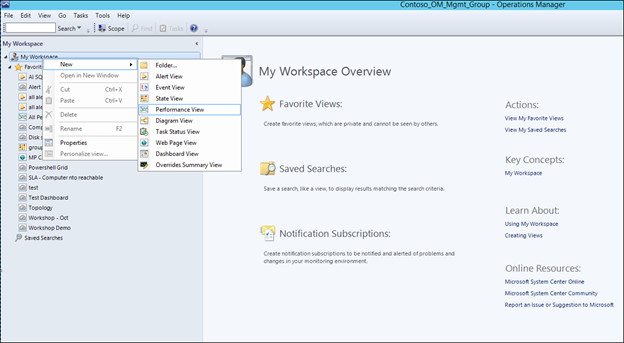
In My Workspace, Right-Click My favorites, choose New>Performance View:
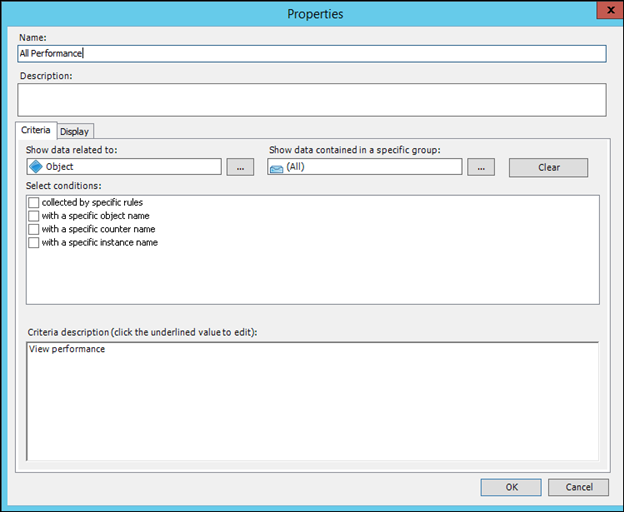
Give it a name such as 'All performance', leave all the other default settings, and click ok to create the view:
Change the "All Items' to 'Items by text Search' and type part of the performance object or counter that you're interested in. For this example, we are looking for SQLServer: SQL Statistics\Batch Requests/sec. Typing Statistics into the look for box, returns all counters / objects / rule names that have the word statistics in the title:
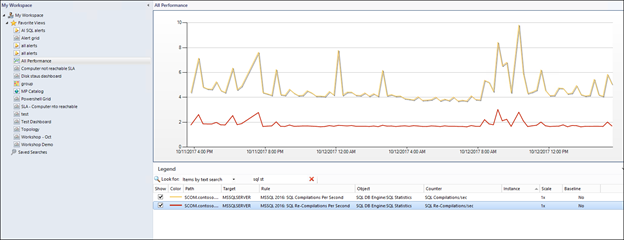
The above view shows that only the only counters collected by default for the SQL Server: SQL Statistics object are SQL Re-Compilations/Sec and SQL Compilations/Sec. This means we need to create a performance collection rule to collect the data that we want to collect and present in the above graph.
NOTE: Any comments and feedback greatly appreciated if you found this post helpful or have any corrections / suggestions. Cheers, Antoni